TMEM106C contributes to the malignant characteristics and poor prognosis of hepatocellular carcinoma
- PMID: 33591950
- PMCID: PMC7950261
- DOI: 10.18632/aging.202487
TMEM106C contributes to the malignant characteristics and poor prognosis of hepatocellular carcinoma
Abstract
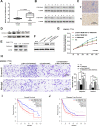
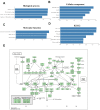
Transmembrane protein (TMEM) is a kind of integral membrane protein that spans biological membranes. The functions of most members of the TMEM family are unknown. Here, we conducted bioinformatic analysis and biological validation to investigate the role of TMEM106C in HCC. First, GEPIA and OncomineTM were used to analyze TMEM106C expression, which was verified by real-time PCR and western blot analyses. Then, the biological functions of TMEM106C were explored by CCK8 and transwell assays. The prognostic value of TMEM106C was analyzed by UALCAN. LinkedOmics was used to analyze TMEM106C pathways generated by Gene Ontology. A protein-protein interaction network (PPI) was constructed by GeneMANIA. We demonstrated that TMEM106C was overexpressed in HCC and that inhibition of TMEM106C significantly suppressed the proliferation and metastasis of HCC through targeting CENPM and DLC-1. Upregulation of TMEM106C was closely correlated with sex, tumor stage, tumor grade and prognosis. Overexpression of TMEM106C was linked to functional networks involving organelle fission and cell cycle signaling pathways through the regulation of CDK kinases, E2F1 transcription factors and miRNAs. Our data demonstrated that TMEM106C contributes to malignant characteristics and poor prognosis in HCC, which may serve as a prognostic biomarker and potential therapeutic target.
Keywords: TMEM106C; bioinformatics; hepatocellular carcinoma; metastasis; proliferation.
Conflict of interest statement
Figures


Similar articles
-
Transmembrane protein 106C promotes the development of hepatocellular carcinoma.J Cell Biochem. 2020 Nov;121(11):4484-4495. doi: 10.1002/jcb.29678. Epub 2020 Feb 9. J Cell Biochem. 2020. PMID: 32037603
-
The correlation of NLRC3 expression with the progression and prognosis of hepatocellular carcinoma.Hum Pathol. 2018 Dec;82:273-281. doi: 10.1016/j.humpath.2018.07.031. Epub 2018 Aug 4. Hum Pathol. 2018. PMID: 30081150
-
Unveiling expression patterns, mechanisms, and therapeutic opportunities of transmembrane protein 106C: From pan-cancers to hepatocellular carcinoma.World J Gastrointest Oncol. 2025 Feb 15;17(2):92437. doi: 10.4251/wjgo.v17.i2.92437. World J Gastrointest Oncol. 2025. PMID: 39958559 Free PMC article.
-
Upregulation of CENPM promotes hepatocarcinogenesis through mutiple mechanisms.J Exp Clin Cancer Res. 2019 Nov 8;38(1):458. doi: 10.1186/s13046-019-1444-0. J Exp Clin Cancer Res. 2019. PMID: 31703591 Free PMC article.
-
The roles and functions of TMEM protein family members in cancers, cardiovascular and kidney diseases (Review).Biomed Rep. 2025 Feb 11;22(4):63. doi: 10.3892/br.2025.1941. eCollection 2025 Apr. Biomed Rep. 2025. PMID: 39991002 Free PMC article. Review.
Cited by
-
High expression of TMEM200A is associated with a poor prognosis and immune infiltration in gastric cancer.Pathol Oncol Res. 2023 Jan 19;29:1610893. doi: 10.3389/pore.2023.1610893. eCollection 2023. Pathol Oncol Res. 2023. PMID: 36741965 Free PMC article.
-
A transmembrane protein family gene signature for overall survival prediction in osteosarcoma.Front Genet. 2022 Aug 5;13:937300. doi: 10.3389/fgene.2022.937300. eCollection 2022. Front Genet. 2022. PMID: 35991561 Free PMC article.
-
TMEM44 as a Novel Prognostic Marker for Kidney Renal Clear Cell Carcinoma is Associated with Tumor Invasion, Migration and Immune Infiltration.Biochem Genet. 2024 Apr;62(2):1200-1215. doi: 10.1007/s10528-023-10466-x. Epub 2023 Aug 10. Biochem Genet. 2024. PMID: 37561335 Free PMC article.
-
TMEM92 acts as an immune-resistance and prognostic marker in pancreatic cancer from the perspective of predictive, preventive, and personalized medicine.EPMA J. 2022 Jul 4;13(3):519-534. doi: 10.1007/s13167-022-00287-0. eCollection 2022 Sep. EPMA J. 2022. PMID: 36061829 Free PMC article.
-
TMEM200A is a potential prognostic biomarker and correlated with immune infiltrates in gastric cancer.PeerJ. 2023 Jun 29;11:e15613. doi: 10.7717/peerj.15613. eCollection 2023. PeerJ. 2023. PMID: 37404478 Free PMC article.
References
-
- Yang Y, Nagano H, Ota H, Morimoto O, Nakamura M, Wada H, Noda T, Damdinsuren B, Marubashi S, Miyamoto A, Takeda Y, Dono K, Umeshita K, et al.. Patterns and clinicopathologic features of extrahepatic recurrence of hepatocellular carcinoma after curative resection. Surgery. 2007; 141:196–202. 10.1016/j.surg.2006.06.033 - DOI - PubMed
Publication types
MeSH terms
Substances
LinkOut - more resources
Full Text Sources
Other Literature Sources
Medical
Molecular Biology Databases
Research Materials

