. 2021 Apr 1;131(7):e143988.
doi: 10.1172/JCI143988.

Endoplasmic reticulum-associated degradation is required for nephrin maturation and kidney glomerular filtration function

Affiliations

Endoplasmic reticulum-associated degradation is required for nephrin maturation and kidney glomerular filtration function

Sei Yoshida et al. J Clin Invest. .

Abstract

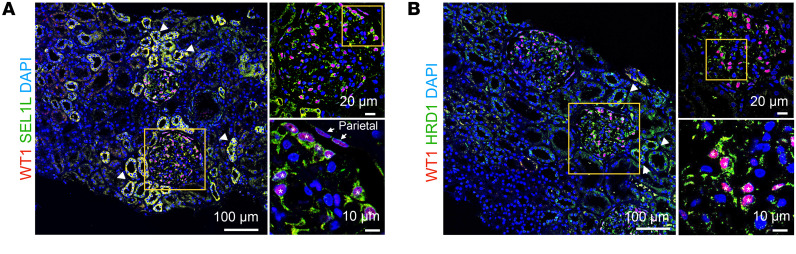
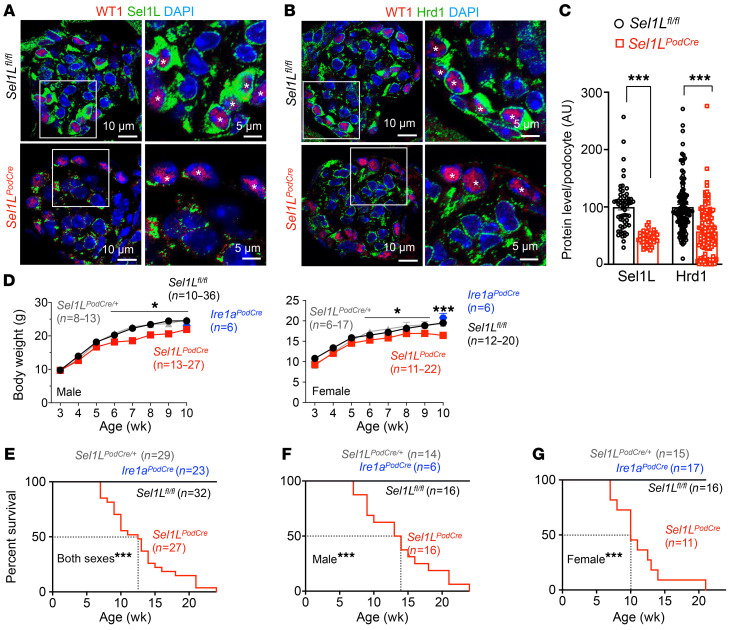
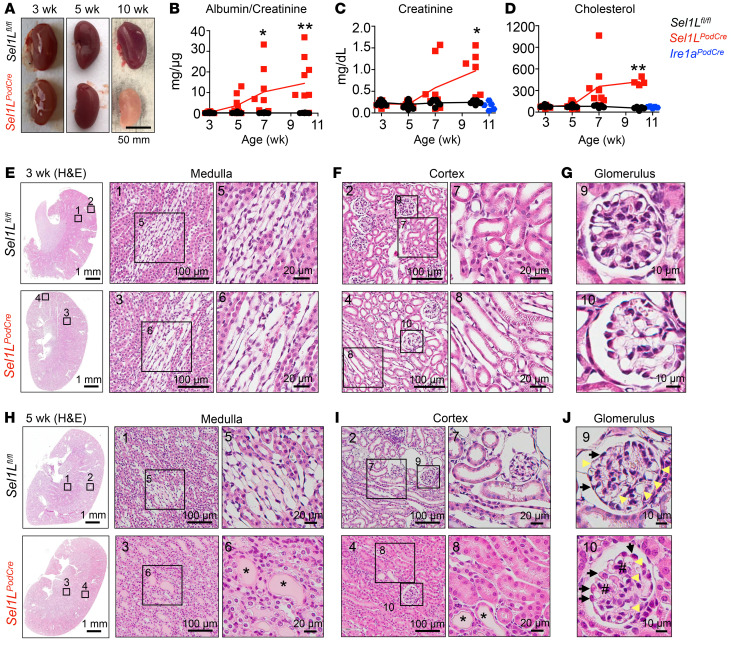
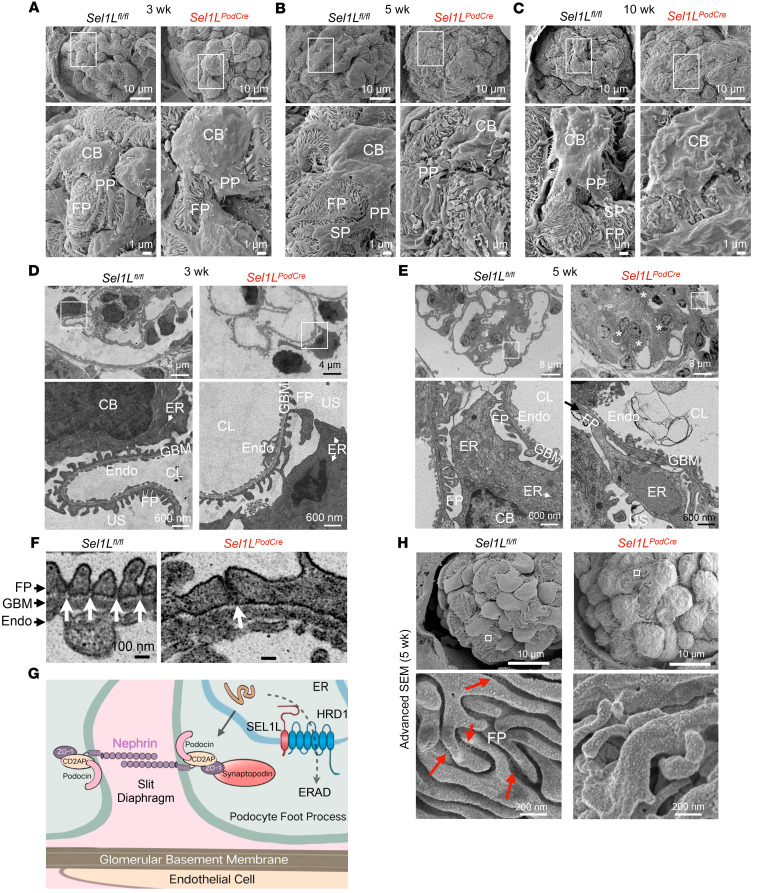
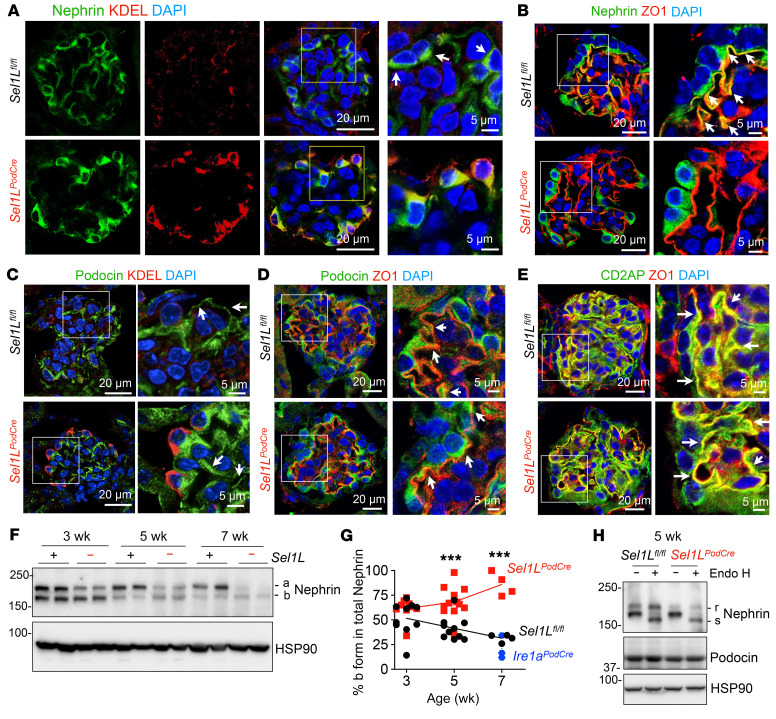
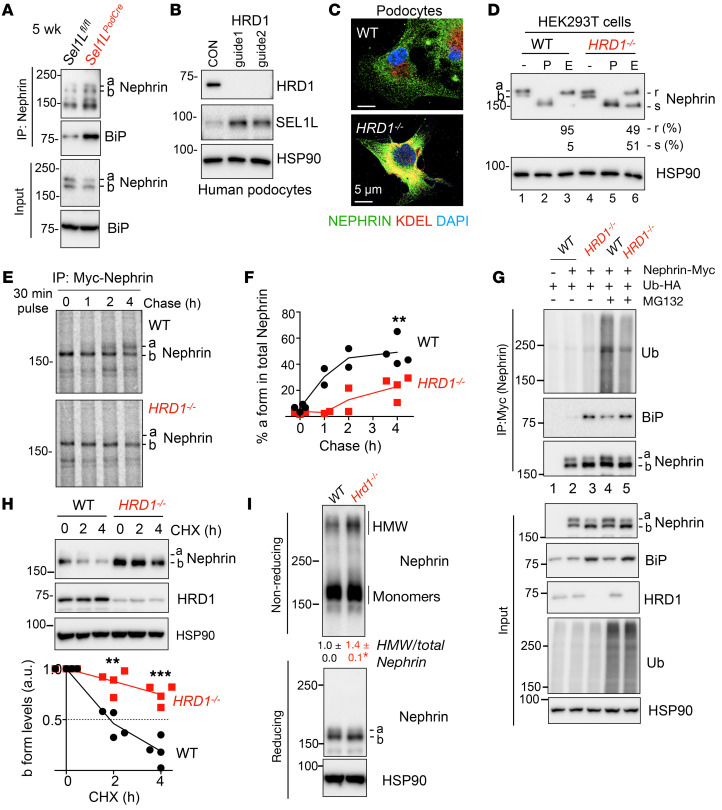
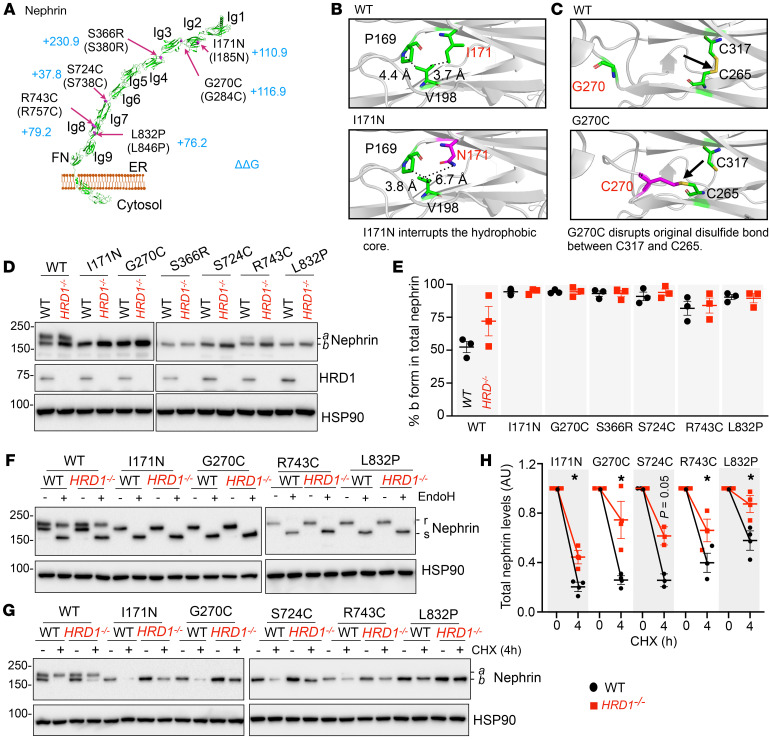
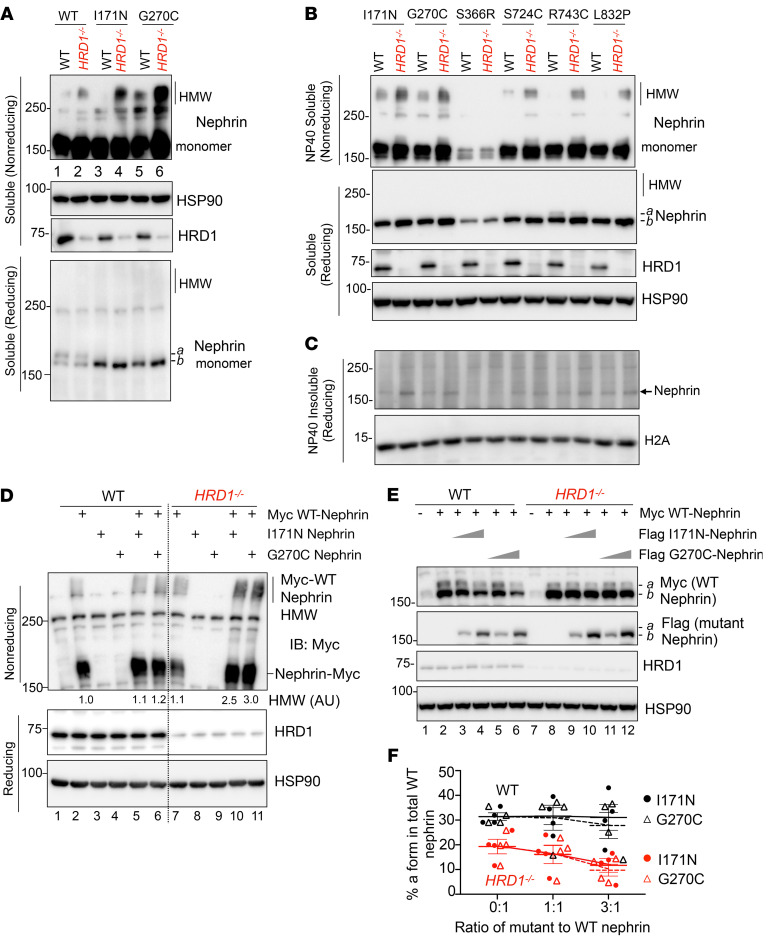
Podocytes are key to the glomerular filtration barrier by forming a slit diaphragm between interdigitating foot processes; however, the molecular details and functional importance of protein folding and degradation in the ER remain unknown. Here, we show that the SEL1L-HRD1 protein complex of ER-associated degradation (ERAD) is required for slit diaphragm formation and glomerular filtration function. SEL1L-HRD1 ERAD is highly expressed in podocytes of both mouse and human kidneys. Mice with podocyte-specific Sel1L deficiency develop podocytopathy and severe congenital nephrotic syndrome with an impaired slit diaphragm shortly after weaning and die prematurely, with a median lifespan of approximately 3 months. We show mechanistically that nephrin, a type 1 membrane protein causally linked to congenital nephrotic syndrome, is an endogenous ERAD substrate. ERAD deficiency attenuated the maturation of nascent nephrin, leading to its retention in the ER. We also show that various autosomal-recessive nephrin disease mutants were highly unstable and broken down by SEL1L-HRD1 ERAD, which attenuated the pathogenicity of the mutants toward the WT allele. This study uncovers a critical role of SEL1L-HRD1 ERAD in glomerular filtration barrier function and provides insights into the pathogenesis associated with autosomal-recessive disease mutants.

Keywords: Cell Biology; Nephrology; Protein misfolding; Protein traffic; Ubiquitin-proteosome system.


Conflict of interest statement

Conflict of interest: The authors have declared that no conflict of interest exists.

Figures

Figure 1
Figure 1. SEL1L-HRD1 ERAD is expressed in human podocytes.
Representative confocal images of SEL1L (A) and HRD1 (B) costaining with WT1 in kidney tissues from healthy humans. Asterisks identify WT1+ podocytes. Arrowheads indicate distal tubular cells also expressing SEL1L and HRD1. In addition to expression in podocytes, WT1 was also expressed in parietal epithelial cells lining the Bowman capsule (arrows). Scale bars: 100 μm, 20 μm, and 10 μm.
Figure 2
Figure 2. Sel1L deficiency in podocytes leads to premature lethality.
(AC) Representative confocal images of SEL1L (A) and HRD1 (B) costaining with WT1 in kidney tissues from 3-week-old Sel1Lfl/fl and Sel1LPodCre mice (n = 3 mice each), with quantitation shown in C (n = 59, 45, 130, and 119 podocytes from left to right). Asterisks in the images indicate WT1+ podocytes. Scale bars: 10 μm and 5 μm (enlarged insets). ***P < 0.001, by 2-tailed Student’s t test. (D) Growth curves of male and female WT Sel1Lfl/fl, heterozygous Sel1LPodCre/+, and knockout Sel1LPodCre mice. Ten-week-old Ire1αPodCre mice were included as a control. *P < 0.05 and ***P < 0.001, by 1-way ANOVA for each age. (EG) Kaplan-Meier survival analysis for combined (E), male (F), and female (G) sexes. ***P < 0.0001, by log-rank test comparing Sel1LPodCre mice with other cohorts. Values represent the mean ± SEM.
Figure 3
Figure 3. Sel1LPodCre mice exhibit early-onset renal failure starting at 5 weeks of age.
(A) Representative images of kidney tissue from 3-, 5-, and 10-week-old Sel1Lfl/fl and Sel1LPodCre mice (n = 6 each). (BD) Ratio of albumin/creatinine in the urine (B) (n = 8 each at 3 weeks; n = 8–9 each at 5 weeks; n = 8 each at 7 weeks; n = 8–9 each at 10 weeks); serum creatinine (C) (n = 10 Sel1Lfl/fl and n = 11 Sel1LPodCre at 3 weeks; n = 11 Sel1Lfl/fl and n = 9 Sel1LPodCre at 5 weeks; n = 6 Sel1Lfl/fl and n = 8 Sel1LPodCre at 7 weeks; n = 6 each at 10 weeks); and cholesterol (D) (n = 10 each at 3 weeks; n = 10 Sel1Lfl/fl and n = 9 Sel1LPodCre at 5 weeks; n = 5 Sel1Lfl/fl and n = 8 Sel1LPodCre at 7 weeks; and n = 5 Sel1Lfl/fl and n = 4 Sel1LPodCre at 10 weeks). Ten-week-old Ire1aPodCre mice were included as a control for C and D (n = 5 and n = 6 Ire1aPodCre mice for C and D, respectively). Values represent the mean ± SEM. *P < 0.05 and **P < 0.01; a 2-tailed Student’s t test and 1-way ANOVA were used for data for 3–7 weeks and 10 weeks, respectively. (EJ) Representative H&E-stained images of kidney sections from 3-week-old (EG) and 5-week-old (HJ) mice (n = 3). Asterisks indicate protein casts, pound signs indicate mesangial cell hyperplasia, black arrows indicate podocytes, and yellow arrowheads indicate the capillary lumen. Scale bars: 50 mm (A); 1 mm, 100 μm, and 20 μm (E, F, H, and I); and 10 μm (G and J).
Figure 4
Figure 4. SEL1L is required for the formation of the slit diaphragm.
(AC) Representative SEM images of glomeruli from 3-week-old mice (A) (n = 9 Sel1Lfl/fl and n = 10 Sel1LPodCre glomeruli); 5-week-old mice (B) (n = 12 Sel1Lfl/fl and n = 16 Sel1LPodCre glomeruli); and 10-week-old mice (C) (n = 9 Sel1Lfl/fl and n = 5 Sel1LPodCre glomeruli). n = 2 mice/genotype. Scale bars: 10 μm and 1 μm (enlarged insets). (D and E) Representative TEM images of glomeruli from 3-week-old mice (D) (n = 3 glomeruli each) and 5-week-old mice (E) (n = 6 glomeruli each). n = 2 mice/genotype. Asterisks indicate mesangial cell hyperplasia; arrows indicate FP fusion. Scale bars: 4 μm (D), 8 μm (E), and 600 nm (enlarged insets in D and E). (F) Representative TEM images of slit diaphragms (white arrows). Scale bar: 100 nm. (G) Diagram illustrating the key proteins involved in the slit diaphragm and ERAD. (H) Representative images of advanced SEM images showing slit diaphragms (red arrows) in 5-week-old mice (n = 7 glomeruli each). n = 2 mice/genotype. Scale bars: 10 μm and 200 nm (enlarged insets). CB, cell body of podocytes; CL, capillary lumen; US, urinary space; Endo, endothelial cells.
Figure 5
Figure 5. SEL1L deficiency affects the maturation of nascent nephrin in the ER.
(AE) Representative confocal images of nephrin-KDEL (A), nephrin-ZO1 (B), podocin-KDEL (C), podocin-ZO1 (D), and CD2AP-ZO1 (E) in kidney sections from 3-week-old mice (n = 3 mice each). Arrows mark the perinuclear localization of nephrin (A), colocalization of nephrin with ZO1 (B), localization of podocin at the slit diaphragm (C), and colocalization of podocin and ZO1 (D) and CD2AP and ZO1 (E). Images with artificially enhanced KDEL signal are shown in Supplemental Figure 6A. (F) Western blot analysis of nephrin in kidney lysates from 3-, 5-, and 7-week-old mice and (G) quantitation of the percentage of b form nephrin in total nephrin. n = 10 mice each at 3 weeks; n = 10 Sel1Lfl/fl and n = 12 Sel1LPodCre at 5 weeks; and n = 4 each at 7 weeks. Seven-week-old Ire1aPodCre mice were included as a control (n = 3), and the original data are shown in Supplemental Figure 7A. Values represent the mean ± SEM. ***P < 0.001, by 2-tailed Student’s t test (3- and 5-week-old mice) and 1-way ANOVA (7-week-old mice). (H) Western blot analysis of nephrin in EndoH-treated kidney lysates from 5-week-old mice, with quantitation shown in Supplemental Figure 6D (n = 5 mice/group). r, EndoH-resistant form; s, EndoH-sensitive form.
Figure 6
Figure 6. Nephrin is an endogenous substrate of ERAD, and in the absence of ERAD, nephrin is retained in the ER and associated with BiP.
(A) Western blot analysis following nephrin immunoprecipitation in kidney tissues from 5-week-old mice, showing the interaction between nephrin and BiP in the absence of ERAD. (B) Western blot analysis following HRD1 deletion in the HRD1–/– human podocyte line. CON, control. (C) Representative confocal images of nephrin and KDEL staining in human podocytes (n = 5 WT and n = 6 HRD1–/– cells). Scale bars: 5 μm. (D) Western blot analysis of nephrin in transfected WT and HRD1–/– HEK293T cells, digested with or without PNGase F (P) or EndoH (E), with quantitation of the percentage of EndoH-resistant and EndoH-sensitive forms shown below. (E) 35S pulse (30-min) chase (0, 1, 2, and 4 hours) analysis of nascent nephrin protein in HEK293T cells, and (F) quantitation of the percentage of a form nephrin in total nephrin. (G) Western blot analysis of Myc immunoprecipitates in transfected HEK293T cells, treated or not with 10 μM MG132 for 5 hours prior to harvesting, showing ERAD-mediated ubiquitination of nephrin. (H) Western blot analysis of nephrin protein decay in transfected HEK293T cells treated with brefeldin A and/or CHX for the indicated durations, with quantitation from 4 independent experiments shown below. (I) Western blot analysis of nephrin in transfected WT and Hrd1–/– N2a cells under nonreducing or reducing conditions, with the level of HMW nephrin normalized to total nephrin from 3 independent experiments shown below the blot. Data are representative of at least 3 independent experiments. Values represent the mean ± SEM. *P < 0.05, **P < 0.01, and ***P < 0.001, by 2-tailed Student’s t test.
Figure 7
Figure 7. Nephrin disease mutants are unstable, retained in the ER, and targeted for proteasomal degradation by ERAD.
(A) Structural modeling of human nephrin showing the domains (Ig and FN) and location of 6 pathogenic mutations. EvoEF2 (ΔΔG) for each mutant is indicated in blue. (B and C) The predicted local structures of WT, I171N (B), and G270C (C). WT and mutated residues are shown in green and magenta, respectively. Distances between the indicated residues are shown. Arrows indicate disulfide bonds. (D and E) Western blot analysis of WT and mutant nephrin proteins in transfected HEK293T cells, showing nephrin mutants running as the b form on SDS-PAGE. Quantitation is shown in E. (F) Western blot analysis following EndoH digestion in HEK293T cells transfected with WT or mutant nephrin. (G and H) Western blot analysis of WT and mutant nephrin in transfected HEK293T cells treated with CHX for 4 hours, with quantitation shown in H. Values represent the mean ± SEM. Data are representative of at least 2 independent experiments. *P < 0.05, by 2-tailed Student’s t test.
Figure 8
Figure 8. ERAD of disease mutants attenuates their pathogenicity toward the WT allele.
(A) Western blot analysis of WT and mutant HMW and monomeric nephrin in transfected WT and HRD1–/– HEK293T cells under nonreducing and reducing conditions. (B and C) Western blot analysis of NP40-soluble (B) and NP40-insoluble fractions (C) in transfected WT and HRD1–/– HEK293T cells, showing increased formation of HMW and insoluble nephrin aggregates in HRD1–/– HEK293T cells for both WT and mutant nephrin. (D) Western blot analysis of nephrin HMW aggregation in HEK293T cells transfected with different combinations of Myc-WT nephrin and nephrin mutants under nonreducing conditions, with the level of HMW nephrin from 1 representative experiment shown below the blot. (E and F) Western blot analysis of Myc-WT and Flag-mutant nephrin in HEK293T cells transfected with different combinations of Myc-WT nephrin and Flag-tagged mutant nephrin at a 1:1 or 1:3 ratio. Quantitation of the percentage of a form WT nephrin in total WT nephrin is shown in F, indicating a decrease in the percentage of a form WT nephrin in HRD1–/– HEK293T cells (upon cotransfection of an increased amount of mutant nephrin) when compared with that in WT HEK293T cells. Values represent the mean ± SEM. Data are representative of at least 2 independent experiments.

Similar articles

Cited by

References

    1. Garg P. A review of podocyte biology. Am J Nephrol. 2018;47(suppl 1):3–13. - PubMed
    1. Shih NY, et al. Congenital nephrotic syndrome in mice lacking CD2-associated protein. Science. 1999;286(5438):312–315. doi: 10.1126/science.286.5438.312. - DOI - PubMed
    1. Kestila M, et al. Positionally cloned gene for a novel glomerular protein—nephrin—is mutated in congenital nephrotic syndrome. Mol Cell. 1998;1(4):575–582. doi: 10.1016/S1097-2765(00)80057-X. - DOI - PubMed
    1. Boute N, et al. NPHS2, encoding the glomerular protein podocin, is mutated in autosomal recessive steroid-resistant nephrotic syndrome. Nat Genet. 2000;24(4):349–354. doi: 10.1038/74166. - DOI - PubMed
    1. Mollet G, et al. Podocin inactivation in mature kidneys causes focal segmental glomerulosclerosis and nephrotic syndrome. J Am Soc Nephrol. 2009;20(10):2181–2189. doi: 10.1681/ASN.2009040379. - DOI - PMC - PubMed

Publication types

MeSH terms

Supplementary concepts