

PI Prob: A risk prediction and clinical guidance system for evaluating patients with recurrent infections
- PMID: 33591972
- PMCID: PMC7886140
- DOI: 10.1371/journal.pone.0237285
PI Prob: A risk prediction and clinical guidance system for evaluating patients with recurrent infections
Abstract
Background: Primary immunodeficiency diseases represent an expanding set of heterogeneous conditions which are difficult to recognize clinically. Diagnostic rates outside of the newborn period have not changed appreciably. This concern underscores a need for novel methods of disease detection.
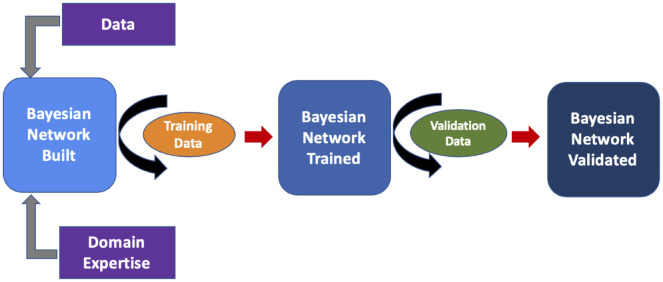
Objective: We built a Bayesian network to provide real-time risk assessment about primary immunodeficiency and to facilitate prescriptive analytics for initiating the most appropriate diagnostic work up. Our goal is to improve diagnostic rates for primary immunodeficiency and shorten time to diagnosis. We aimed to use readily available health record data and a small training dataset to prove utility in diagnosing patients with relatively rare features.
Methods: We extracted data from the Texas Children's Hospital electronic health record on a large population of primary immunodeficiency patients (n = 1762) and appropriately-matched set of controls (n = 1698). From the cohorts, clinically relevant prior probabilities were calculated enabling construction of a Bayesian network probabilistic model(PI Prob). Our model was constructed with clinical-immunology domain expertise, trained on a balanced cohort of 100 cases-controls and validated on an unseen balanced cohort of 150 cases-controls. Performance was measured by area under the receiver operator characteristic curve (AUROC). We also compared our network performance to classic machine learning model performance on the same dataset.
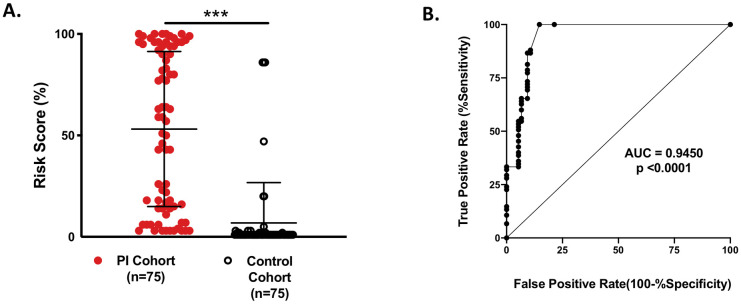
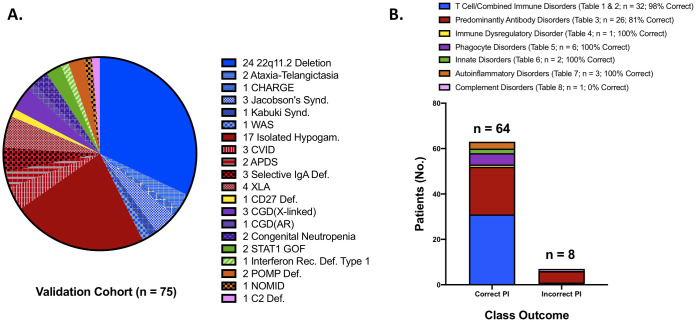
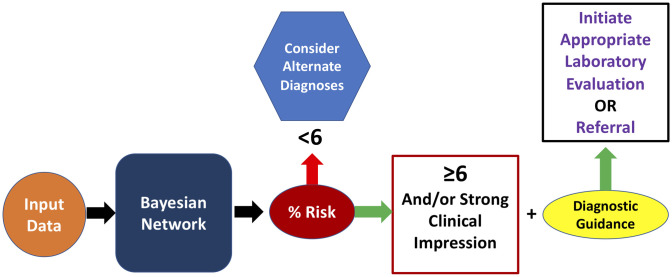
Results: PI Prob was accurate in classifying immunodeficiency patients from controls (AUROC = 0.945; p<0.0001) at a risk threshold of ≥6%. Additionally, the model was 89% accurate for categorizing validation cohort members into appropriate International Union of Immunological Societies diagnostic categories. Our network outperformed 3 other machine learning models and provides superior transparency with a prescriptive output element.
Conclusion: Artificial intelligence methods can classify risk for primary immunodeficiency and guide management. PI Prob enables accurate, objective decision making about risk and guides the user towards the appropriate diagnostic evaluation for patients with recurrent infections. Probabilistic models can be trained with small datasets underscoring their utility for rare disease detection given appropriate domain expertise for feature selection and network construction.
Conflict of interest statement
GC, TM, LW, AK, LMN, FOS, IKC and KR have nothing to disclose. NLR received consulting fees for scientific advisory activities with Takeda Pharmaceuticals, Horizon Therapeutics and CSL Behring. He also receives royalties from Wolters Kluwer for topic contribution to UpToDate. This does not alter our adherence to PLOS ONE policies on sharing data and materials.
Figures

References
-
- Odnoletkova I, Kindle G, Quinti I, Grimbacher B, Knerr V, Gathmann B, et al. The burden of common variable immunodeficiency disorders: a retrospective analysis of the European Society for Immunodeficiency (ESID) registry data. Orphanet J Rare Dis. 2018;13(1):201 10.1186/s13023-018-0941-0 - DOI - PMC - PubMed
Publication types
MeSH terms
LinkOut - more resources
Full Text Sources
Other Literature Sources
Research Materials
Miscellaneous
