

Evolutionary history of Carnivora (Mammalia, Laurasiatheria) inferred from mitochondrial genomes
- PMID: 33591975
- PMCID: PMC7886153
- DOI: 10.1371/journal.pone.0240770
Evolutionary history of Carnivora (Mammalia, Laurasiatheria) inferred from mitochondrial genomes
Erratum in
-
Correction: Evolutionary history of Carnivora (Mammalia, Laurasiatheria) inferred from mitochondrial genomes.PLoS One. 2021 Mar 29;16(3):e0249387. doi: 10.1371/journal.pone.0249387. eCollection 2021. PLoS One. 2021. PMID: 33780516 Free PMC article.
Abstract
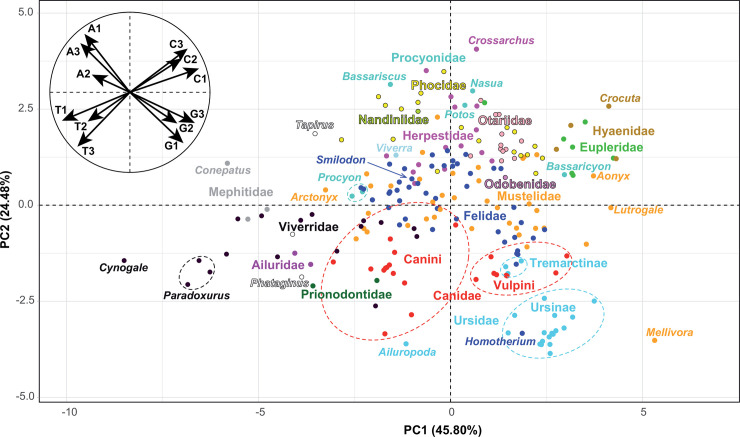
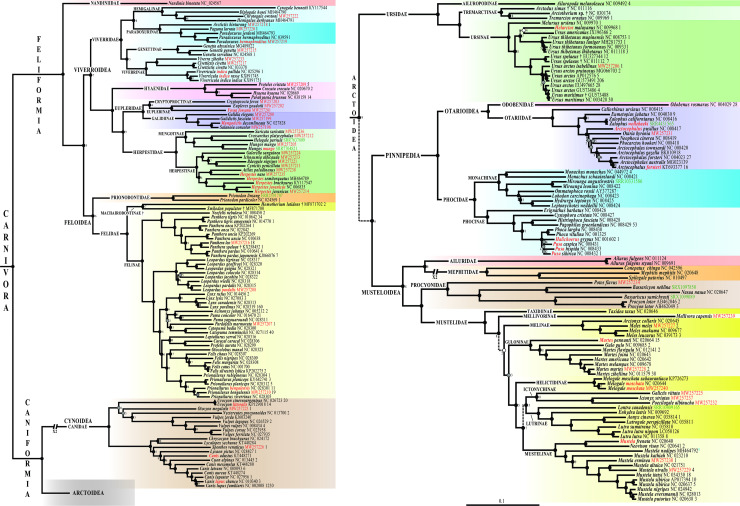
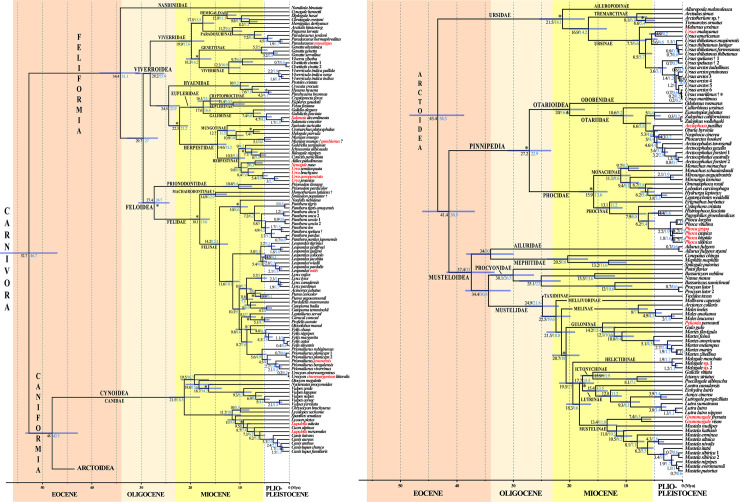
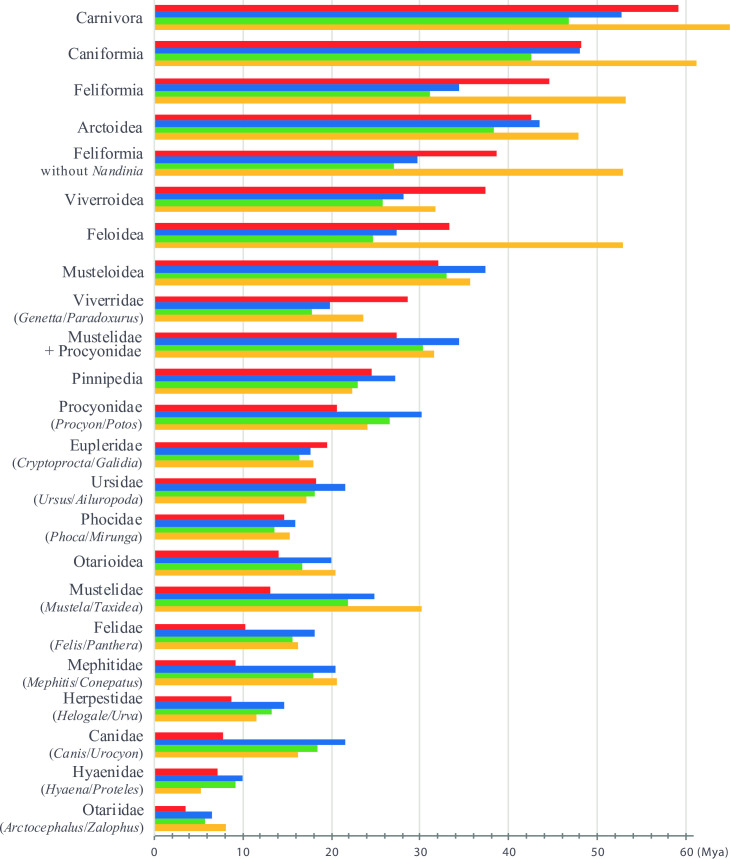
The order Carnivora, which currently includes 296 species classified into 16 families, is distributed across all continents. The phylogeny and the timing of diversification of members of the order are still a matter of debate. Here, complete mitochondrial genomes were analysed to reconstruct the phylogenetic relationships and to estimate divergence times among species of Carnivora. We assembled 51 new mitogenomes from 13 families, and aligned them with available mitogenomes by selecting only those showing more than 1% of nucleotide divergence and excluding those suspected to be of low-quality or from misidentified taxa. Our final alignment included 220 taxa representing 2,442 mitogenomes. Our analyses led to a robust resolution of suprafamilial and intrafamilial relationships. We identified 21 fossil calibration points to estimate a molecular timescale for carnivorans. According to our divergence time estimates, crown carnivorans appeared during or just after the Early Eocene Climatic Optimum; all major groups of Caniformia (Cynoidea/Arctoidea; Ursidae; Musteloidea/Pinnipedia) diverged from each other during the Eocene, while all major groups of Feliformia (Nandiniidae; Feloidea; Viverroidea) diversified more recently during the Oligocene, with a basal divergence of Nandinia at the Eocene/Oligocene transition; intrafamilial divergences occurred during the Miocene, except for the Procyonidae, as Potos separated from other genera during the Oligocene.
Conflict of interest statement
The authors have declared that no competing interests exist.
Figures
Similar articles
-
Mitogenomic analyses of caniform relationships.Mol Phylogenet Evol. 2007 Dec;45(3):863-74. doi: 10.1016/j.ympev.2007.06.019. Epub 2007 Jul 12. Mol Phylogenet Evol. 2007. PMID: 17919938
-
Molecular phylogeny of the carnivora (mammalia): assessing the impact of increased sampling on resolving enigmatic relationships.Syst Biol. 2005 Apr;54(2):317-37. doi: 10.1080/10635150590923326. Syst Biol. 2005. PMID: 16012099
-
Pattern and timing of diversification of Cetartiodactyla (Mammalia, Laurasiatheria), as revealed by a comprehensive analysis of mitochondrial genomes.C R Biol. 2012 Jan;335(1):32-50. doi: 10.1016/j.crvi.2011.11.002. Epub 2011 Dec 28. C R Biol. 2012. PMID: 22226162
-
Comparative chromosome painting in Carnivora and Pholidota.Cytogenet Genome Res. 2012;137(2-4):174-93. doi: 10.1159/000341389. Epub 2012 Aug 7. Cytogenet Genome Res. 2012. PMID: 22889959 Review.
-
Catarrhine primate divergence dates estimated from complete mitochondrial genomes: concordance with fossil and nuclear DNA evidence.J Hum Evol. 2005 Mar;48(3):237-57. doi: 10.1016/j.jhevol.2004.11.007. Epub 2005 Jan 20. J Hum Evol. 2005. PMID: 15737392 Review.
Cited by
-
Morphological examination of the visual system and orbital region in the red panda (Ailurus fulgens fulgens).BMC Vet Res. 2024 Jul 2;20(1):284. doi: 10.1186/s12917-024-04152-2. BMC Vet Res. 2024. PMID: 38956555 Free PMC article.
-
Geologically calibrated mammalian tree and its correlation with global events, including the emergence of humans.Ecol Evol. 2023 Dec 19;13(12):e10827. doi: 10.1002/ece3.10827. eCollection 2023 Dec. Ecol Evol. 2023. PMID: 38116126 Free PMC article.
-
Chromosome-length genome assembly and karyotype of the endangered black-footed ferret (Mustela nigripes).J Hered. 2023 Aug 23;114(5):539-548. doi: 10.1093/jhered/esad035. J Hered. 2023. PMID: 37249392 Free PMC article.
-
Correction: Evolutionary history of Carnivora (Mammalia, Laurasiatheria) inferred from mitochondrial genomes.PLoS One. 2021 Mar 29;16(3):e0249387. doi: 10.1371/journal.pone.0249387. eCollection 2021. PLoS One. 2021. PMID: 33780516 Free PMC article.
-
Complete mitochondrial genome of the Galápagos sea lion, Zalophuswollebaeki (Carnivora, Otariidae): paratype specimen confirms separate species status.Zookeys. 2023 Jun 13;1166:307-313. doi: 10.3897/zookeys.1166.103247. eCollection 2023. Zookeys. 2023. PMID: 38328668 Free PMC article.
References
-
- The IUCN Red List of Threatened Species. Version 2020–1. https://www.iucnredlist.org. Downloaded on 19 March 2020.
-
- Spaulding M., Flynn JJ. Phylogeny of the Carnivoramorpha: the impact of postcranial characters. J Vertebr Paleontol. 2012; 10: 653–677. 10.1080/14772019.2011.630681 - DOI
-
- Solé F, Smith R, Coillot T, de Bast E, Smith T. Dental and tarsal anatomy of ‘Miacis’ latouri and a phylogenetic analysis of the earliest carnivoraforms (Mammalia, Carnivoramorpha). J Vertebr Paleontol. 2014; 34: 1–21. 10.1080/02724634.2013.793195 - DOI
-
- Solé F, Smith T, de Bast E, Codrea V, Gheerbrant E. New Carnivoraforms from the latest Paleocene of Europe and their bearing on the origin and radiation of Carnivoraformes (Carnivoramorpha, Mammalia). J Vertebr Paleontol. 2016; 36: e1082480 10.1080/02724634.2016.1082480 - DOI
-
- Flynn JJ, Finarelli JA, Spaulding M. Phylogeny of the Carnivora and Carnivoramorpha, and the use of the fossil record to enhance understanding of evolutionary transformations; In Goswami A, Friscia A, editors. Carnivoran evolution: new views on phylogeny, form, and function Cambridge UK: Cambridge University Press; 2010. pp. 25–63.
Publication types
MeSH terms
Substances
LinkOut - more resources
Full Text Sources
Other Literature Sources
