

Relationships between fox populations and rabies virus spread in northern Canada
- PMID: 33592018
- PMCID: PMC7886166
- DOI: 10.1371/journal.pone.0246508
Relationships between fox populations and rabies virus spread in northern Canada
Abstract
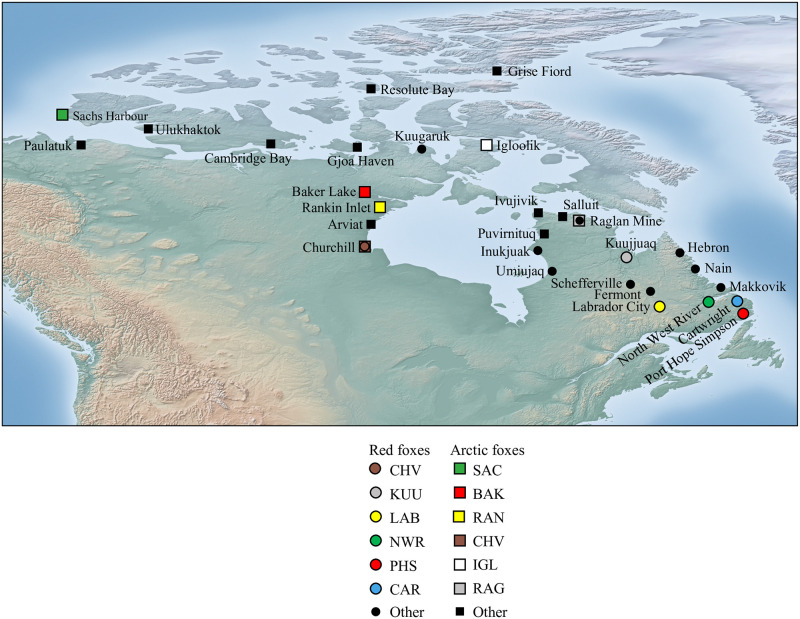
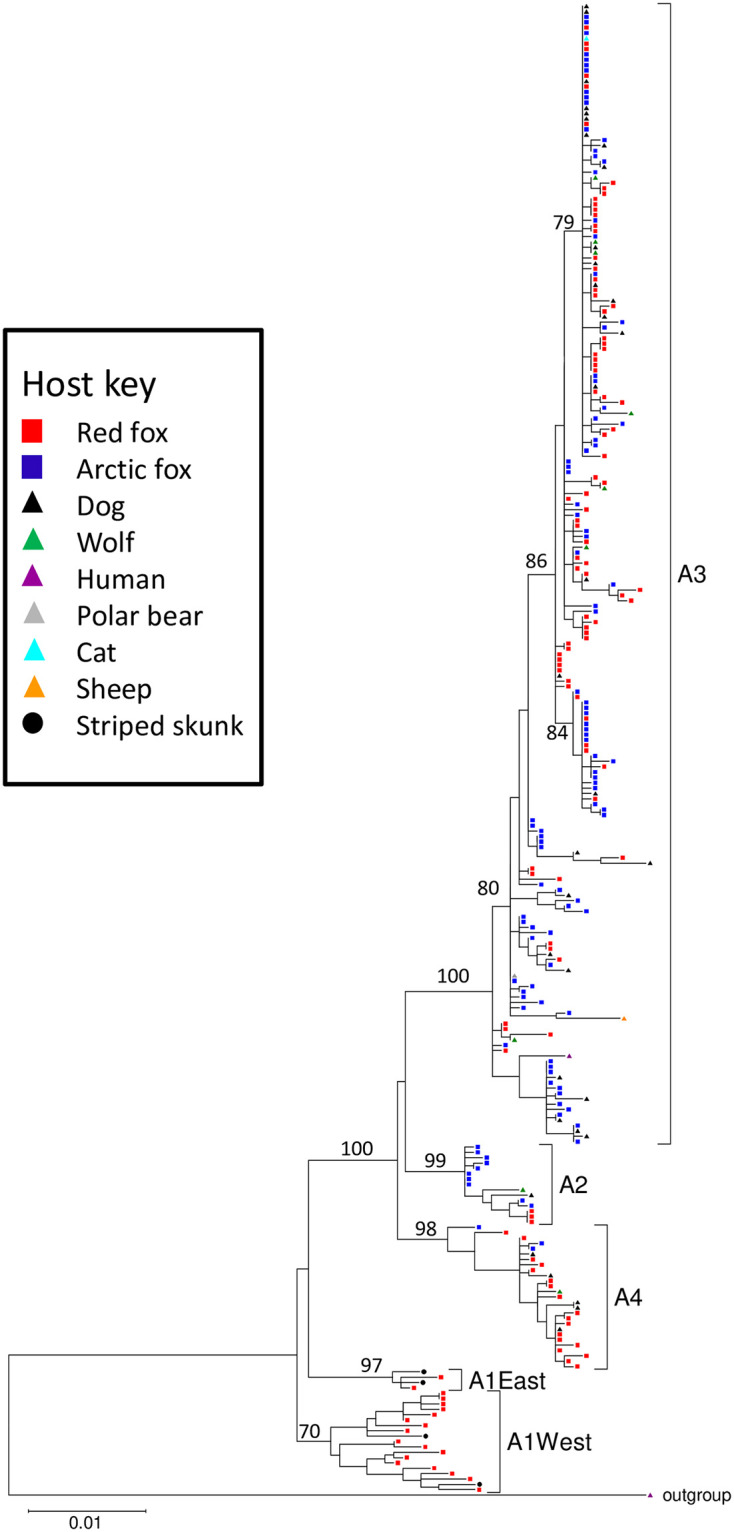
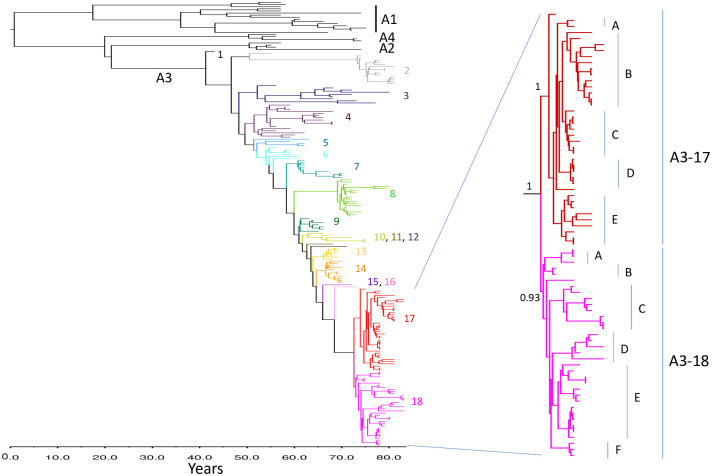
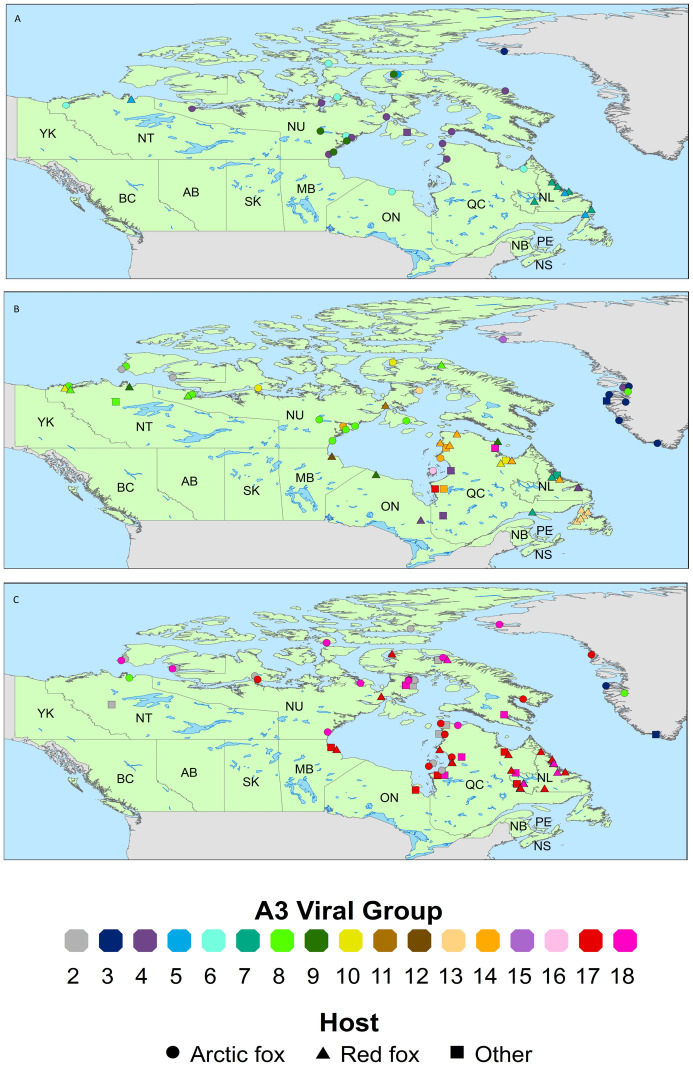
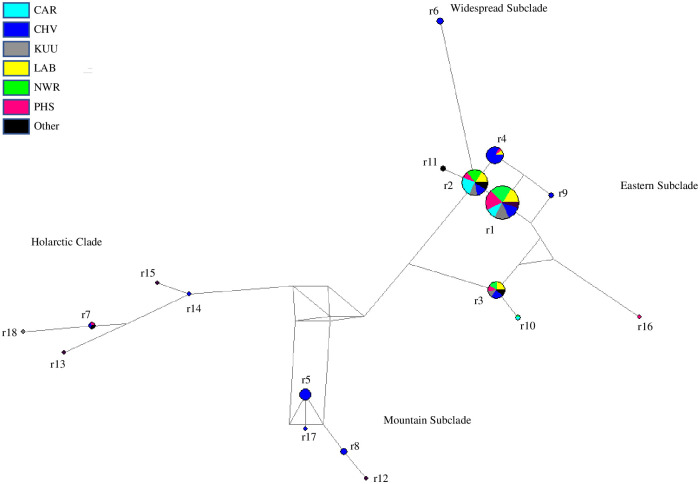
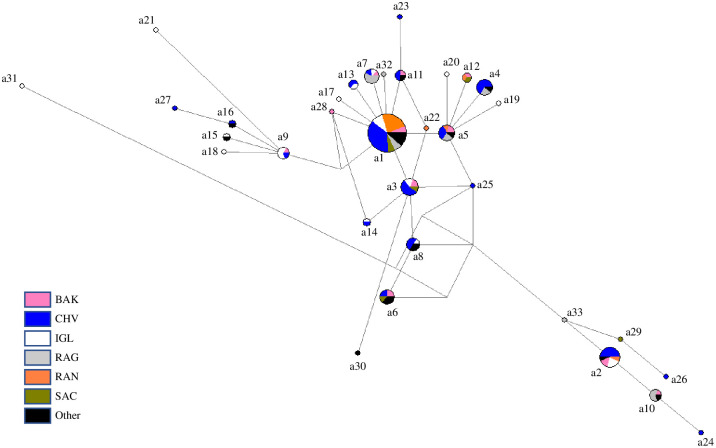
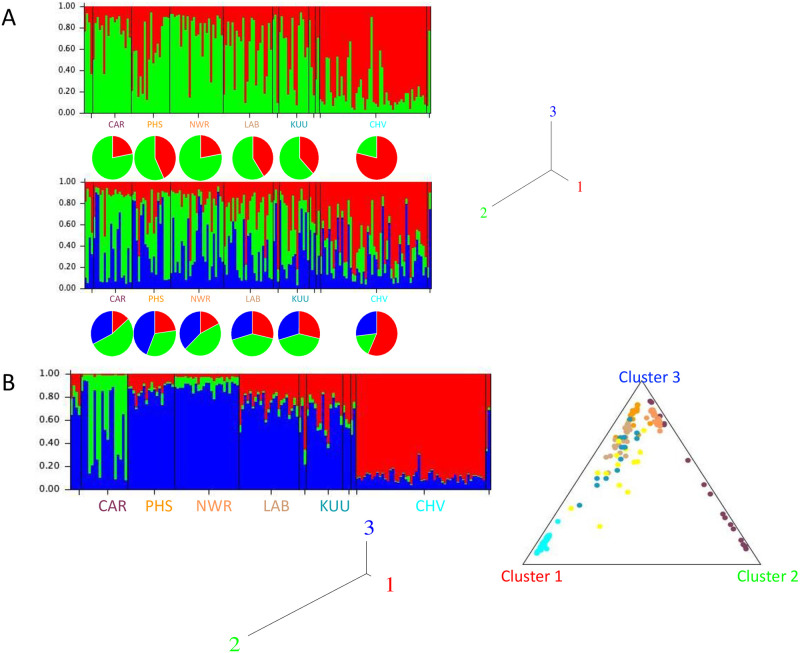
Rabies spreads in both Arctic (Vulpes lagopus) and red foxes (Vulpes vulpes) throughout the Canadian Arctic but limited wildlife disease surveillance, due to the extensive landmass of the Canadian north and its small widely scattered human population, undermines our knowledge of disease transmission patterns. This study has explored genetic population structure in both the rabies virus and its fox hosts to better understand factors that impact rabies spread. Phylogenetic analysis of 278 samples of the Arctic lineage of rabies virus recovered over 40 years identified four sub-lineages, A1 to A4. The A1 lineage has been restricted to southern regions of the Canadian province of Ontario. The A2 lineage, which predominates in Siberia, has also spread to northern Alaska while the A4 lineage was recovered from southern Alaska only. The A3 sub-lineage, which was also found in northern Alaska, has been responsible for virtually all cases across northern Canada and Greenland, where it further differentiated into 18 groups which have systematically evolved from a common predecessor since 1975. In areas of Arctic and red fox sympatry, viral groups appear to circulate in both hosts, but both mitochondrial DNA control region sequences and 9-locus microsatellite genotypes revealed contrasting phylogeographic patterns for the two fox species. Among 157 Arctic foxes, 33 mitochondrial control region haplotypes were identified but little genetic structure differentiating localities was detected. Among 162 red foxes, 18 control region haplotypes delineated three groups which discriminated among the Churchill region of Manitoba, northern Quebec and Labrador populations, and the coastal Labrador locality of Cartwright. Microsatellite analyses demonstrated some genetic heterogeneity among sampling localities of Arctic foxes but no obvious pattern, while two or three clusters of red foxes suggested some admixture between the Churchill and Quebec-Labrador regions but uniqueness of the Cartwright group. The limited population structure of Arctic foxes is consistent with the rapid spread of rabies virus subtypes throughout the north, while red fox population substructure suggests that disease spread in this host moves most readily down certain independent corridors such as the northeastern coast of Canada and the central interior. Interestingly the evidence suggests that these red fox populations have limited capacity to maintain the virus over the long term, but they may contribute to viral persistence in areas of red and Arctic fox sympatry.
Conflict of interest statement
The authors have declared that no competing interests exist.
Figures
Similar articles
-
Low levels of genetic differentiation and structure in red fox populations in Eastern Canada and implications for Arctic fox rabies propagation potential.PLoS One. 2023 Jun 6;18(6):e0286784. doi: 10.1371/journal.pone.0286784. eCollection 2023. PLoS One. 2023. PMID: 37279210 Free PMC article.
-
Population structure of two rabies hosts relative to the known distribution of rabies virus variants in Alaska.Mol Ecol. 2016 Feb;25(3):675-88. doi: 10.1111/mec.13509. Epub 2016 Jan 19. Mol Ecol. 2016. PMID: 26661691 Free PMC article.
-
The role of a mechanistic host in maintaining arctic rabies variant distributions: Assessment of functional genetic diversity in Alaskan red fox (Vulpes vulpes).PLoS One. 2021 Apr 8;16(4):e0249176. doi: 10.1371/journal.pone.0249176. eCollection 2021. PLoS One. 2021. PMID: 33831031 Free PMC article.
-
Arctic rabies--a review.Acta Vet Scand. 2004;45(1-2):1-9. doi: 10.1186/1751-0147-45-1. Acta Vet Scand. 2004. PMID: 15535081 Free PMC article. Review.
-
Rabies and the Arctic Fox (Vulpes lagopus): A Review.J Wildl Dis. 2024 Jul 1;60(3):572-583. doi: 10.7589/JWD-D-23-00113. J Wildl Dis. 2024. PMID: 38742383 Review.
Cited by
-
Ampliseq for Illumina Technology Enables Detailed Molecular Epidemiology of Rabies Lyssaviruses from Infected Formalin-Fixed Paraffin-Embedded Tissues.Viruses. 2022 Oct 12;14(10):2241. doi: 10.3390/v14102241. Viruses. 2022. PMID: 36298796 Free PMC article.
-
Understanding the distribution and fine-scale habitat selection of mesocarnivores along a habitat quality gradient in western Himalaya.PeerJ. 2022 Sep 16;10:e13993. doi: 10.7717/peerj.13993. eCollection 2022. PeerJ. 2022. PMID: 36132214 Free PMC article.
-
Low levels of genetic differentiation and structure in red fox populations in Eastern Canada and implications for Arctic fox rabies propagation potential.PLoS One. 2023 Jun 6;18(6):e0286784. doi: 10.1371/journal.pone.0286784. eCollection 2023. PLoS One. 2023. PMID: 37279210 Free PMC article.
-
Long-term satellite tracking reveals patterns of long-distance dispersal in juvenile and adult Arctic foxes (Vulpes lagopus).R Soc Open Sci. 2023 Feb 1;10(2):220729. doi: 10.1098/rsos.220729. eCollection 2023 Feb. R Soc Open Sci. 2023. PMID: 36756054 Free PMC article.
-
Evaluating the Impact of Anthropogenic Factors on the Dissemination of Contemporary Cosmopolitan, Arctic, and Arctic-like Rabies Viruses.Viruses. 2021 Dec 30;14(1):66. doi: 10.3390/v14010066. Viruses. 2021. PMID: 35062270 Free PMC article.
References
-
- Wunner WH, Conzelmann K-K. Rabies virus In: Jackson AC, editor. Rabies. third ed Oxford, UK: Academic Press; 2013. p. 17–60.
-
- Jackson AC, Fu ZF. Pathogenesis In: Jackson AC, editor. Rabies: Scientific basis of the disease and its management. Third ed Oxford, UK: Elsevier; 2013. p. 299–349.
Publication types
MeSH terms
Substances
LinkOut - more resources
Full Text Sources
Other Literature Sources
