

The prognostic value of comorbidity for the severity of COVID-19: A systematic review and meta-analysis study
- PMID: 33592019
- PMCID: PMC7886178
- DOI: 10.1371/journal.pone.0246190
The prognostic value of comorbidity for the severity of COVID-19: A systematic review and meta-analysis study
Abstract
Background and objectives: With the increase in the number of COVID-19 infections, the global health apparatus is facing insufficient resources. The main objective of the current study is to provide additional data regarding the clinical characteristics of the patients diagnosed with COVID-19, and in particular to analyze the factors associated with disease severity, lack of improvement, and mortality.
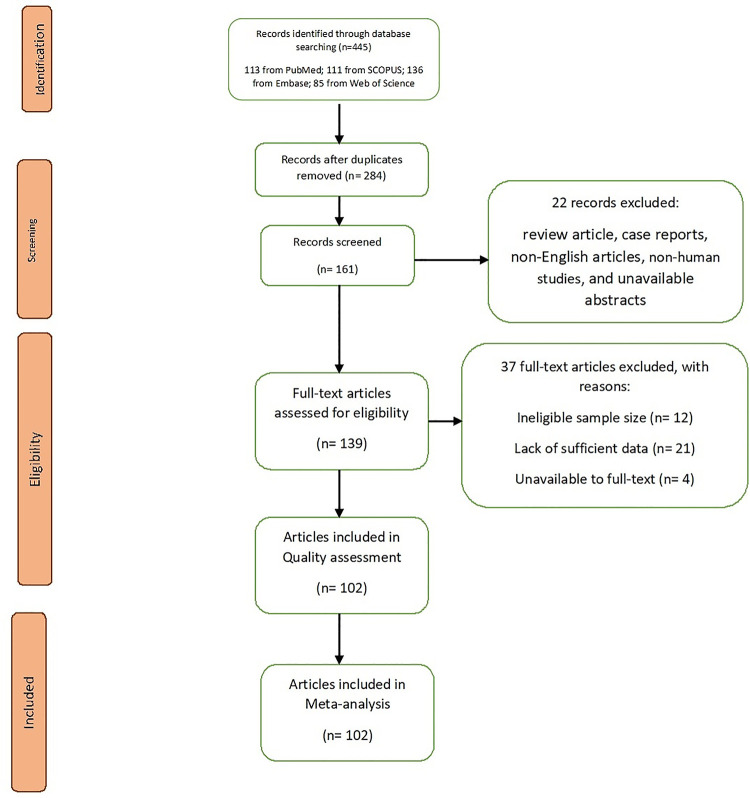
Methods: 102 studies were included in the present meta-analysis, all of which were published before September 24, 2020. The studies were found by searching a number of databases, including Scopus, MEDLINE, Web of Science, and Embase. We performed a thorough search from early February until September 24. The selected papers were evaluated and analyzed using Stata software application version 14.
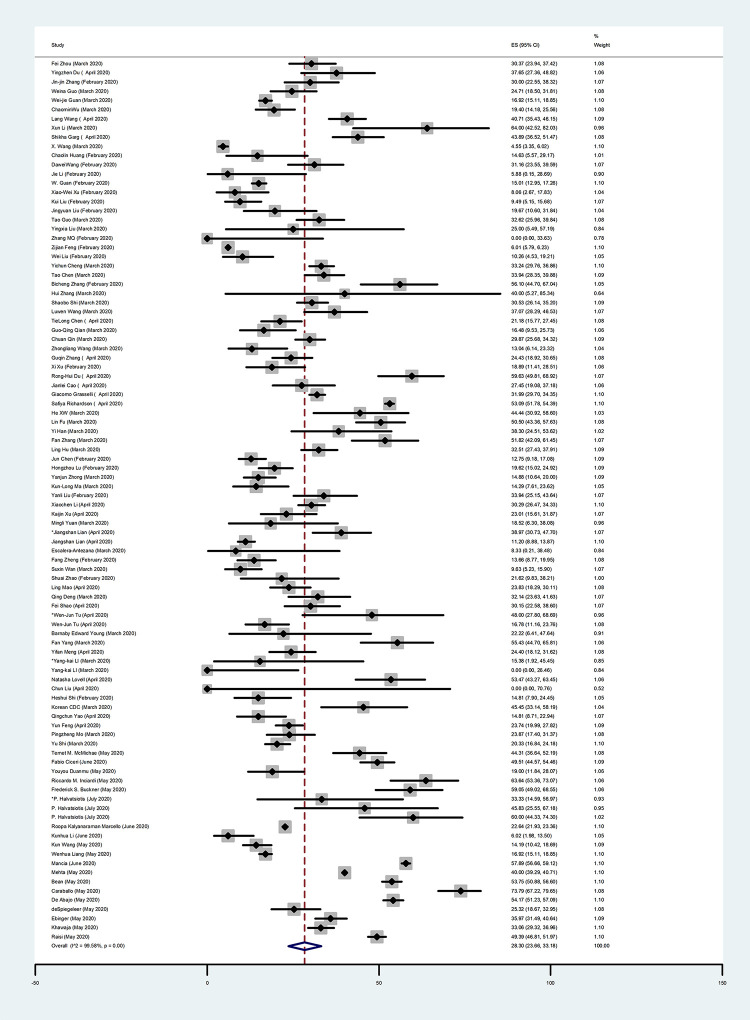
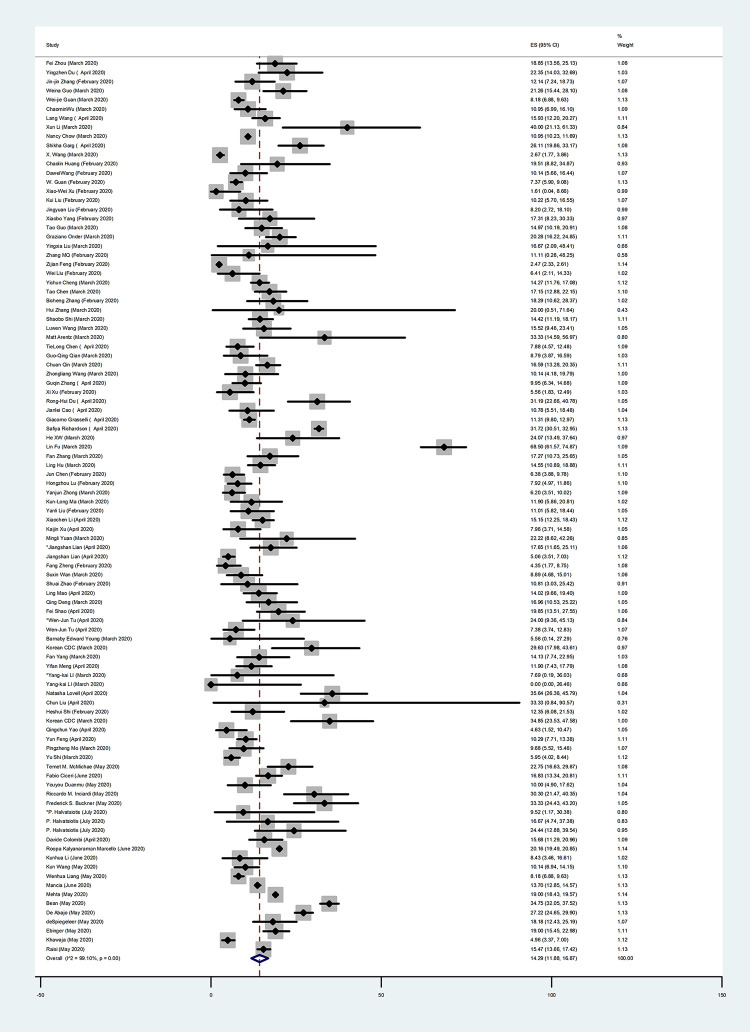
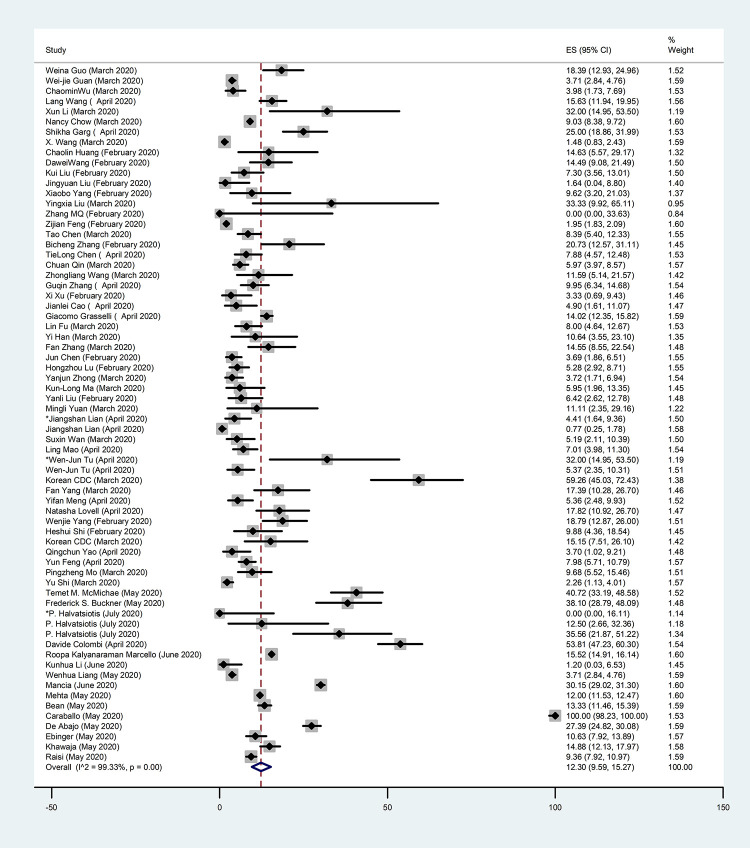
Results: Ultimately, 102 papers were selected for this meta- analysis, covering 121,437 infected patients. The mean age of the patients was 58.42 years. The results indicate a prevalence of 79.26% for fever (95% CI: 74.98-83.26; I2 = 97.35%), 60.70% for cough (95% CI: 56.91-64.43; I2 = 94.98%), 33.21% for fatigue or myalgia (95% CI: 28.86-37.70; I2 = 96.12%), 31.30% for dyspnea (95% CI: 26.14-36.69; I2 = 97.67%), and 10.65% for diarrhea (95% CI: 8.26-13.27; I2 = 94.20%). The prevalence for the most common comorbidities was 28.30% for hypertension (95% CI: 23.66-33.18; I2 = 99.58%), 14.29% for diabetes (95% CI: 11.88-16.87; I2 = 99.10%), 12.30% for cardiovascular diseases (95% CI: 9.59-15.27; I2 = 99.33%), and 5.19% for chronic kidney disease (95% CI: 3.95-6.58; I2 = 96.42%).
Conclusions: We evaluated the prevalence of some of the most important comorbidities in COVID-19 patients, indicating that some underlying disorders, including hypertension, diabetes, cardiovascular diseases, and chronic kidney disease, can be considered as risk factors for patients with COVID-19 infection. Furthermore, the results show that an elderly male with underlying diseases is more likely to have severe COVID-19.
Conflict of interest statement
The authors have declared that no competing interests exist.
Figures
References
-
- Organization W.H., WHO announces COVID-19 outbreak a pandemic. WHO, Geneva, Switzerland, 2020.
Publication types
MeSH terms
LinkOut - more resources
Full Text Sources
Other Literature Sources
Medical
