

Angiotensin-converting enzyme 2 (ACE2) expression increases with age in patients requiring mechanical ventilation
- PMID: 33592054
- PMCID: PMC7886150
- DOI: 10.1371/journal.pone.0247060
Angiotensin-converting enzyme 2 (ACE2) expression increases with age in patients requiring mechanical ventilation
Abstract
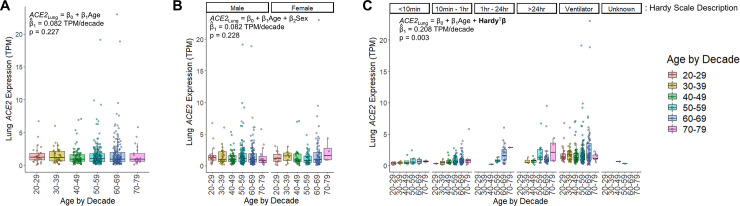
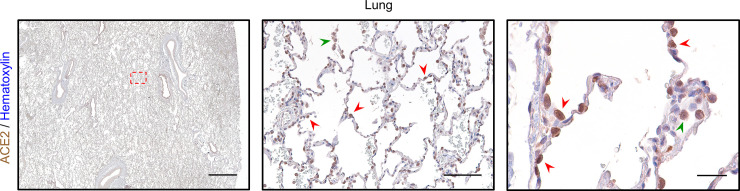
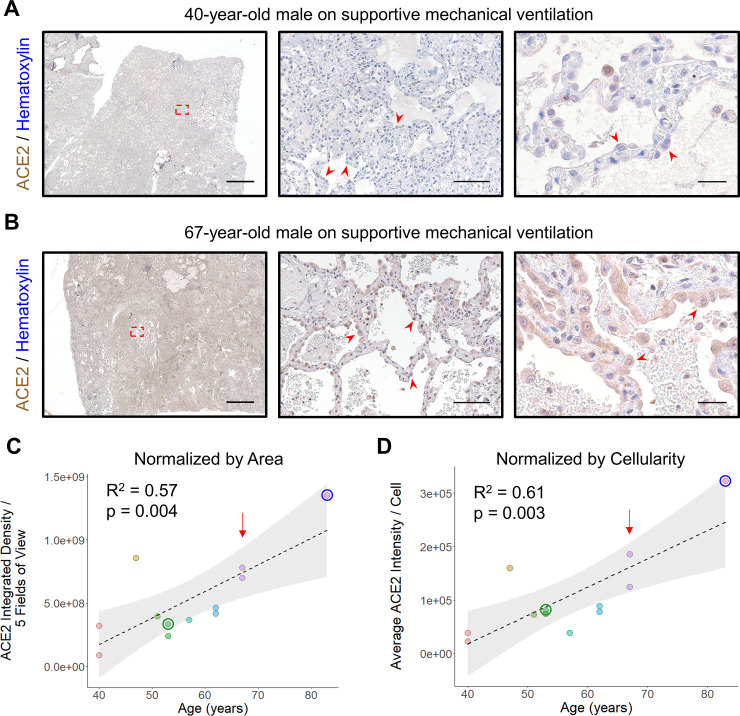
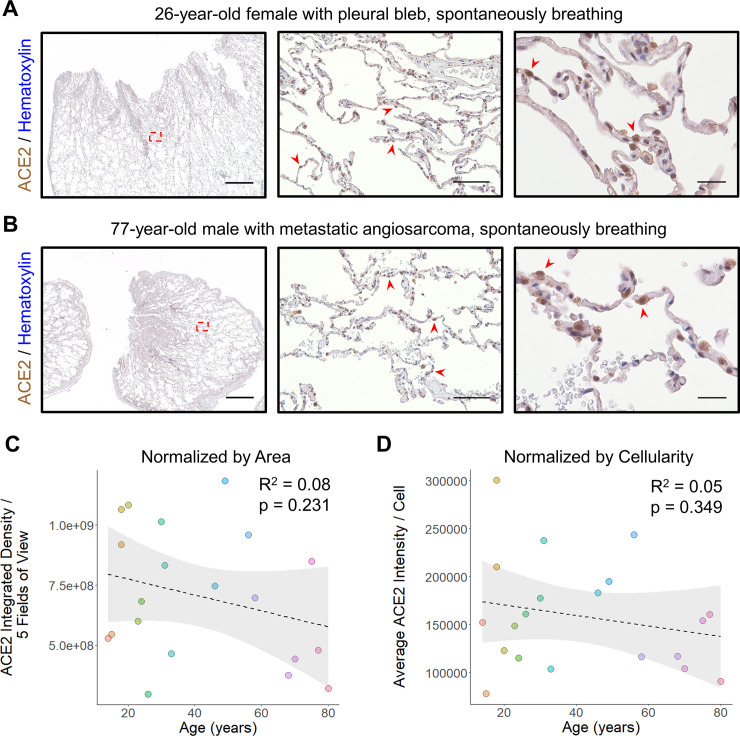
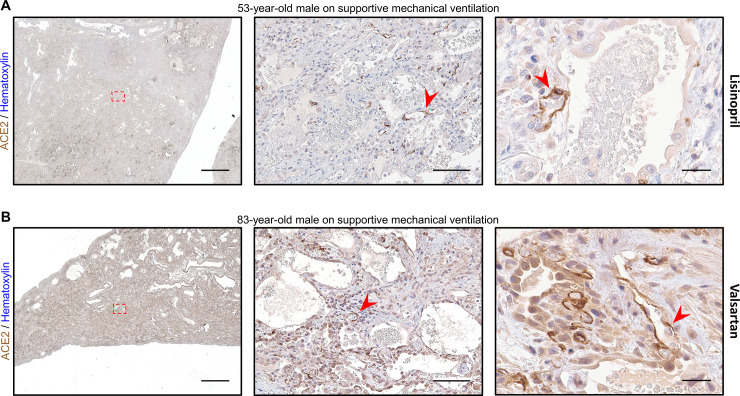
Mortality due to Covid-19 is highly associated with advanced age, owing in large part to severe lower respiratory tract infection. SARS-CoV-2 utilizes the host ACE2 receptor for infection. Whether ACE2 abundance in the lung contributes to age-associated vulnerability is currently unknown. We set out to characterize the RNA and protein expression profiles of ACE2 in aging human lung in the context of phenotypic parameters likely to affect lung physiology. Examining publicly available RNA sequencing data, we discovered that mechanical ventilation is a critical variable affecting lung ACE2 levels. Therefore, we investigated ACE2 protein abundance in patients either requiring mechanical ventilation or spontaneously breathing. ACE2 distribution and expression were determined in archival lung samples by immunohistochemistry (IHC). Tissues were selected from the specimen inventory at a large teaching hospital collected between 2010-2020. Twelve samples were chosen from patients receiving mechanical ventilation for acute hypoxic respiratory failure (AHRF). Twenty samples were selected from patients not requiring ventilation. We compared samples across age, ranging from 40-83 years old in the ventilated cohort and 14-80 years old in the non-ventilated cohort. Within the alveolated parenchyma, ACE2 expression is predominantly observed in type II pneumocytes (or alveolar type II / AT2 cells) and alveolar macrophages. All 12 samples from our ventilated cohort showed histologic features of diffuse alveolar damage including reactive, proliferating AT2 cells. In these cases, ACE2 was strongly upregulated with age when normalized to lung area (p = 0.004) or cellularity (p = 0.003), associated with prominent expression in AT2 cells. In non-ventilated individuals, AT2 cell reactive changes were not observed and ACE2 expression did not change with age when normalized to lung area (p = 0.231) or cellularity (p = 0.349). In summary, ACE2 expression increases with age in the setting of alveolar damage observed in patients on mechanical ventilation, providing a potential mechanism for higher Covid-19 mortality in the elderly.
Conflict of interest statement
The authors have declared that no competing interests exist.
Figures
Similar articles
-
Increased Angiotensin-Converting Enzyme 2 and Loss of Alveolar Type II Cells in COVID-19-related Acute Respiratory Distress Syndrome.Am J Respir Crit Care Med. 2021 Nov 1;204(9):1024-1034. doi: 10.1164/rccm.202012-4461OC. Am J Respir Crit Care Med. 2021. PMID: 34449302 Free PMC article.
-
ACE2 protein expression in lung tissues of severe COVID-19 infection.Sci Rep. 2022 Mar 8;12(1):4058. doi: 10.1038/s41598-022-07918-6. Sci Rep. 2022. PMID: 35260724 Free PMC article.
-
Overexpression of the SARS-CoV-2 receptor ACE2 is induced by cigarette smoke in bronchial and alveolar epithelia.J Pathol. 2021 Jan;253(1):17-30. doi: 10.1002/path.5555. Epub 2020 Oct 27. J Pathol. 2021. PMID: 32991738 Free PMC article.
-
Involvement of the ACE2/Ang-(1-7)/MasR Axis in Pulmonary Fibrosis: Implications for COVID-19.Int J Mol Sci. 2021 Nov 30;22(23):12955. doi: 10.3390/ijms222312955. Int J Mol Sci. 2021. PMID: 34884756 Free PMC article. Review.
-
Expression profiles revealed potential kidney injury caused by SARS-CoV-2: a systematic analysis of ACE2 and clinical lessons learned from this discovery.Aging (Albany NY). 2020 Nov 21;13(8):10821-10832. doi: 10.18632/aging.202224. Epub 2020 Nov 21. Aging (Albany NY). 2020. PMID: 33234728 Free PMC article.
Cited by
-
Acute Respiratory Distress Syndrome: Focus on Viral Origin and Role of Pulmonary Lymphatics.Biomedicines. 2021 Nov 20;9(11):1732. doi: 10.3390/biomedicines9111732. Biomedicines. 2021. PMID: 34829961 Free PMC article. Review.
-
High D-glucose levels induce ACE2 expression via GLUT1 in human airway epithelial cell line Calu-3.BMC Mol Cell Biol. 2022 Jul 15;23(1):29. doi: 10.1186/s12860-022-00427-4. BMC Mol Cell Biol. 2022. PMID: 35836103 Free PMC article.
-
Detection of SARS-CoV-2 infection in a pediatric population from south Italy without symptoms of Coronavirus Disease 2019.Int J Clin Exp Pathol. 2021 Dec 15;14(12):1155-1159. eCollection 2021. Int J Clin Exp Pathol. 2021. PMID: 35027996 Free PMC article.
-
Interleukin-6 Perpetrator of the COVID-19 Cytokine Storm.Indian J Clin Biochem. 2021 Oct;36(4):440-450. doi: 10.1007/s12291-021-00989-8. Epub 2021 Jun 21. Indian J Clin Biochem. 2021. PMID: 34177139 Free PMC article. Review.
-
Aging shapes infection profiles of influenza A virus and SARS-CoV-2 in human precision-cut lung slices.Respir Res. 2025 Mar 24;26(1):112. doi: 10.1186/s12931-025-03190-0. Respir Res. 2025. PMID: 40128814 Free PMC article.
References
-
- Dhama K, Patel SK, Pathak M, Yatoo MI, Tiwari R, Malik YS, et al. An update on SARS-CoV-2/COVID-19 with particular reference to its clinical pathology, pathogenesis, immunopathology and mitigation strategies. Travel Medicine and Infectious Disease. 2020; 101755 10.1016/j.tmaid.2020.101755 - DOI - PMC - PubMed
-
- Hao S-R, Zhang S-Y, Lian J-S, Jin X, Ye C-Y, Cai H, et al. Liver Enzyme Elevation in Coronavirus Disease 2019: A Multicenter, Retrospective, Cross-Sectional Study. American Journal of Gastroenterology. 9000;Publish Ahead of Print. Available: https://journals.lww.com/ajg/Fulltext/9000/Liver_Enzyme_Elevation_in_Cor... 10.14309/ajg.0000000000000717 - DOI - PMC - PubMed
MeSH terms
Substances
LinkOut - more resources
Full Text Sources
Other Literature Sources
Medical
Miscellaneous
