. 2021 Feb 16;17(2):e1009042.
doi: 10.1371/journal.ppat.1009042. eCollection 2021 Feb.

Non-permissive human conventional CD1c+ dendritic cells enable trans-infection of human primary renal tubular epithelial cells and protect BK polyomavirus from neutralization

Affiliations

Non-permissive human conventional CD1c+ dendritic cells enable trans-infection of human primary renal tubular epithelial cells and protect BK polyomavirus from neutralization

Mathieu Sikorski et al. PLoS Pathog. .

Abstract

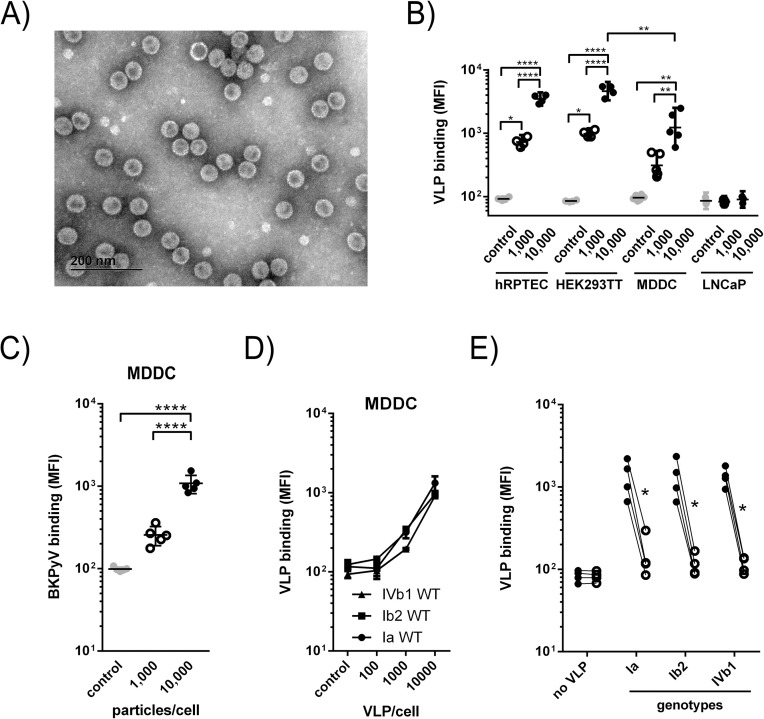
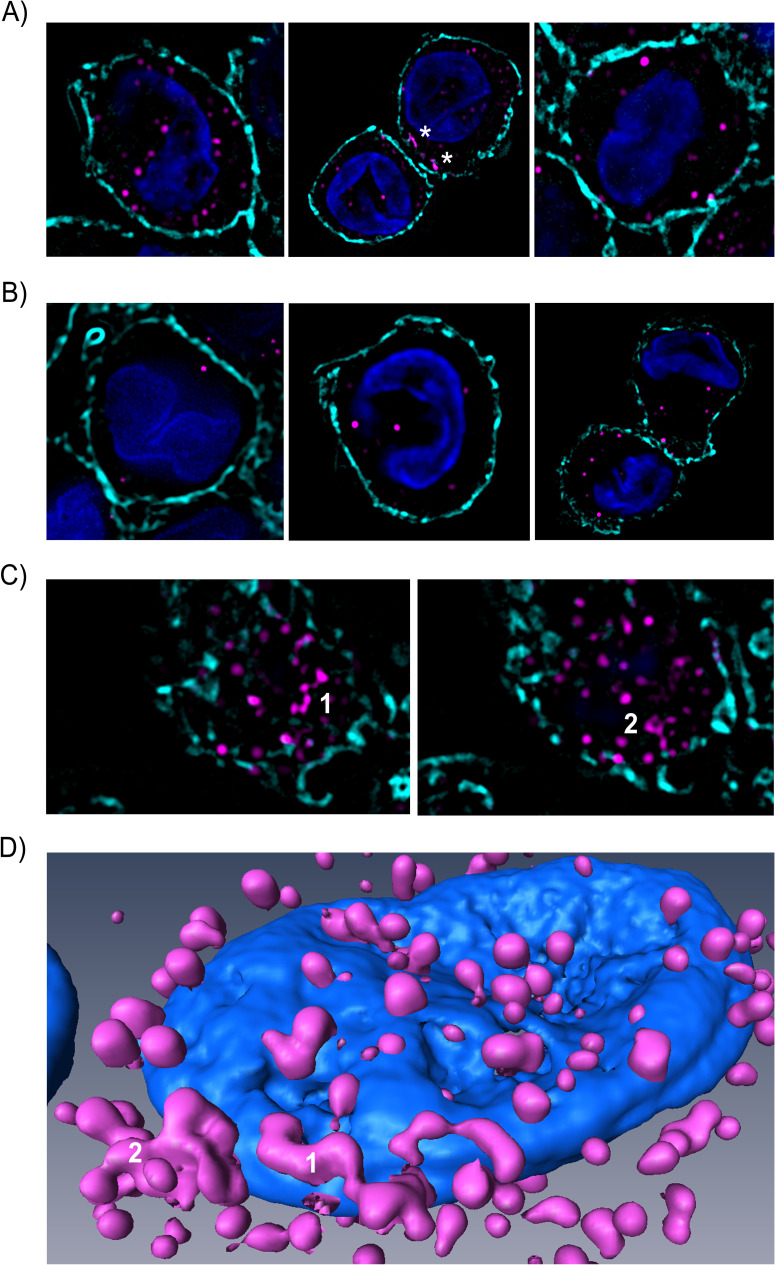
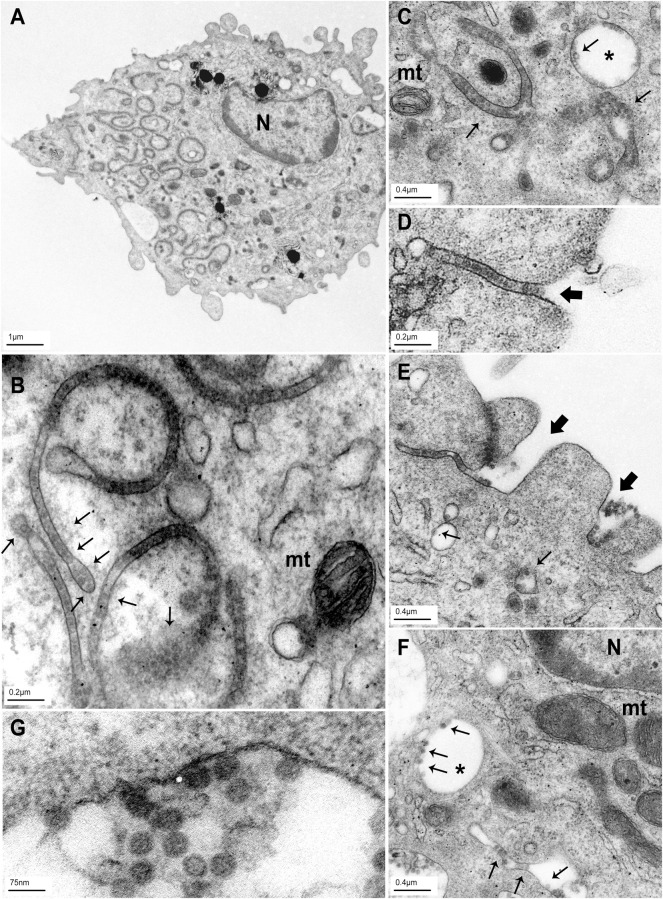
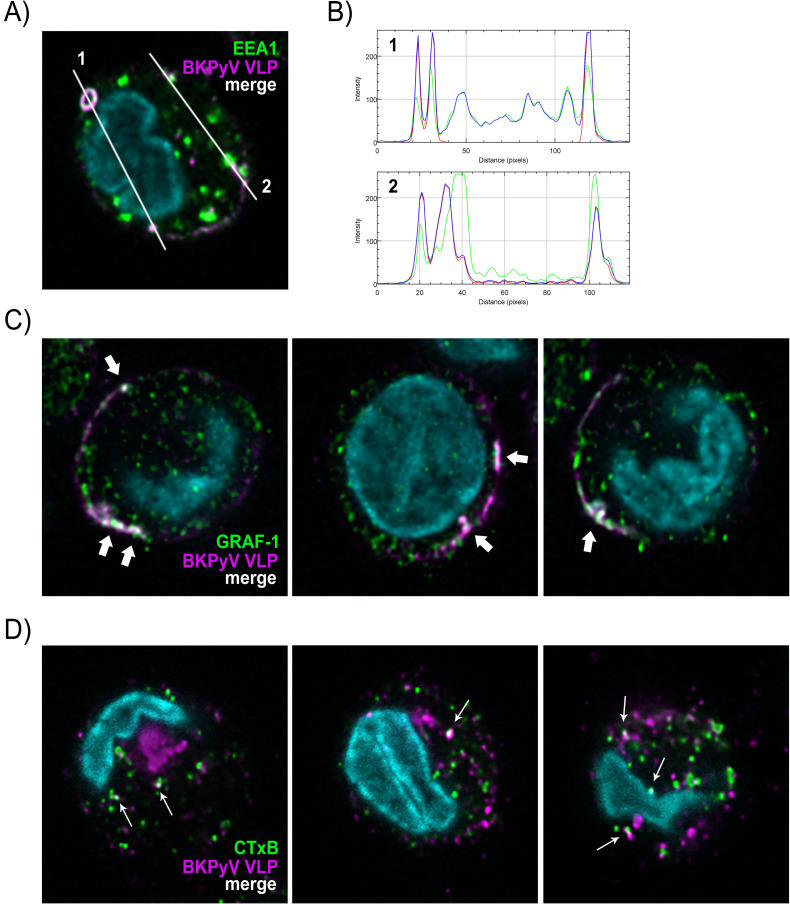
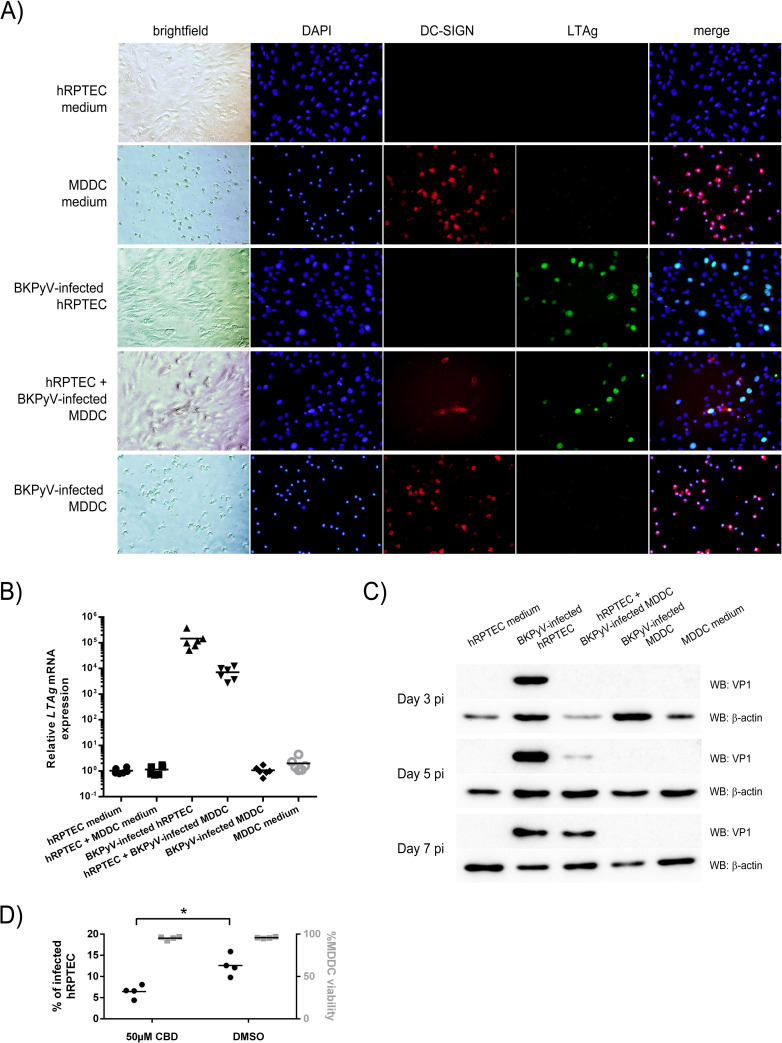
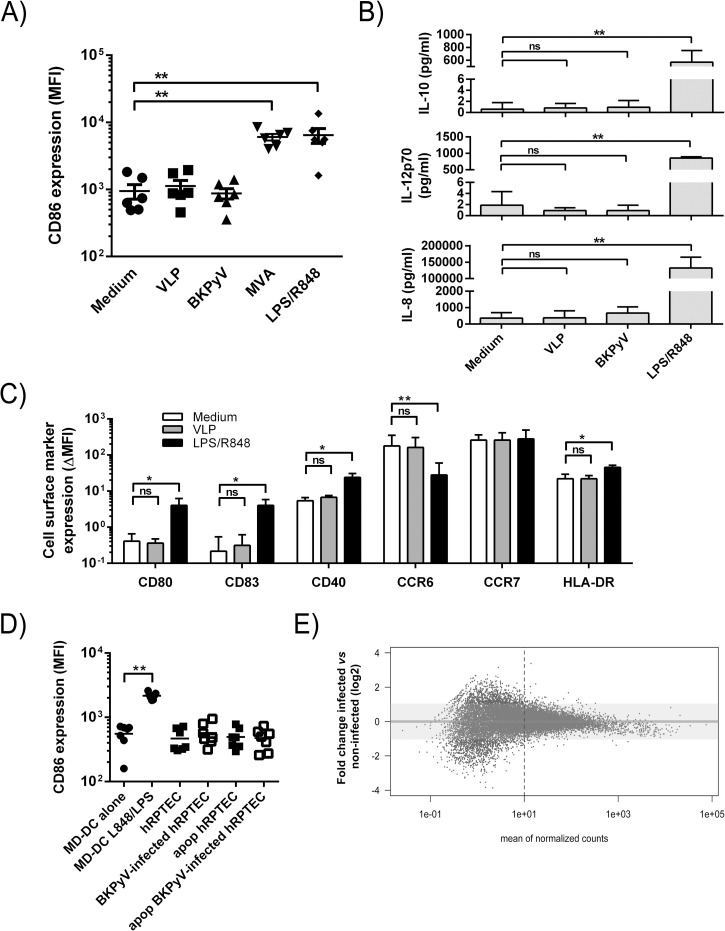
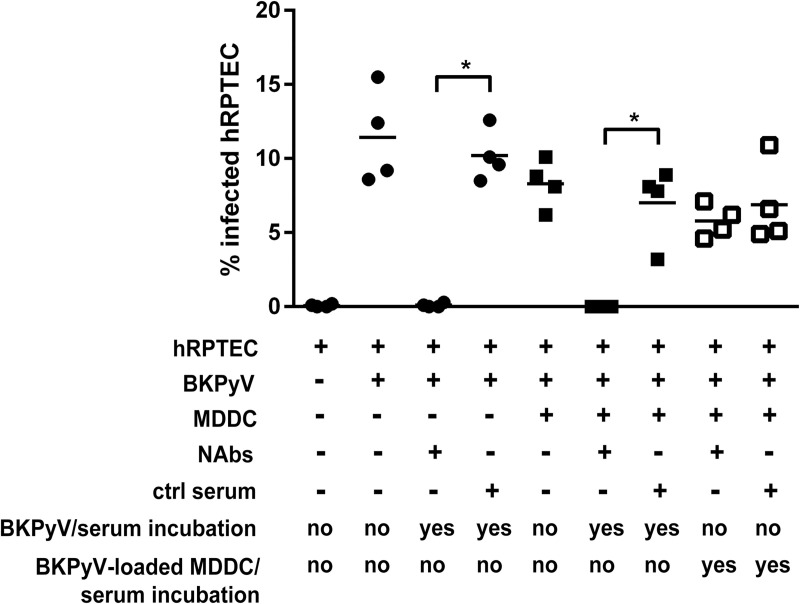
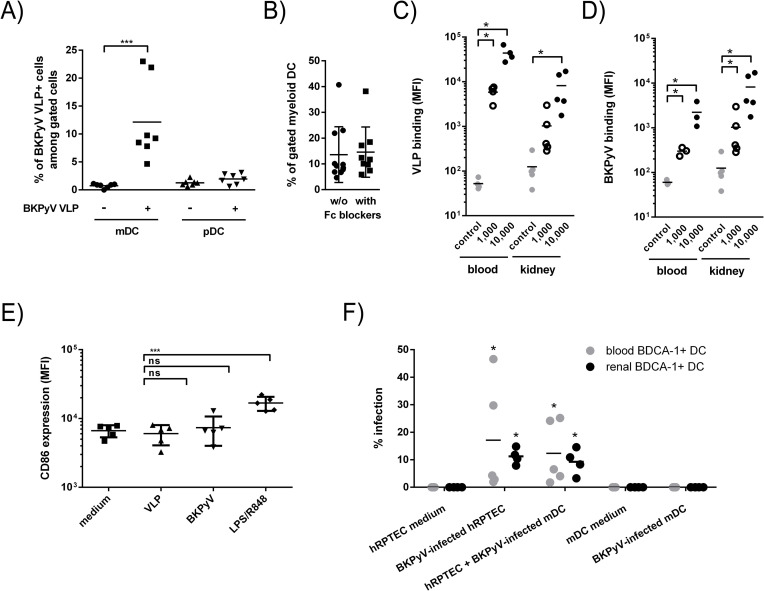
The BK polyomavirus (BKPyV) is a ubiquitous human virus that persists in the renourinary epithelium. Immunosuppression can lead to BKPyV reactivation in the first year post-transplantation in kidney transplant recipients (KTRs) and hematopoietic stem cell transplant recipients. In KTRs, persistent DNAemia has been correlated to the occurrence of polyomavirus-associated nephropathy (PVAN) that can lead to graft loss if not properly controlled. Based on recent observations that conventional dendritic cells (cDCs) specifically infiltrate PVAN lesions, we hypothesized that those cells could play a role in BKPyV infection. We first demonstrated that monocyte-derived dendritic cells (MDDCs), an in vitro model for mDCs, captured BKPyV particles through an unconventional GRAF-1 endocytic pathway. Neither BKPyV particles nor BKPyV-infected cells were shown to activate MDDCs. Endocytosed virions were efficiently transmitted to permissive cells and protected from the antibody-mediated neutralization. Finally, we demonstrated that freshly isolated CD1c+ mDCs from the blood and kidney parenchyma behaved similarly to MDDCs thus extending our results to cells of clinical relevance. This study sheds light on a potential unprecedented CD1c+ mDC involvement in the BKPyV infection as a promoter of viral spreading.


Conflict of interest statement

The authors have declared that no competing interests exist.

Figures

Fig 1
Fig 1. MDDCs bind BKPyV particles in a dose- and sialic acid-dependent manner.
(A) Negative contrast TEM picture of genotype Ib2 (gIb2) VLPs. A 200nm scale bar is represented on the micrograph. (B) Fluorescent-labelled gIb2 VLP binding to hRPTECs, HEK293TT, MDDCs and LNCaP cells (n = 3) assessed by flow cytometry. Mean Fluorescence Intensities (MFIs) are displayed (n = 5; n = 3 for LNCaP only). (C) Alexa Fluor 647-conjugated infectious particles (Dunlop strain) binding to MDDCs (n = 5). (D) Dose dependent binding of genotypes Ia (circle), Ib2 (square) and IVb1 (triangle) VLPs to MDDCs (n = 5). (E) Alexa Fluor 647-conjugated genotypes Ia, Ib2 and IVb1 VLPs (104 VLPs/cell) binding to MDDCs with (empty circles) or without (closed circles) treatment with 0.2U/mL neuraminidase from Clostridium perfringens, specifically cleaving α(2,3/6/8)-linked sialic acid. Data are represented as MFI ± SEM. Statistically significant results were marked by one or several asterisks according to the level of significance: * = p<0.05, ** = p<0.01, **** = p<0.0001; one-way ANOVA with Tukey’s multiple comparison tests.
Fig 2
Fig 2. High-resolution confocal images of genotype Ia BKPyV particles endocytosed in MDDCs.
Three panels showing independent cells that contain intracellular dot-like or amorphous tube-shaped (white asterisk) accumulations of Alexa Fluor 647-conjugated gIa VLPs (A) or BKPyV infectious particles (B; Dunlop strain). Images show focal planes extracted from six different cells stacks (104 VLPs/cell or 1FFU/cell respectively for VLPs and infectious particles; magenta). (C) Two distinct focal planes extracted from the cell stack from which the image in the center of Fig 2A is shown. “1” and “2” indicate the tube-shaped structures marked by asterisks in Fig 2A. (D) Amira 3D reconstruction of the cell represented in Fig 2A (center) showing round-shaped and pleiomorphous tube-shaped intracellular structures containing Alexa Fluor 647-conjugated gIa VLPs. Cell membranes were stained with fluorescence-labelled WGA (Alexa Fluor 488 displayed in light blue) and nuclei were counterstained with DAPI. High-resolution confocal images were obtained from the A1 Nikon microscope equipped with a SIM module.
Fig 3
Fig 3. TEM reveals unlabeled BKPyV endocytosis into large round- and tube-shaped vesicles in MDDCs.
(A) Micrograph showing a general view of a representative MDDC incubated for 30 minutes at 37°C with 104 VLPs/cell (gIb2). Noticeably, the cell contains abundant tube-shaped structures. (B, C, D, E and G) Pleiomorphous or large round vesicles containing VLPs are shown at a higher magnification (G: x100,000–120,000). (F) This image represents infectious BKPyV particles into macropinosome-like (round-shaped) and tube-shaped vesicles (1FFU/cell). (D) and (E) Micrographs showing VLP internalization from the cell surface into tube-shaped endosomes. Thin and bold arrows indicate particles and tube formation respectively; asterisk indicate large vesicles resembling macropinosomes. N = nucleus; mt = mitochondria. Scale bars are indicated for each micrograph.
Fig 4
Fig 4. BKPyV particles colocalize with EEA-1, GRAF-1 and CTxB in MDDCs revealing an unconventional endocytic pathway.
(A) Confocal sections of MDDCs incubated for 30 minutes at 37°C with 104 fluorescent VLPs/cell (magenta). EEA-1-positive endocytic vesicles were stained after fixation (green). Nuclei were counterstained with DAPI (light blue). The colocalization between VLPs and EEA-1 is shown in white. (B) RGB profiles along two measurement lines (1 and 2, showed in Fig 3A) analyzed with ImageJ software. Colocalization is represented by merging blue and red (= magenta) representing VLPs and green histograms (1 pixel = 88nm). (C) and (D) show respectively colocalization of BKPyV VLPs with GRAF-1 (bold white arrows) and Alexa Fluor 555-conjugated cholera toxin subunit B (CTxB; 2μg/mL; thin white arrows). Deconvoluted images are presented. Displayed data are representative of three independent experiments.
Fig 5
Fig 5. MDDCs do not support BKPyV infection but mediate its transmission to primary hRPTECs.
(A) Epifluorescence microscope images (x10 magnification) showing large T antigen (LTAg) immunostaining (green) of hRPTECs and/or MDDCs in various conditions indicated on top of rows, respectively: hRPTECs alone (medium), MDDCs alone (medium), BKPyV-infected hRPTECs (MOI = 0.1; approximately 200 particles/cell), non-infected hRPTECs layered with BKPyV-infected MDDCs (excess of virus, i.e. unbound virus, was removed by extensive washes after a 2 hour-incubation of MDDCs with virus) and BKPyV-infected MDDCs (idem previous condition). LTAg is revealed at seven dpi. Brightfield images of the immunostaining are shown in the first column. DC-SIGN (red) is a marker allowing to discriminate MDDCs from hRPTECs when necessary. Nuclei were counterstained with DAPI. (B) RT-qPCR data showing the amplification of LTAg mRNA seven dpi in various conditions (similar to those presented in Fig 6A; n = 6). Of note, a condition with uninfected MDDCs with uninfected hRPTECs has been added here. (C) Western blot analysis of VP1 expression, as a late BKPyV infection event, in cell lysates after three, five, and seven dpi. β actin was revealed similarly after membrane stripping as a loading control. Fig 5A and 5C are representative of three independent experiments.
Fig 6
Fig 6. BKPyV virions or BKPyV-infected cells fail to activate MDDCs.
(A) CD86 cell surface expression was assessed by flow cytometry on immature MDDCs alone (circles) or cultured with VLPs (squares; 103 particles/cell), BKPyV particles (triangles; 103 particles/cell) MVA (inverted triangles) or a TLR agonist cocktail (diamonds; 100ng/mL LPS and 1μg/mL R848 after 24 hours (n = 6). (B) ELISA titration of IL-10, IL-12p70 and IL-8 in the supernatants of untreated or MDDCs cultivated with VLPs, BKPyV particles or R848/LPS (doses were similar to those employed in Fig 4A). (C) Cell surface expression of CD80, CD83, CD40, CCR6, CCR7 and the HLA-DR on MDDCs alone (empty bars) or cultured for 24 hours with VLPs (grey bars; 103 particles/cell) or LPS/R848 (black bars). Data are represented as MFI ± SEM. For each MFI, background, i.e. autofluorescence, is subtracted to calculate ΔMFI values displayed in this figure (n = 4). (D) Similar to experiments in A. Apop = apoptotic cells. Apoptosis was induced by UVB-irradiation and apoptotic cell fragments were collected by centrifugation and extensive washing in PBS. (E) RNAseq analysis of differentially expressed genes between infected (one dpi) and non-infected MDDCs. The dashed line represents a “ten counts per gene” limit above which gene expression is considered as robust. The Y axis represents the Log2 fold change in gene expression. Statistically significant results were marked by one or several asterisks according to the level of significance: ns = non-significant, * = p<0.05, ** = p<0.01, *** = p<0.001, **** = p<0.0001; one-way ANOVA with Tukey’s multiple comparison tests.
Fig 7
Fig 7. Endocytosed BKPyV particles into MDDCs are protected from serum neutralization.
HCS automated counting to evaluate percentages of BKPyV-infected hRPTECs (= LTAg+ cells) in various conditions including cis- and trans-infection experiments but with or without sera from a seronegative patient (= control serum, neutralization titres <1/200) or a controller patient (= neutralizing serum). Neutralizing antibody titers in this serum had been previously determined: between 1/200.000, 1/500.000 and 1/20.000 for genotypes Ia, Ib2 and IVc2 respectively (see Cis and Trans-infection assays in Methods). Here, both sera were x1000-diluted. Sera were either added before or after incubation of the BKPyV suspension (Dunlop strain at MOI = 0.1) with MDDCs. Results represent mean values of the percentage of LTAg+ hRPTECs ± SEM. Statistically significant results are marked by an asterisk; * = p<0.05; one-way ANOVA with Tukey’s multiple comparison tests.
Fig 8
Fig 8. Blood and kidney CD1c+ myeloid DCs bind and transmit BKPyV to primary hRPTECs without getting infected.
(A) Quantitative measurement of VLP positive cDCs and pDCs in whole blood of healthy volunteers according to the gating strategy shown in S1 Fig. (B) Quantitative analysis of VLP binding to cDCs with (closed squares) or without (closed circles) Fc receptor blockade. Dose-dependent BKPyV VLP (C) or infectious particle (D) binding to purified CD1c+ DCs from blood or kidney of healthy individuals; the “control” condition means no VLP (grey circles). Black closed and empty circles represent 103 and 104 particles/cell respectively. The immunomagnetic cell sorting strategy is shown in S1 Fig. (E) CD86 cell surface expression assessed by flow cytometry on freshly isolated blood CD1c+ DCs cultured for 24 hours in medium alone (squares) or with VLPs (triangles; 103 particles per cells), BKPyV particles (inverted triangles; ibid) or with LPS/R848 (diamonds; 100ng/mL LPS and 1μg/mL R848); n = 4 distinct blood donors. (F) Quantitative assessment of the ability of CD1c+ mDCs from blood (grey dots) or kidney (black dots), ie from healthy blood donors and macroscopically healthy parts of resected human tumor-bearing kidneys, to capture and transfer BKPyV to hRPTECs as shown in Fig 6A. The percentage of infected hRPTECs corresponds to the percentage of LTAg+ hRPTECs within total cells, i.e., DAPI counterstained nuclei(47), based on an automated counting on a HCS device. Data are represented as percentage of infection. Statistical analyses have been applied to comparisons between % of infected hRPTECs in coculture with cDCs with or without preincubation with the Dunlop strain. Statistically significant results are marked by an asterisk; * = p<0.05, ** = p<0.01, *** = p<0.001; one-way ANOVA with Tukey’s multiple comparison tests.

Similar articles

Cited by

References

    1. Gardner SD, Field AM, Coleman DV, Hulme B. New human papovavirus (B.K.) isolated from urine after renal transplantation. Lancet. 1971. 10.1016/s0140-6736(71)91776-4 - DOI - PubMed
    1. Seif I, Khoury G, Dhar R. The genome of human papovavirus BKV. Cell. 1979. December;18(4):963–77. 10.1016/0092-8674(79)90209-5 . - DOI - PubMed
    1. Wright PJ, Di Mayorca G. Virion polypeptide composition of the human papovavirus BK: comparison with simian virus 40 and polyoma virus. Journal of virology. 1975. April;15(4):828–35. 10.1128/JVI.15.4.828-835.1975 . Pubmed Central PMCID: 354526. - DOI - PMC - PubMed
    1. Chesters PM, Heritage J, McCance DJ. Persistence of DNA sequences of BK virus and JC virus in normal human tissues and in diseased tissues. J Infect Dis. 1983. April;147(4):676–84. 10.1093/infdis/147.4.676 . - DOI - PubMed
    1. Egli A, Infanti L, Dumoulin A, Buser A, Samaridis J, Stebler C, et al. Prevalence of polyomavirus BK and JC infection and replication in 400 healthy blood donors. J Infect Dis. 2009. March 15;199(6):837–46. 10.1086/597126 . - DOI - PubMed

Publication types

MeSH terms