B2 SINE Copies Serve as a Transposable Boundary of DNA Methylation and Histone Modifications in the Mouse
- PMID: 33592095
- PMCID: PMC8136502
- DOI: 10.1093/molbev/msab033
B2 SINE Copies Serve as a Transposable Boundary of DNA Methylation and Histone Modifications in the Mouse
Abstract
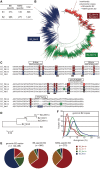
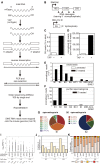
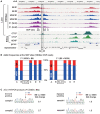
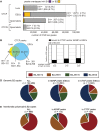
More than one million copies of short interspersed elements (SINEs), a class of retrotransposons, are present in the mammalian genomes, particularly within gene-rich genomic regions. Evidence has accumulated that ancient SINE sequences have acquired new binding sites for transcription factors (TFs) through multiple mutations following retrotransposition, and as a result have rewired the host regulatory network during the course of evolution. However, it remains unclear whether currently active SINEs contribute to the expansion of TF binding sites. To study the mobility, expression, and function of SINE copies, we first identified about 2,000 insertional polymorphisms of SINE B1 and B2 families within Mus musculus. Using a novel RNA sequencing method designated as melRNA-seq, we detected the expression of SINEs in male germ cells at both the subfamily and genomic copy levels: the vast majority of B1 RNAs originated from evolutionarily young subfamilies, whereas B2 RNAs originated from both young and old subfamilies. DNA methylation and chromatin immunoprecipitation-sequencing (ChIP-seq) analyses in liver revealed that polymorphic B2 insertions served as a boundary element inhibiting the expansion of DNA hypomethylated and histone hyperacetylated regions, and decreased the expression of neighboring genes. Moreover, genomic B2 copies were enriched at the boundary of various histone modifications, and chromatin insulator protein, CCCTC-binding factor, a well-known chromatin boundary protein, bound to >100 polymorphic and >10,000 non-polymorphic B2 insertions. These results suggest that the currently active B2 copies are mobile boundary elements that can modulate chromatin modifications and gene expression, and are likely involved in epigenomic and phenotypic diversification of the mouse species.
Keywords: SINE; chromatin boundary; epigenetics; intra-specific difference; transposable elements.
© The Author(s) 2021. Published by Oxford University Press on behalf of the Society for Molecular Biology and Evolution.
Figures



Similar articles
-
Epigenetic regulation of transcription and possible functions of mammalian short interspersed elements, SINEs.Genes Genet Syst. 2013;88(1):19-29. doi: 10.1266/ggs.88.19. Genes Genet Syst. 2013. PMID: 23676707 Review.
-
Transposable B2 SINE elements can provide mobile RNA polymerase II promoters.Nat Genet. 2001 May;28(1):77-81. doi: 10.1038/ng0501-77. Nat Genet. 2001. PMID: 11326281
-
Identification and Characterization of LINE and SINE Retrotransposons in the African Hedgehog (Atelerix albiventris, Erinaceidae) and Their Association with 3D Genome Organization and Gene Expression.Genes (Basel). 2025 Mar 29;16(4):397. doi: 10.3390/genes16040397. Genes (Basel). 2025. PMID: 40282356 Free PMC article.
-
Enrichment of short interspersed transposable elements to embryonic stem cell-specific hypomethylated gene regions.Genes Cells. 2010 Aug;15(8):855-65. doi: 10.1111/j.1365-2443.2010.01423.x. Epub 2010 Jun 13. Genes Cells. 2010. PMID: 20629982
-
Genomic gems: SINE RNAs regulate mRNA production.Curr Opin Genet Dev. 2010 Apr;20(2):149-55. doi: 10.1016/j.gde.2010.01.004. Epub 2010 Feb 20. Curr Opin Genet Dev. 2010. PMID: 20176473 Free PMC article. Review.
Cited by
-
Mouse B2 SINE elements function as IFN-inducible enhancers.Elife. 2023 May 9;12:e82617. doi: 10.7554/eLife.82617. Elife. 2023. PMID: 37158599 Free PMC article.
-
Identification and functional characterization of the German cockroach, Blattella germanica, short interspersed nuclear elements.PLoS One. 2022 Jun 13;17(6):e0266699. doi: 10.1371/journal.pone.0266699. eCollection 2022. PLoS One. 2022. PMID: 35696390 Free PMC article.
-
Evolutionary dynamics between transposable elements and their host genomes: mechanisms of suppression and escape.Curr Opin Genet Dev. 2023 Oct;82:102092. doi: 10.1016/j.gde.2023.102092. Epub 2023 Jul 28. Curr Opin Genet Dev. 2023. PMID: 37517354 Free PMC article. Review.
-
Transposable elements in mammalian chromatin organization.Nat Rev Genet. 2023 Oct;24(10):712-723. doi: 10.1038/s41576-023-00609-6. Epub 2023 Jun 7. Nat Rev Genet. 2023. PMID: 37286742 Review.
-
Insertion of short L1 sequences generates inter-strain histone acetylation differences in the mouse.Mob DNA. 2024 May 10;15(1):11. doi: 10.1186/s13100-024-00321-0. Mob DNA. 2024. PMID: 38730323 Free PMC article.
References
-
- Albracht SP, Meijer AJ, Rydstrom J.. 2011. Mammalian NADH:ubiquinone oxidoreductase (Complex I) and nicotinamide nucleotide transhydrogenase (Nnt) together regulate the mitochondrial production of H(2)O(2)–implications for their role in disease, especially cancer. J BioenergBiomembr.43(5):541–564. - PubMed
-
- Allen TA, Von Kaenel S, Goodrich JA, Kugel JF.. 2004. The SINE-encoded mouse B2 RNA represses mRNA transcription in response to heat shock. Nat Struct Mol Biol.11(9):816–821. - PubMed
-
- Bejerano G, Lowe CB, Ahituv N, King B, Siepel A, Salama SR, Rubin EM, Kent WJ, Haussler D.. 2006. A distal enhancer and an ultraconserved exon are derived from a novel retroposon. Nature 441(7089):87–90. - PubMed
Publication types
MeSH terms
Substances
LinkOut - more resources
Full Text Sources
Other Literature Sources
Molecular Biology Databases
Miscellaneous

