. 2021 May;36(5):1012-1025.
doi: 10.1002/jbmr.4273. Epub 2021 May 4.

A Neuroskeletal Atlas: Spatial Mapping and Contextualization of Axon Subtypes Innervating the Long Bones of C3H and B6 Mice

Affiliations

A Neuroskeletal Atlas: Spatial Mapping and Contextualization of Axon Subtypes Innervating the Long Bones of C3H and B6 Mice

Madelyn R Lorenz et al. J Bone Miner Res. 2021 May.

Abstract

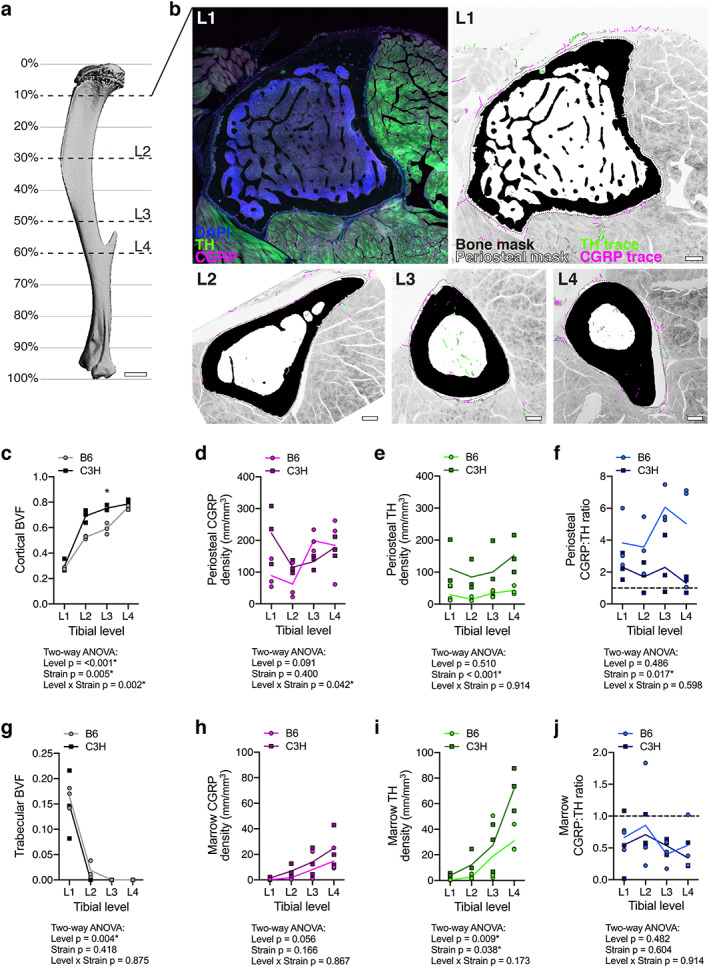
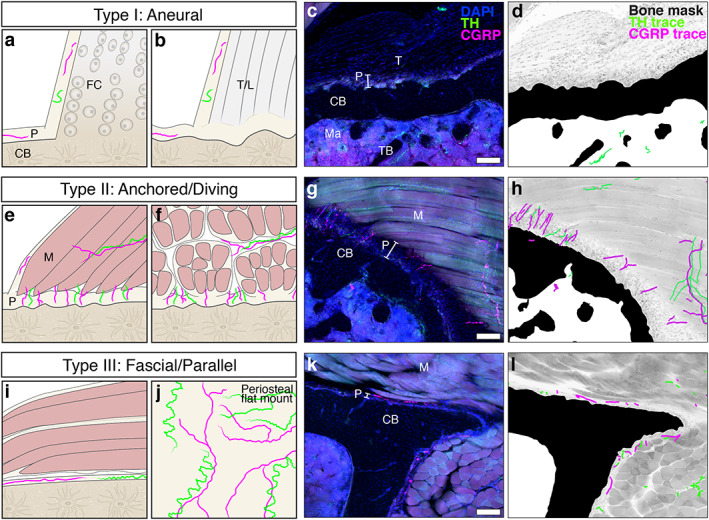
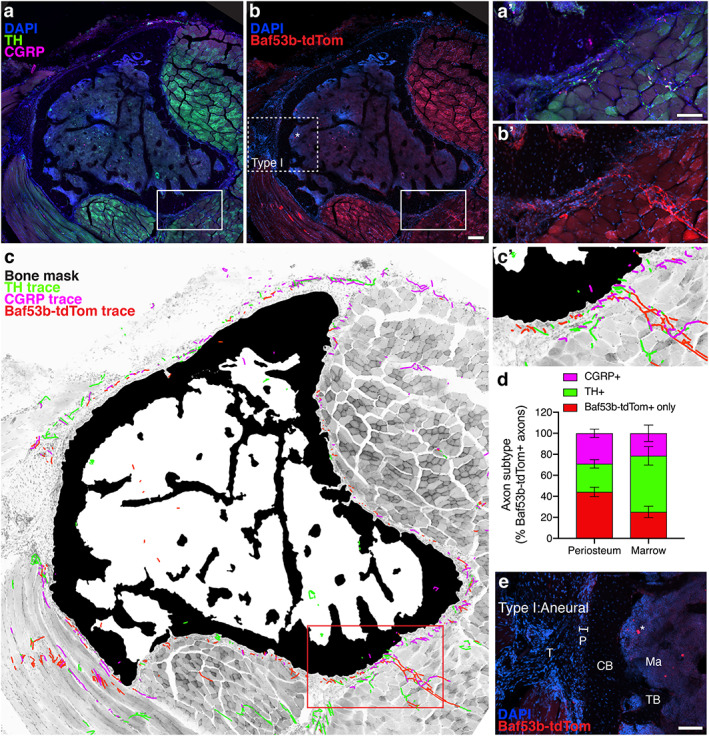
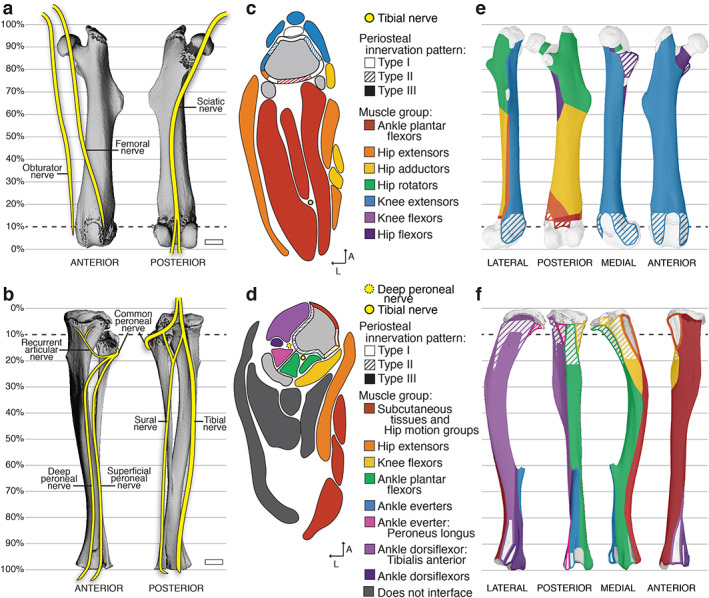
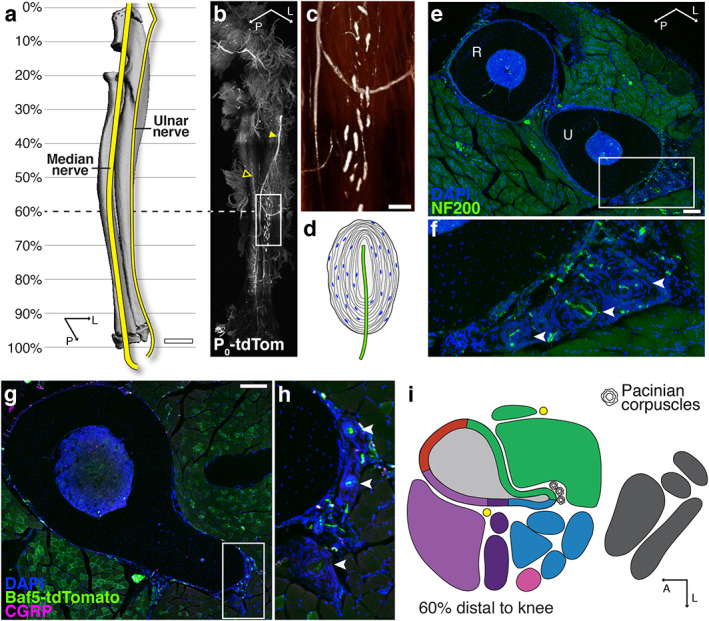
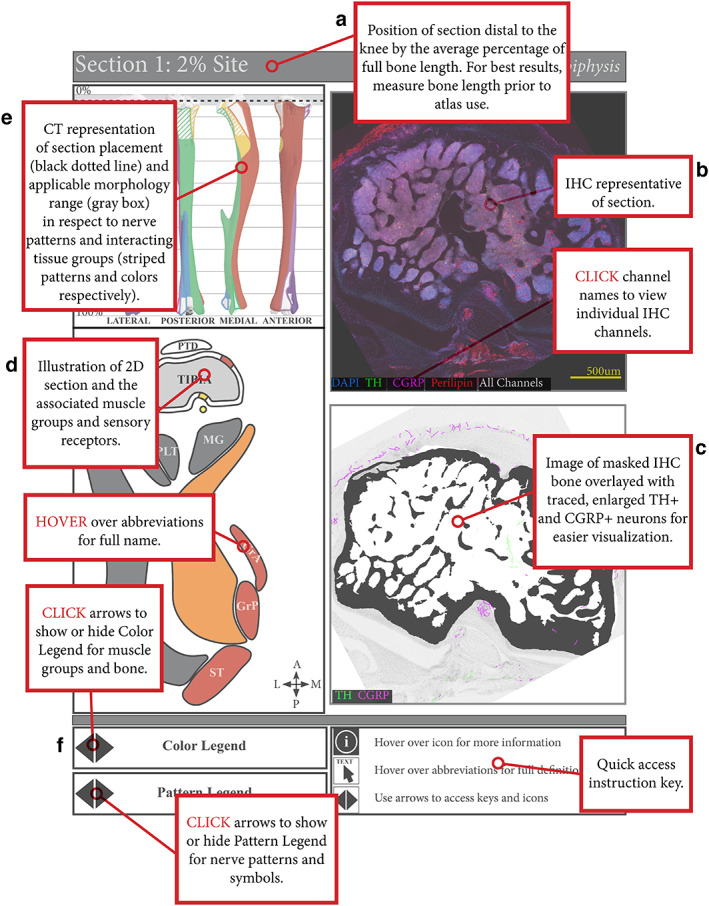
Nerves in bone play well-established roles in pain and vasoregulation and have been associated with progression of skeletal disorders, including osteoporosis, fracture, arthritis, and tumor metastasis. However, isolation of the region-specific mechanisms underlying these relationships is limited by our lack of quantitative methods for neuroskeletal analysis and precise maps of skeletal innervation. To overcome these limitations, we developed an optimized workflow for imaging and quantitative analysis of axons in and around the bone, including validation of Baf53b-Cre in concert with R26R-tdTomato (Ai9) as a robust pan-neuronal reporter system for use in musculoskeletal tissues. In addition, we created comprehensive maps of sympathetic adrenergic and sensory peptidergic axons within and around the full length of the femur and tibia in two strains of mice (B6 and C3H). In the periosteum, these maps were related to the surrounding musculature, including entheses and myotendinous attachments to bone. Three distinct patterns of periosteal innervation (termed type I, II, III) were defined at sites that are important for bone pain, bone repair, and skeletal homeostasis. For the first time, our results establish a gradient of bone marrow axon density that increases from proximal to distal along the length of the tibia and define key regions of interest for neuroskeletal studies. Lastly, this information was related to major nerve branches and local maps of specialized mechanoreceptors. This detailed mapping and contextualization of the axonal subtypes innervating the skeleton is intended to serve as a guide during the design, implementation, and interpretation of future neuroskeletal studies and was compiled as a resource for the field as part of the NIH SPARC consortium. © 2021 The Authors. Journal of Bone and Mineral Research published by Wiley Periodicals LLC on behalf of American Society for Bone and Mineral Research (ASBMR)..

Keywords: BONE-BRAIN-NERVOUS SYSTEM INTERACTIONS; BONE-FAT INTERACTIONS; BONE-MUSCLE INTERACTIONS.


Figures

Fig 1
Fig 1
Neuroskeletal axon density varies by bone compartment, tibial level, and mouse strain. (A) 3D rendering of a μCT scan of a 12‐week‐old male B6 tibia, lateral view. L1 to L4 represent levels analyzed as distinguished by cross‐sectional bone morphology. Percentages demarcate approximate distance from the knee as a percentage of total tibia length. Scale bar = 1 mm. (B) L1 left: representative confocal micrograph through a 50‐μm‐thick transverse cross section with immunolabeled CGRP+ sensory axons (magenta) and TH+ sympathetic axons (green), as well as DAPI+ nuclei (blue). L1 right and L2 to L4: bone mask (black), periosteal mask (dotted line), CGRP+ axon traces (magenta), and TH+ axon traces (green) overlaid on a grayscale max projection to visualize tibial innervation in the context of the musculoskeletal system at the metaphysis (L1), the diaphysis with tibial ridge (L2), and the diaphysis proximal to the TFJ (L3) and distal to the TFJ (L4). Scale bars = 200 μm. (CJ) Quantification of compartmentalized bone volume fraction (BVF) and innervation density from B6 and C3H mice at each level represented A and B. (C) BVF of cortical bone. (D, E) CGRP+ and TH+ axon density (mm/mm3) within the overlying periosteum. (F) Periosteal CGRP:TH ratio. (G) BVF of trabecular bone. (H, I) CGRP+ and TH+ axon density (mm/mm3) within the marrow cavity. (J) Marrow CGRP:TH ratio. Data points represent individual animals with a mean trendline; n = 3 for each strain and level; two‐way ANOVA with Sidak's multiple comparisons test; *p < .050.
Fig 2
Fig 2
Peripheral axons innervate the periosteum in three distinct patterns (type I, II, III). (AD) Type I: aneural patterns are found at entheses, sites where tendons or ligaments attach to the cortical bone (CB) surface. Aneural regions of the periosteum are devoid of CGRP+ (magenta) and TH+ (green) axons. (A) Tendinous fibers connect seamlessly to bone through unmineralized and mineralized fibrocartilage tissue (FC) at fibrocartilaginous entheses. (B) The tendon or ligament (T/L) is continuous with a thick fibrous layer of the periosteum (P) at fibrous entheses. (C) Confocal micrograph through a 50‐μm‐thick transverse cross section of a tibia from a 12‐week‐old C3H male with immunolabeled CGRP+ sensory axons (magenta) and TH+ sympathetic axons (green), as well as DAPI+ nuclei. (D) Corresponding neuroskeletal traced/masked analysis overlaid on a grayscale max projection demonstrating an aneural enthesis at the tibia metaphysis where the semimembranosus tendon (T) attaches to the bone. Trabecular bone (TB) is visible in the marrow cavity (ma). (EH) Type II: anchored/diving innervation patterns are found at sites where axons transit directly from the associated muscle (M) tissue through the fibrous and cambium layers of the periosteum at a 90‐degree angle to the cortical bone surface as visualized here in the C3H tibia where the popliteus muscle attaches to the bone. (IL) Type III: fascial/parallel innervation patterns are found at sites where fascia attach to bone. Axons are woven through the thin periosteal layer at these sites and run parallel to the bone surface as evident in cross section (I, K, L). The mesh‐like network of periosteal axons at these sites is clearly visualized by periosteal whole‐mount preparation (J; see Martin et al.( 7 ) and Thai et al.( 40 )). Scale bars = 100 μm.
Fig 3
Fig 3
Baf53b‐tdTomato is a robust, selective reporter system for skeletal innervation. (A, B) Representative confocal micrograph of a proximal tibial cross section with immunolabeled CGRP+ sensory axons (magenta) and TH+ sympathetic axons (green) with DAPI+ nuclei (blue, A), and tdTomato expression driven by Baf53b‐Cre, as well as DAPI+ nuclei (blue, B). Asterisks indicate non‐neural, autofluorescence. Scale bar = 200 μm. (C) Bone mask (black), CGRP+ axon traces (magenta), TH+ axon traces (green), and Baf53b‐tdTomato + axon traces overlaid on a grayscale max projection to visualize tibial innervation. CGRP+ and TH+ axons were also positive for Baf53b‐tdTomato. (A′–C′) High magnification of the periosteal innervation of the solid boxed region indicated in A–C. Scale bar = 100 μm. (D) Quantification of compartmentalized axonal subtypes pooled from L1 to L4 represented as a percentage of total Baf53b‐tdTomato + axons. Bars represent mean with SEM; n = 3 individual animals quantified at each level. (E) Aneural region of the periosteum (P), where tendon (T) connects to cortical bone (CB), is devoid of Baf53b‐tdTomato+ axons. TB = trabecular bone; ma = marrow. Scale bar = 100 μm.
Fig 4
Fig 4
Relationships between peripheral nerves and periosteal axon patterns and the musculoskeletal system. (A, B) Schematic of major nerve branches in the anterior and posterior thigh (A) and leg (B) overlaid on 3D‐rendered‐μCT scans of the left femur and tibia–fibula, respectively. Scale bars = 1 mm. (C, D) Representative 2D maps of transverse cross sections through (C) the thigh at the level of 10% of the total femur length proximal to the knee and (D) the leg at 10% of the total tibial length distal to the knee. The bone is indicated in gray and the superimposed periosteal innervation patterns are distinguished by pattern‐fill and are color‐coded to the interfacing muscle group indicated by the key. Detailed maps including labels of individual muscles are available in the atlases (Supplemental Files A–D). (E, F) Three‐dimensional periosteal innervation maps overlaid on the lateral, posterior, medial, and anterior aspects of the μCT‐rendered (E) femur and (F) tibia.
Fig 5
Fig 5
Specialized mechanoreceptor endings are associated with the skeleton of the forearm and lower leg. (A) Schematic of major nerve branches in the forearm overlaid on a 3D‐rendered μCT scan of the radius–ulna. Scale bar = 1 mm. (B) Light‐sheet image of a cleared forearm from an adult Schwann cell reporter mouse (P0‐tdTomato) revealing the ulnar nerve (filled arrowhead) and median nerve (empty arrowhead) and the distribution of Pacinian corpuscles on the ulnar surface. (C) High‐magnification, intensity‐pseudocolored image of the boxed region in B. Scale bar = 200 μm. (D) Drawing of a Pacinian corpuscle demonstrating the lamellar structure derived from Schwann cells surrounding a single unmyelinated ending of a large, myelinated sensory axon. (E) Representative confocal micrograph through a 100‐μm‐thick transverse cross section through the radius (R) and ulna (U) and surrounding musculature visualized by DAPI (blue) and NF200 (green) immunolabeling at 60% of the ulnar length. Scale bar = 200 μm. (F) High magnification of the corpuscles (arrowheads) on the lateral aspect of the ulna of the boxed region indicated in E. (G) Representative confocal projection of a 50‐μm‐thick transverse cross section of a tibia from a Baf53b‐tdTomato (green) reporter mouse with immunolabeling CGRP+ axons (magenta) along with DAPI staining (blue) at 60% of the tibial length distal to the knee. Scale bar = 200 μm. (H) High magnification of the Pacinian corpuscles on the posterior aspect of the tibia of the boxed region indicated in G. (I) 2D map corresponding to the confocal image in G indicating the location of Pacinian corpuscles found in all strains and sexes at this level of the tibia. Additional information can be found in the supplemental tibial atlases (Supplemental Files C, D).
Fig 6
Fig 6
Mouse limb atlases—guide for use. (A) The four supplemental atlases comprise systematic analyses of serial, transverse cross sections down the length of the femur and tibia in B6 and C3H mice, where each page details a section of the bone at a particular percent distance from the knee. This includes (B) representative confocal projections of immunohistochemically labeled CGRP+ sensory and TH+ sympathetic nerve fibers, along with perilipin+ adipocytes and DAPI‐stained nuclei, in and around the bone and (C) corresponding bone‐masked, axon‐traced overlays to highlight and visualize the neuroskeletal features. (D) In addition, the atlas contains 2D reference maps with pattern‐coded periosteal innervation patterns superimposed on the bone interface and related to color‐coded muscle groups and individual muscle identities. (E) Lastly, these 2D maps served as the basis for 3D mapping of periosteal innervation patterns and color‐coded muscle groups onto the lateral, posterior, medial, and anterior aspects of the corresponding bone. (F) Instructions for accessing interactive features are located at the bottom of the page, such as displaying innervation pattern legend, muscle group color legend, and full muscle identifiers, or toggling through confocal channels.

References

    1. Brazill JM, Beeve AT, Craft CS, Ivanusic JJ, Scheller EL. Nerves in bone: evolving concepts in pain and anabolism. J Bone Miner Res. 2019;34(8):1393‐1406. - PMC - PubMed
    1. O'Neill TW, Felson DT. Mechanisms of osteoarthritis (OA) pain. Curr Osteoporos Rep. 2018;16(5):611‐616. - PMC - PubMed
    1. Ivanusic JJ. Molecular mechanisms that contribute to bone marrow pain. Front Neurol. 2017;8:458. - PMC - PubMed
    1. Mantyh PW. The neurobiology of skeletal pain. Eur J Neurosci. 2014;39(3):508‐519. - PMC - PubMed
    1. Sayilekshmy M, Hansen RB, Delaissé J‐M, Rolighed L, Andersen TL, Heegaard A‐M. Innervation is higher above bone remodeling surfaces and in cortical pores in human bone: lessons from patients with primary hyperparathyroidism. Sci Rep. 2019;9(1):5361. - PMC - PubMed

Publication types