. 2021 Jun;9(2):521-532.
doi: 10.1002/iid3.412. Epub 2021 Feb 16.

Cathepsin K maintains the compartment of bone marrow T lymphocytes in vivo

Affiliations

Cathepsin K maintains the compartment of bone marrow T lymphocytes in vivo

Renate Hausinger et al. Immun Inflamm Dis. 2021 Jun.

Abstract

In this study, we investigated the influence of the loss of cathepsin K (Ctsk) gene on the hematopoietic system in vitro and in vivo. We found that cultures with lineage- SCA1+ KIT+ (LSK) cells on Ctsk deficient stromal cells display reduced colony formation and proliferation, with increased differentiation, giving rise to repopulating cells with reduced ability to repopulate the donor LSKs and T cell compartments in the bone marrow (BM). Subsequent in vivo experiments showed impairment of lymphocyte numbers, but, gross effects on early hematopoiesis or myelopoiesis were not found. Most consistently in in vivo experimental settings, we found a significant reduction of (donor) T cell numbers in the BM. Lymphocyte deregulation is also found in transplantation experiments, which revealed that Ctsk is required for optimal regeneration of small populations of T cells, particularly in the BM, but also of thymic B cells. Interestingly, cell nonautonomous Ctsk regulates both B and T cell numbers, but T cell numbers in the BM require an additional autonomous Ctsk-dependent process. Thus, we show that Ctsk is required for the maintenance of hematopoietic stem cells in vitro, but in vivo, Ctsk deficiency most strongly affects lymphocyte homeostasis, particularly of T cells in the BM.

Keywords: CTSK; cathepsin; cathepsin K; hematopoietic stem cells; lymphopoiesis; marrow; microenvironment; niche; stem cells.


Figures

Figure 1
Figure 1
In vitro experiments with UG26‐1B6‐pLKO.1 and ‐shCtsk knockdown stromal cells. (A) Relative mRNA level, measured by real‐time PCR (n = 3) using Ythdf1 as housekeeping gene, comparing the relative expression of Ctsk in the knockdown clone of the UG26‐1B6 (shCtsk2 and shCtsk4) cells and in the pLKO.1 empty vector control. ShCtsk2 was used in the follow‐up experiments, unless otherwise indicated. (B) Western Blot showing the relative CTSK protein content to ß‐ actin in UG26‐1B6‐pLKO.1 and ‐shCtsk2 cells (n = 3, quantified by ImageJ). (C) Coculture of 10,000 Lin BM cells on irradiated shCtsk and pLKO.1 stromal cells in 10 cm2 round dishes for 4 weeks (n = 6). After culture, the cells were seeded in methylcellulose and the colonies were counted after 10 days under the microscope. (D) Experimental design of single cell experiments: conditioned medium was generated as described in the Section 2. Single FACS‐sorted CD34 SLAM cells from the BM were sorted in 96‐well plates with pLKO.1 and shCtsk2 and shCtsk4 CM supplemented with SCF and IL‐11 and every 24 h microscopically evaluated for cell number. After 5 days (d1–d5), the clones were harvested and analyzed using flow cytometry (n = 2). (E) Mean clone size of CD34 SLAM cells cultured with pLKO.1 and shCtsk CM. Shown are the results of four independent experiments. (F) Heat map of a representative experiment showing increase in the number of cells of single clones colored by number of divisions. (G) Content of LSK and MP cells per cultured plate. Cells from all wells were pooled and stained for lineage markers (CD45R[B220], CD4, CD8a, CD11b, and Gr1), SCA1 and KIT. Flow cytometry was performed using a CyAn ADP (Beckman Coulter), and the analyses were performed using FlowJo software. Shown are the mean results ± SEM of two independent single cell experiments, each with three 96‐well plates (CD34 SLAM cells from separate mice) per condition. *p < .05 using Mann–Whitney U test. Open symbols: cultures with control (pLKO) stroma or CM, closed symbols: cultures with shCtsk stroma or CM. CM, conditioned medium; IL, interleukin; mRNA, messenger RNA
Figure 2
Figure 2
Maintenance of repopulating activity in cocultures of HSCs and UG26‐1B6‐pLKO.1 and ‐shCtsk knockdown stromal cells. (A) Experimental design of coculture transplant experiments: 10,000 Lin cells were cocultured on irradiated stromal cells for 3 weeks and then transplanted into lethally irradiated mice (two independent experiments totaling UG26‐1B6‐pLKO: n = 7; UG26‐1B6‐shCtsk: n = 6 recipient mice) (B) Flow cytometric analysis of PB, 16 weeks posttransplantation, showing the level of donor engraftment as percentage. (C) Flow cytometric analysis of BM, 16 weeks posttransplantation, showing percentages of donor‐derived mature and (D) early stage hematopoietic cells. Flow cytometry was performed using an EPICS XL (Beckman Coulter), and the analyses were performed using FlowJo software. Shown are the mean results ± SEM. *p < .05 using nonparametric Mann–Whitney U test. Open bars: cocultures on control stroma; closed bars: cocultures on shCtsk stroma. BM, bone marrow; PB, peripheral blood
Figure 3
Figure 3
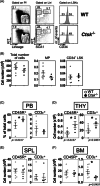
Effects of Ctsk loss on steady‐state hematopoiesis. (A) Representative contour plots of the BM stem and progenitor cells from the BM of WT and Ctsk −/− mice. (B) Absolute numbers of cells, myeloid progenitors, and CD34 LSK cells in the BM of WT and Ctsk −/− mice. (C) Percentages of B and T lymphocytes in the PB, and (D) absolute numbers of B and T cells in the THY, (E) SPL, and (F) BM. The data represents results of two to three independent experiments. In (B–E) each dot represents one animal. All flow cytometry was performed using a CyAn ADP (Beckman Coulter), and the analyses were performed using FlowJo software. In each graph, results from individual mice are shown as open (WT control mice) or closed (Ctsk −/− mice) symbols, as well as the mean results ± SEM. *p < .05 using the Mann–Whitney U test. BM, bone marrow; PB, peripheral blood; SPL, spleen; THY, thymus
Figure 4
Figure 4
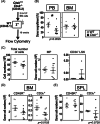
Role of extrinsic Ctsk for regeneration of WT HSCs. (A) Experimental design. WT Lin cells from congenic CD45.1 mice were transplanted into primary (1°) CD45.2 Ctsk −/− mice and their WT littermates. Donor cells were analyzed 16 weeks posttransplantation. (B) Percentage of donor engraftment in the PB. (C) Representative contour plots of the BM stem and progenitor cells. (D) Absolute numbers of MPs and CD34 LSKs in the BM from the extrinsic transplant recipients. (E) Absolute numbers of B and T lymphocytes in the BM, (F) SPL, (G) THY, and (H) SPL. Results of two or three independent experiments are shown. (B and D–G), Each dot plot represents one animal. All flow cytometry was performed using a CyAn ADP (Beckman Coulter), and the analyses were performed using FlowJo software. In each graph, results from individual mice are shown as open (WT control recipients) or closed (Ctsk −/− recipients) symbols, as well as the mean results ± SEM. *p < .05 statistically significant using Mann–Whitney U test. BM, bone marrow; HSC, hematopoietic stem cell; PB, peripheral blood; SPL, spleen; THY, thymus
Figure 5
Figure 5
Repopulation capacity of Ctsk −/− HSCs. (A) Experimental design. CD45.2 BM cells from Ctsk −/− and WT control littermates were transplanted into primary (1°) CD45.1 WT recipient mice and analyzed 16 weeks posttransplantation. (B) Percentage of donor engraftment in PB, and BM. (C) Absolute numbers of donor cells, MPs, and CD34 LSKs in the BM of recipient mice. Absolute numbers of donor B and T cells in the BM (D) and SPL (E). The results of two independent experiments are shown. (B–E), Each dot represents one animal. All flow cytometry was performed using a Cyan ADP (Beckman‐Coulter), and the analyses were performed using FlowJo software. In each graph, results from individual mice are shown as open (WT control donors) or closed (Ctsk −/− donors) symbols, as well as the mean results ± SEM. *p < .05 statistically significant difference between control and Ctsk −/− donor cells in WT recipients using Mann–Whitney U test. BM, bone marrow; HSC, hematopoietic stem cell; PB, peripheral blood; SPL, spleen; THY, thymus

References

    1. Saw S, Weiss A, Khokha R, Waterhouse PD. Metalloproteases: On the Watch in the Hematopoietic Niche. Trends Immunol. Nov 2019;40(11):1053‐1070. 10.1016/j.it.2019.09.006 - DOI - PubMed
    1. Klein G, Schmal O, Aicher WK. Matrix metalloproteinases in stem cell mobilization. Matrix Biol. May‐Jul 2015;44‐46:175‐183. 10.1016/j.matbio.2015.01.011 - DOI - PubMed
    1. Kollet O, Dar A, Shivtiel S, et al. Osteoclasts degrade endosteal components and promote mobilization of hematopoietic progenitor cells. Nat Med. Jun 2006;12(6):657‐664. 10.1038/nm1417 - DOI - PubMed
    1. Bossard MJ, Tomaszek TA, Thompson SK, et al. Proteolytic activity of human osteoclast cathepsin K. Expression, purification, activation, and substrate identification. J Biol Chem. May 24 1996;271(21):12517‐12524. 10.1074/jbc.271.21.12517 - DOI - PubMed
    1. Xue Y, Cai T, Shi S, et al. Clinical and animal research findings in pycnodysostosis and gene mutations of cathepsin K from 1996 to 2011. Orphanet J Rare Dis. May 10 2011;6:20. 10.1186/1750-1172-6-20 - DOI - PMC - PubMed

Publication types

LinkOut - more resources