. 2021 Mar 2;33(3):598-614.e7.
doi: 10.1016/j.cmet.2021.01.013. Epub 2021 Feb 15.

A cold-stress-inducible PERK/OGT axis controls TOM70-assisted mitochondrial protein import and cristae formation

Affiliations

A cold-stress-inducible PERK/OGT axis controls TOM70-assisted mitochondrial protein import and cristae formation

Pedro Latorre-Muro et al. Cell Metab. .

Abstract

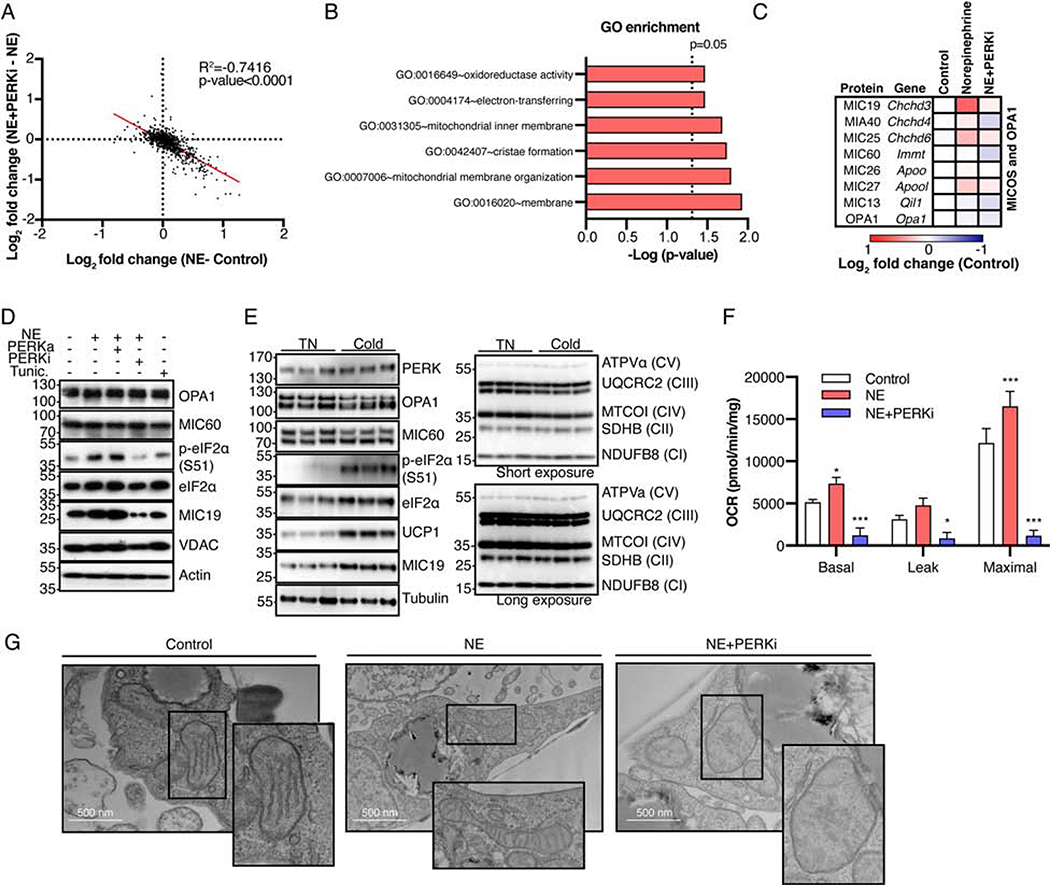
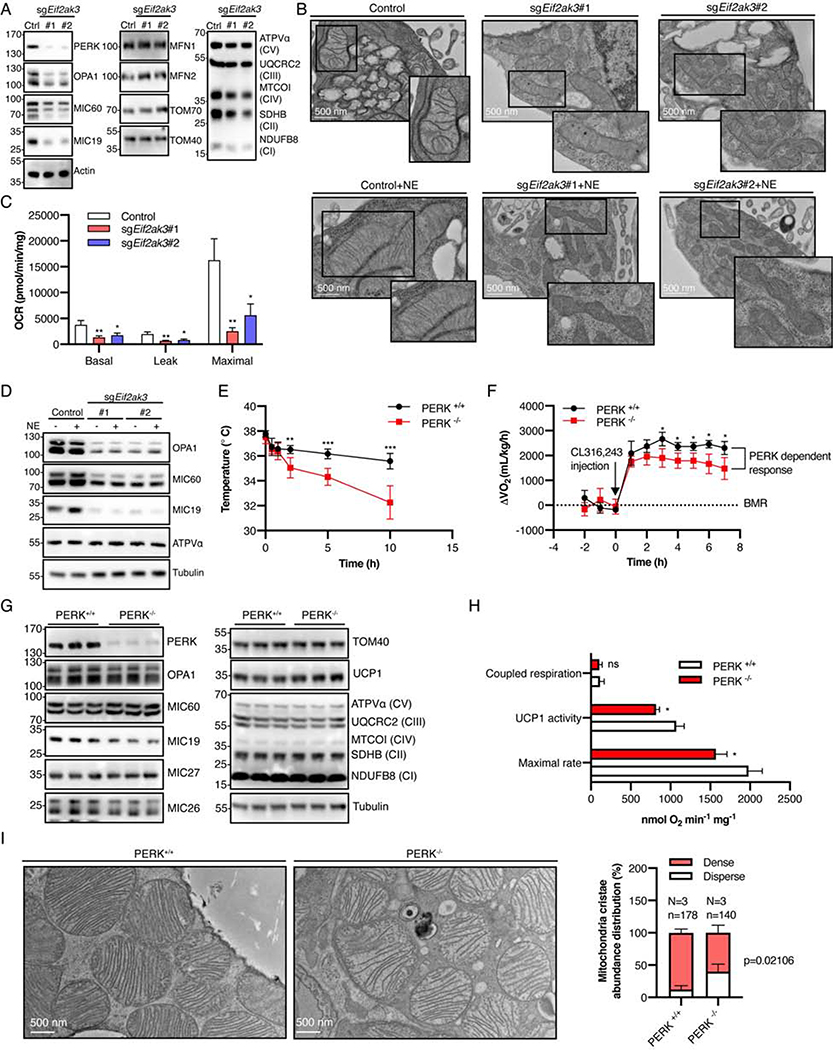
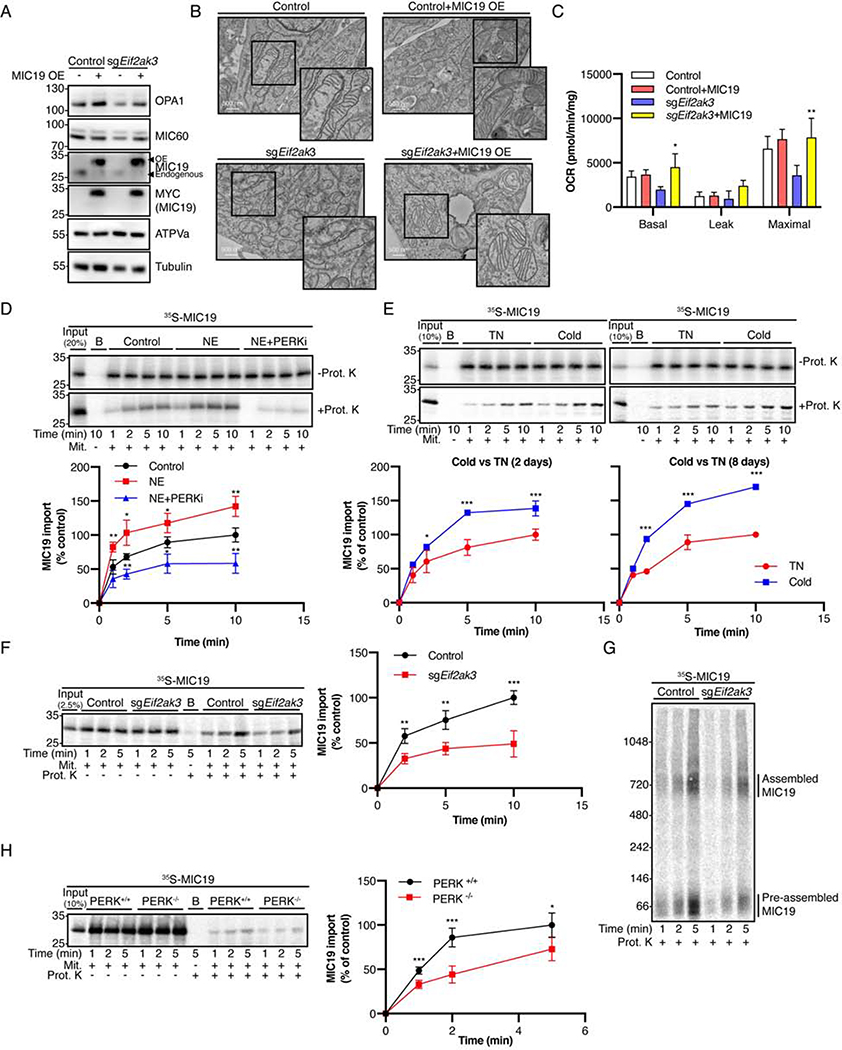
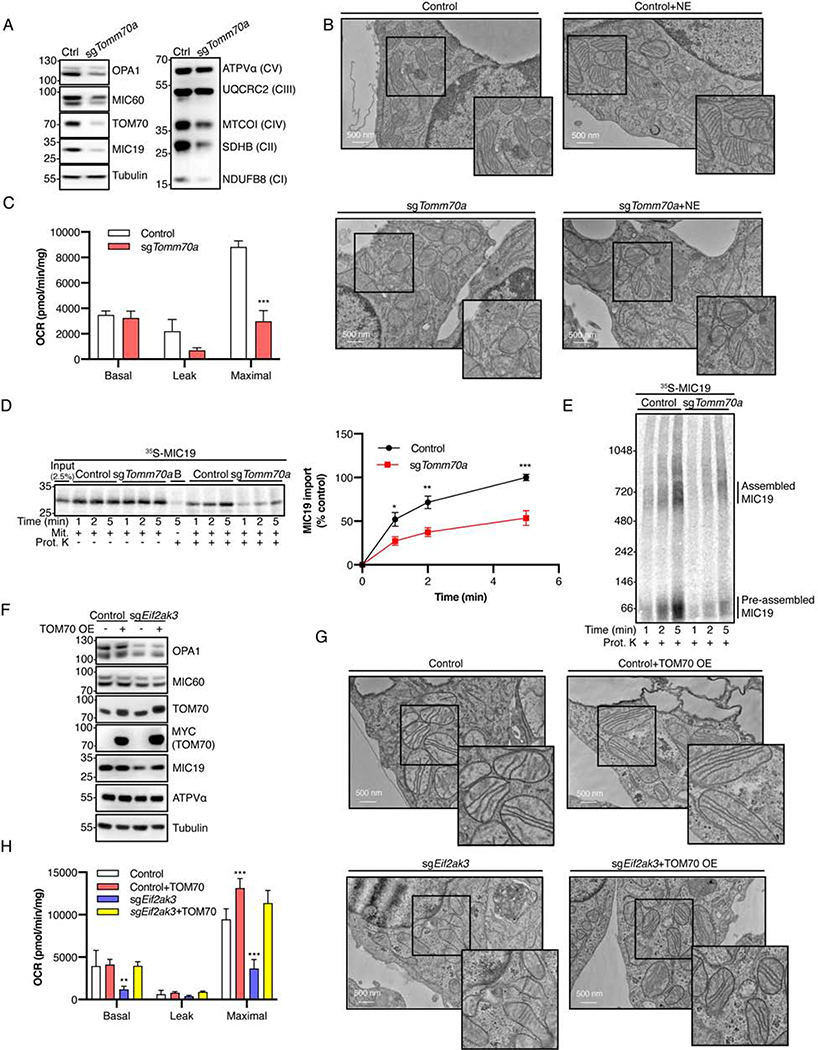
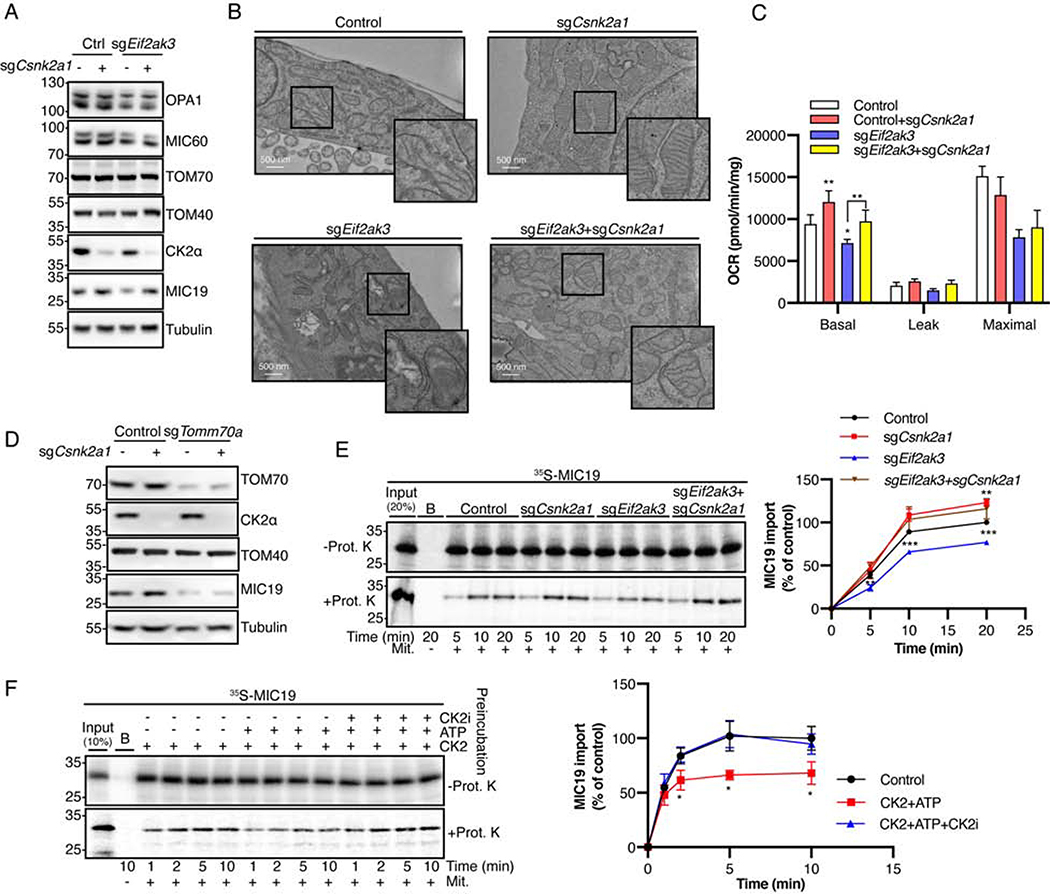
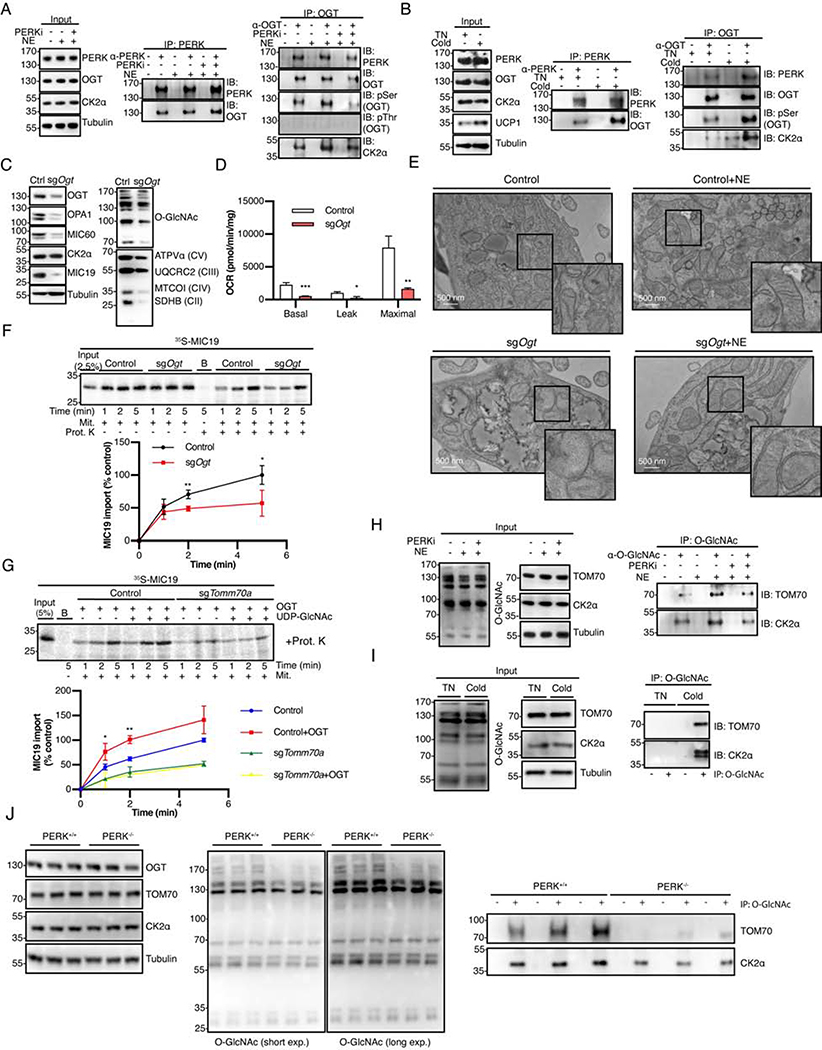
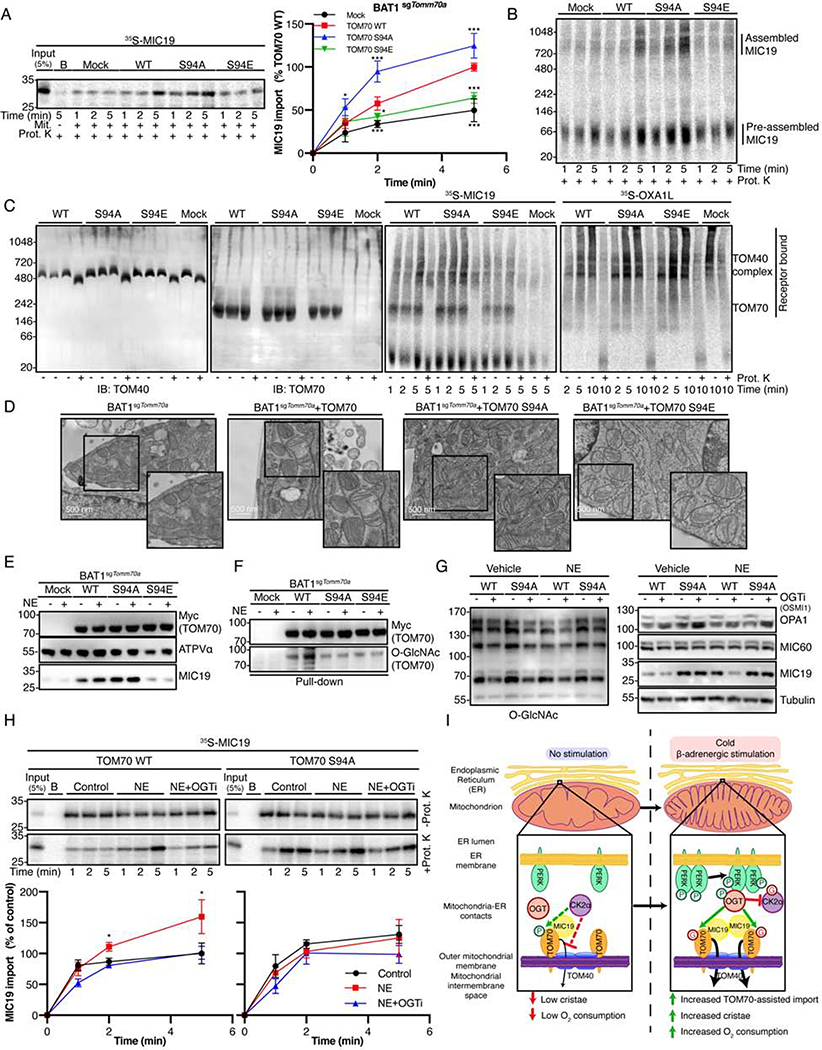
The architecture of cristae provides a spatial mitochondrial organization that contains functional respiratory complexes. Several protein components including OPA1 and MICOS complex subunits organize cristae structure, but upstream regulatory mechanisms are largely unknown. Here, in vivo and in vitro reconstitution experiments show that the endoplasmic reticulum (ER) kinase PERK promotes cristae formation by increasing TOM70-assisted mitochondrial import of MIC19, a critical subunit of the MICOS complex. Cold stress or β-adrenergic stimulation activates PERK that phosphorylates O-linked N-acetylglucosamine transferase (OGT). Phosphorylated OGT glycosylates TOM70 on Ser94, enhancing MIC19 protein import into mitochondria and promoting cristae formation and respiration. In addition, PERK-activated OGT O-GlcNAcylates and attenuates CK2α activity, which mediates TOM70 Ser94 phosphorylation and decreases MIC19 mitochondrial protein import. We have identified a cold-stress inter-organelle PERK-OGT-TOM70 axis that increases cell respiration through mitochondrial protein import and subsequent cristae formation. These studies have significant implications in cellular bioenergetics and adaptations to stress conditions.

Keywords: MIC19; PERK-OGT axis; TOM70; brown adipocytes; cold stress; cristae biogenesis; mitochondrial protein import; respiration.


Conflict of interest statement

Declaration of interests The authors declare no competing interests.

Figures

Figure 1.
Figure 1.. PERK controls cristae formation and respiration in norepinephrine stimulated cells.
(A) Graphical representation of Log2 fold change of NE vs control conditions and NE+PERKi vs. NE conditions from proteomics data depicting the correlation between PERK activity and mitochondrial proteome remodeling. Lower right panel in the graph represents proteins upregulated by NE (x-axis) whose induction is blunted by PERK inhibition (y-axis). (B) Gene Ontology (GO) enrichment from proteomics data described in (A). (C) Heatmap representation of the relative expression (Log2 fold change of controls) of MICOS and OPA1 proteins determined by mitochondrial proteomics from BAT1 cells described in (A). (D) Protein levels for cristae markers OPA1, MIC60 and MIC19 in BAT1 cells exposed to norepinephrine (NE), PERK activator (PERKa) and inhibitor (PERKi) or tunicamycin (Tunic.) and (E) in interscapular brown adipose tissue (iBAT) from cold and thermoneutral (TN) exposed mice (one animal per lane, 1 week exposure). (F) Analysis of oxygen consumption rates in BAT1 cells exposed to vehicle, NE or NE+PERKi (mean±SD, n=4, * p<0.05, *** p<0.001). Statistical differences compared to controls are represented. (G) Mitochondria morphology and cristae abundance determined by electron microscopy (EM) in control, NE and NE+PERKi treated BAT1 cells.
Figure 2.
Figure 2.. Loss of PERK activity impairs cell respiration and cristae formation in vitro and in vivo.
(A) OPA1, MIC60 and MIC19 protein levels in control and PERK depleted (sgEif2ak3#1 and sgEif2ak3#2) cells. TOM40, TOM70, MFN1 and MFN2 represent outer mitochondrial membrane controls. (B) Mitochondria morphology and cristae abundance determined by EM in control and PERK depleted cells (sgEif2ak3#1 and sgEif2ak3#2) untreated or treated with norepinephrine (NE). (C) Oxygen consumption rates by Seahorse experiments in cells described in (A) (mean±SD, n=3, *p<0.05, ** p<0.01) Statistical differences compared to controls are represented. (D) Relative levels of MIC19, MIC60 and OPA1 in control and PERK (sgEif2ak3) depleted cells upon NE stimulation. (E) Rectal temperature at different time points upon cold exposure in adipose tissue specific PERK KO mice (PERK−/−, n=5) and controls (PERK+/+, n=6). (F) Increment in oxygen consumption (ΔVO2) upon CL316,243 stimulation in mice housed at 30° C (n=3 PERK+/+ and n=4 PERK−/−, BMR= Basal metabolic rate). (G) Relative levels of several cristae markers in interscapular brown adipose tissue (iBAT) from cold acclimated control (PERK+/+) and PERK KO (PERK−/−) mice (one animal per lane). (H) Determination of respiratory capacity in isolated iBAT mitochondria from cold acclimated control (PERK+/+) and PERK KO (PERK−/−) mice. Pyruvate and malate were used as substrates. Maximal rate indicates the highest oxygen consumption rate upon substrate addition. Oxygen consumption rates for UCP1-dependent and coupled respiration were calculated (*p<0.05, n=3 PERK−/−, n=2 PERK+/+) (see Figures S2G and S2H). (I) Mitochondria morphology and cristae abundance determined by EM in iBAT from cold acclimated control (PERK+/+) and PERK KO (PERK−/−) mice. Disperse cristae were defined as the 10th percentile of controls (PERK+/+). Mitochondria (n) from three mice (N) each group were analyzed. Statistics were obtained using N=3.
Figure 3.
Figure 3.. PERK controls mitochondrial protein import of MIC19.
(A) Overexpression of MIC19 in control and PERK depleted cells (sgEif2ak3) cells. (B) Mitochondria morphology and cristae abundance in cells described in (A). (C) Oxygen consumption rates in cells described in (A) (mean±SD, n=3, *p<0.05, **p<0.01, differences between sgEif2ak3 and sgEif2ak3+MIC19 are represented). (D) In vitro protein import of MIC19 using isolated mitochondria from cells exposed to vehicle (control), norepinephrine (NE) and norepinephrine+PERK inhibitor (NE+PERKi) (mean±SD, n=4, * p<0.05, ** p<0.01). (E) In vitro import of MIC19 in brown fat mitochondria from mice exposed to cold or thermoneutral (TN) conditions for different times (mean±SD, n=3, * p<0.05, *** p<0.001). (F) In vitro import of MIC19 using mitochondria from PERK depleted (sgEif2ak3) cells (mean±SD, n=4, ** p<0.01, *** p<0.001). 10% of proteinase K minus samples (-Prot. K) was loaded. Proteinase K (+Prot. K) was used to remove non-imported precursors as indicated. B=blank tube contained only 35S labeled protein. Graph represents MIC19 import from proteinase K (+Prot. K) treated conditions. (G) Assembly of imported MIC19 into mitochondrial complexes from the conditions described in (F) determined by Blue Native (BN) PAGE. (H) In vitro import of MIC19 into isolated iBAT mitochondria from cold acclimated control (PERK+/+) and PERK KO (PERK−/−) mice (n=5 mice each group, * p<0.05, *** p<0.001). In D-F and H, B=blank tube contained only 35S labeled protein. Mit.=Mitochondria. Samples, including blank, were all incubated with proteinase K (+Prot. K).
Figure 4.
Figure 4.. TOM70 assists the mitochondrial import of MIC19 protein.
(A) Protein levels of cristae markers and OXPHOS proteins in TOM70 depleted BAT1 (BAT1sgTomm70a) cells. (B) Mitochondria morphology and cristae abundance determined by EM in differentiated TOM70 depleted (BAT1sgTomm70a) cells with or without NE stimulation. (C) Oxygen consumption rates measured using Seahorse assays in control and BAT1sgTomm70a cells (mean±SD, n=3, ** p<0.01, *** p<0.001). (D) In vitro import assay of MIC19 using mitochondria purified from control and TOM70 (sgTomm70a) depleted cells (mean±SD, n=4, *** p<0.001). B=blank tube containing only 35S labeled protein. Mit.=Mitochondria. Proteinase K (+Prot. K) was added to remove non-imported precursors. 10% of proteinase K minus samples (-Prot. K) was loaded. (E) Assembly of imported MIC19 into mitochondrial complexes determined by BN-PAGE under the conditions described in (D). (F) Protein levels of different mitochondrial cristae markers upon ectopic expression of TOM70 in the context of PERK suppression (sgEif2ak3). (G) Mitochondria morphology and cristae abundance using EM under the conditions described in (F). (H) Oxygen consumption rates measured using Seahorse under the conditions described in (F) (n=3, * p<0.05, ** p<0.01, differences compared to controls are represented).
Figure 5.
Figure 5.. CK2α activity represses MIC19 protein import into the mitochondria.
(A) Levels of OPA1, MIC60 and MIC19 proteins in the context of PERK (BAT1sgEif2ak3) and/or CK2α (BAT1sgCsnk2a1 or BAT1sgEif2ak3/sgCsnk2a1) suppression. (B) Mitochondria morphology and cristae abundance determined by EM analysis and (C) Oxygen consumption rates in cells described in (A) (mean±SD, n=5, * p<0.05, ** p<0.01). Differences compared to control are shown. (D) MIC19 protein levels in the context of BAT1sgTomm70a cells and CK2α suppression (sgCsnk2a1). (E) In vitro import of MIC19 using mitochondria purified from cells described in (A) (mean±SD, n=3, ** p<0.01, *** p<0.001, differences compared to controls are represented). (F) In vitro import of MIC19 into isolated mitochondria from BAT1 cells preincubated with recombinant CK2. ATP and CK2 inhibitor (CX4945, 10μM) were used as indicated (mean±SD, n=3, * p<0.05). In E-F, B=blank tube containing only 35S labeled protein. Mit.=Mitochondria. Proteinase K (+Prot. K) was added to remove non-imported precursors.
Figure 6.
Figure 6.. PERK signals to OGT to control MIC19 mitochondrial protein import and cristae formation.
(A and B) Immunoprecipitation analysis to determine PERK-OGT and OGT-CK2α protein-protein interactions in norepinephrine stimulated cells or cold-exposed mouse brown fat. In B, a pool of iBAT extracts from 4 mice was used. (C) Levels of cristae markers, OXPHOS proteins and global glycosylation determined by western blot in OGT downregulated (BAT1sgOgt) cells. (D) Oxygen consumption rates in BAT1sgOgt cells (mean±SD, n=3, * p<0.05, ** p<0.01, *** p<0.001). (E) Mitochondria morphology and cristae abundance determined by EM in control and BAT1sgOgt (sgOgt) cells exposed to either vehicle or NE. (F) In vitro import of MIC19 using mitochondria purified from BAT1sgOgt cells (mean±SD, n=3, * p<0.05, ** p<0.01). 10% of proteinase K minus samples (-Prot. K) was loaded. (G) In vitro import of MIC19 using isolated mitochondria from control or BAT1sgTomm70a cells preincubated with recombinant OGT and UDP-GlcNAc substrate as indicated (mean±SD, n=3, * p<0.05, ** p<0.01, differences between OGT treatment vs. respective controls (Control or sgTomm70a) are represented. In F and G, B=blank tube containing only 35S labeled protein. Mit.=Mitochondria. Proteinase K (+Prot. K) was added to remove non-imported precursors. (H) Glycosylation levels of CK2α and TOM70 determined by immunoprecipitations against the O-GlcNAc antigen using differentiated BAT1 cells exposed to vehicle (Control), norepinephrine (NE) and NE+PERK inhibitor (NE+PERKi). (I) Same approach as described in (H) performed in iBAT from mice exposed to thermoneutrality (TN) or cold. A pool of brown adipose tissue extracts from 4 mice was used. (J) Same approach as described in (H) performed in iBAT from cold acclimated control (PERK+/+) and PERK KO (PERK−/−) mice (one animal per lane).
Figure 7.
Figure 7.. An interplay between phosphorylation and glycosylation controls TOM70-assited MIC19 mitochondrial protein import.
(A) In vitro import of MIC19 using isolated mitochondria expressing different TOM70 mutants in the context of BATsgTomm70a cells (Mock). B=blank tube containing only 35S labeled protein. Mit=Mitochondria. Proteinase K (+Prot. K) was added to remove non-imported precursors. Graph represents quantification of in vitro MIC19 protein import under these conditions (mean±SD, n=4, * p<0.05, *** p<0.001, differences compared to TOM70 WT are represented). (B) In vitro assembly of MIC19 into mitochondrial complexes determined by BN-PAGE under the conditions described in (A). (C) Binding of MIC19 or OXA1L to TOM40 complex and TOM70 receptor using different TOM70 mutants in the background of sgTomm70a cells (Mock) and ATP depleted conditions. Immunoblots against TOM40 and TOM70 are shown on the left. (D) Mitochondria morphology and cristae abundance determined by EM using differentiated BAT1 cells described in Figures 7A and S7A. (E) Levels of MIC19 protein in isolated mitochondria from BAT1 cells expressing different TOM70 Ser94 mutant alleles in the presence or the absence of NE. (F) Pull-down of TOM70 from samples described in (E) and analysis of glycosylation levels. (G) Levels of different cristae markers upon NE stimulation in cells ectopically expressing TOM70 WT and S94A mutant. (H) In vitro import of MIC19 using isolated mitochondria expressing TOM70 WT or S94A mutant. Mitochondria were isolated from cells stimulated with NE or NE and OGT inhibitor (OGTi) as indicated. B=blank tube containing only 35S labeled protein. Mit.=Mitochondria. Proteinase K (+Prot. K) was added to remove non-imported precursors. Graph represents quantification of in vitro MIC19 protein import under these conditions (mean±SD, n=3, * p<0.05, differences compared to each control condition are represented). (I) Graphical representation of the proposed model whereby PERK controls cristae formation by promoting TOM70-assisted translocation of MIC19 into the mitochondrial intermembrane space.

Similar articles

Cited by

References

    1. Abe Y, Shodai T, Muto T, Mihara K, Torii H, Nishikawa S. ichi, Endo T, and Kohda D (2000). Structural basis of presequence recognition by the mitochondrial protein import receptor Tom20. Cell 100, 551–560. - PubMed
    1. Akabane S, Uno M, Tani N, Shimazaki S, Ebara N, Kato H, Kosako H, and Oka T (2016). PKA Regulates PINK1 Stability and Parkin Recruitment to Damaged Mitochondria through Phosphorylation of MIC60. Mol. Cell 62, 371–384. - PubMed
    1. Alcalá M, Calderon-Dominguez M, Bustos E, Ramos P, Casals N, Serra D, Viana M, and Herrero L (2017). Increased inflammation, oxidative stress and mitochondrial respiration in brown adipose tissue from obese mice. Sci. Rep 7, 16082. - PMC - PubMed
    1. Backes S, Hess S, Boos F, Woellhaf MW, Gödel S, Jung M, Mühlhaus T, and Herrmann JM (2018). Tom70 enhances mitochondrial preprotein import efficiency by binding to internal targeting sequences. J. Cell Biol. 217, 1369–1382. - PMC - PubMed
    1. Bal NC, Singh S, Reis FCG, Maurya SK, Pani S, Rowland LA, and Periasamy M (2017). Both brown adipose tissue and skeletal muscle thermogenesis processes are activated during mild to severe cold adaptation in mice. J. Biol. Chem. 292, 16616–16625. - PMC - PubMed

Publication types

MeSH terms

LinkOut - more resources