. 2021 Mar 4;184(5):1281-1298.e26.
doi: 10.1016/j.cell.2021.01.022. Epub 2021 Feb 15.

Inhibitory CD161 receptor identified in glioma-infiltrating T cells by single-cell analysis

Affiliations

Inhibitory CD161 receptor identified in glioma-infiltrating T cells by single-cell analysis

Nathan D Mathewson et al. Cell. .

Abstract

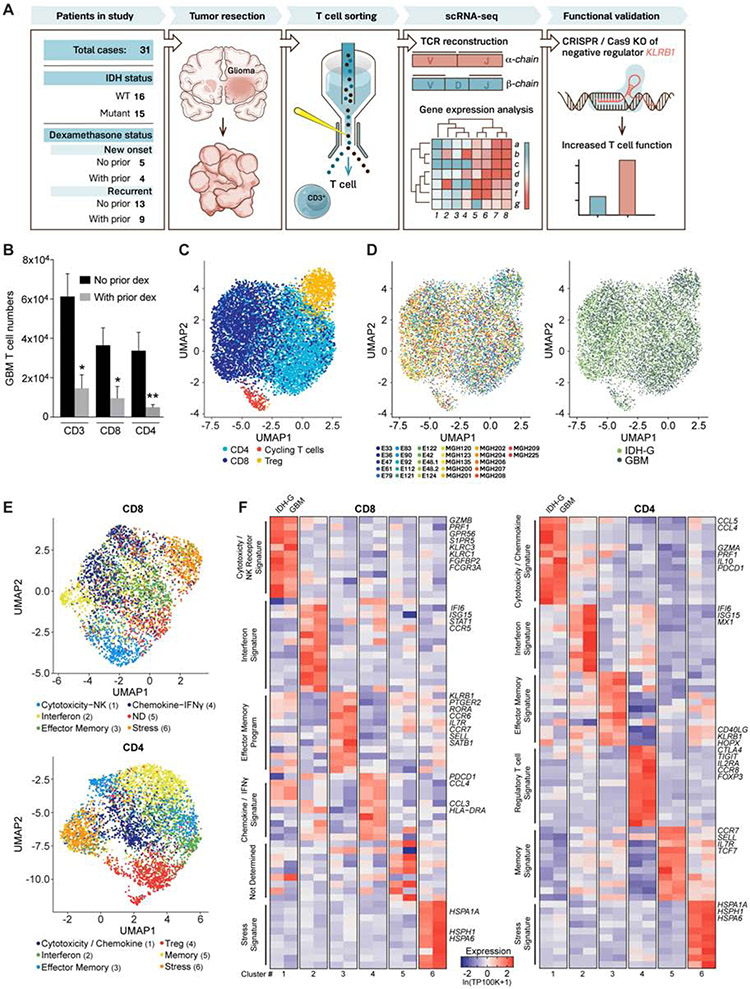
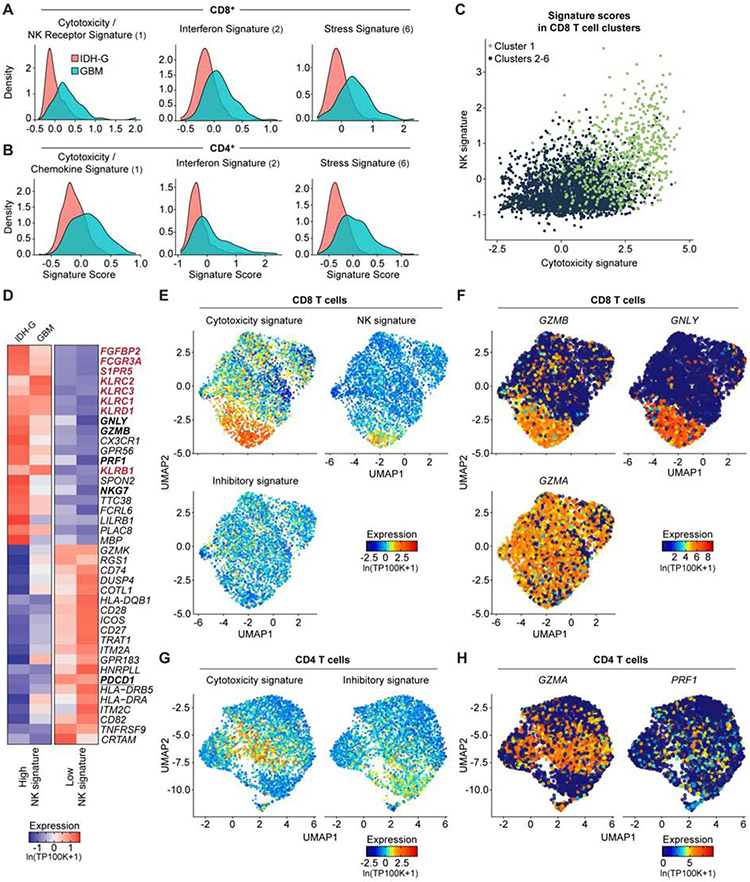
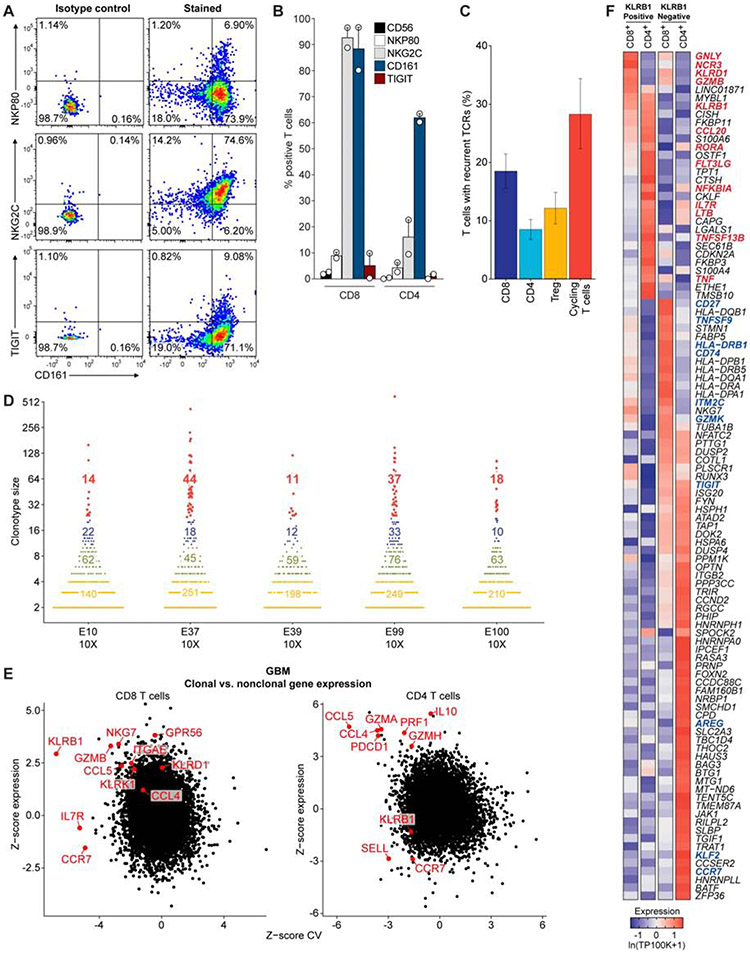
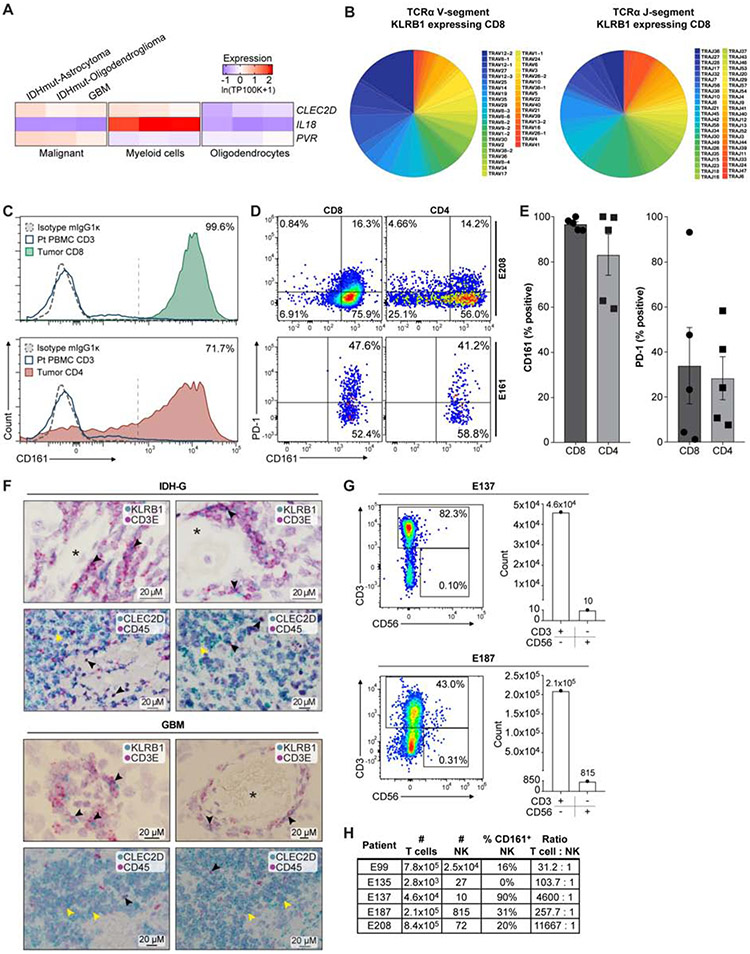
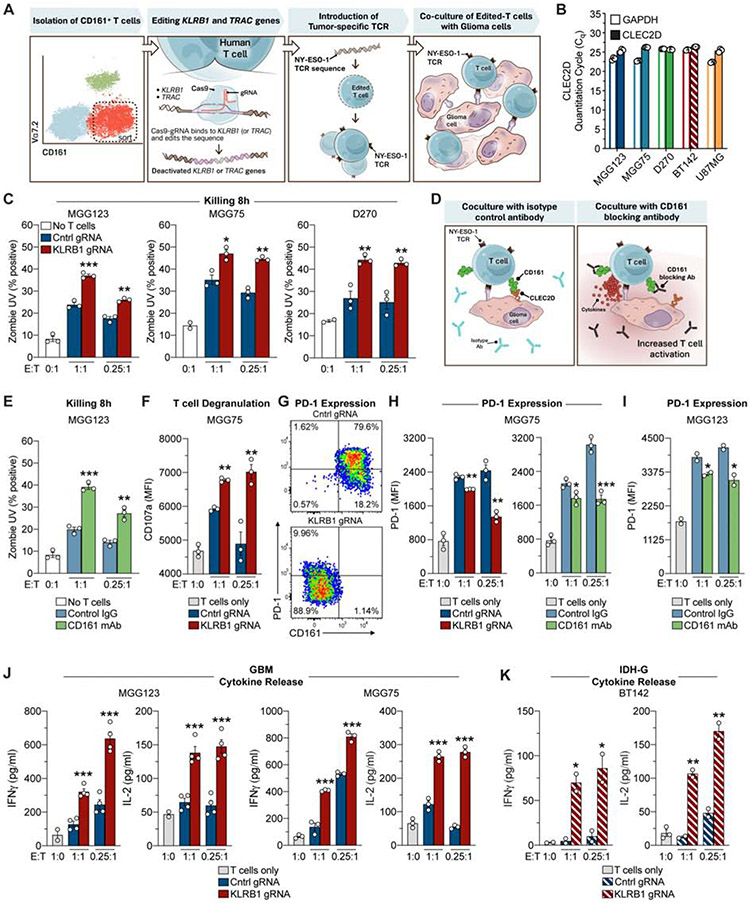
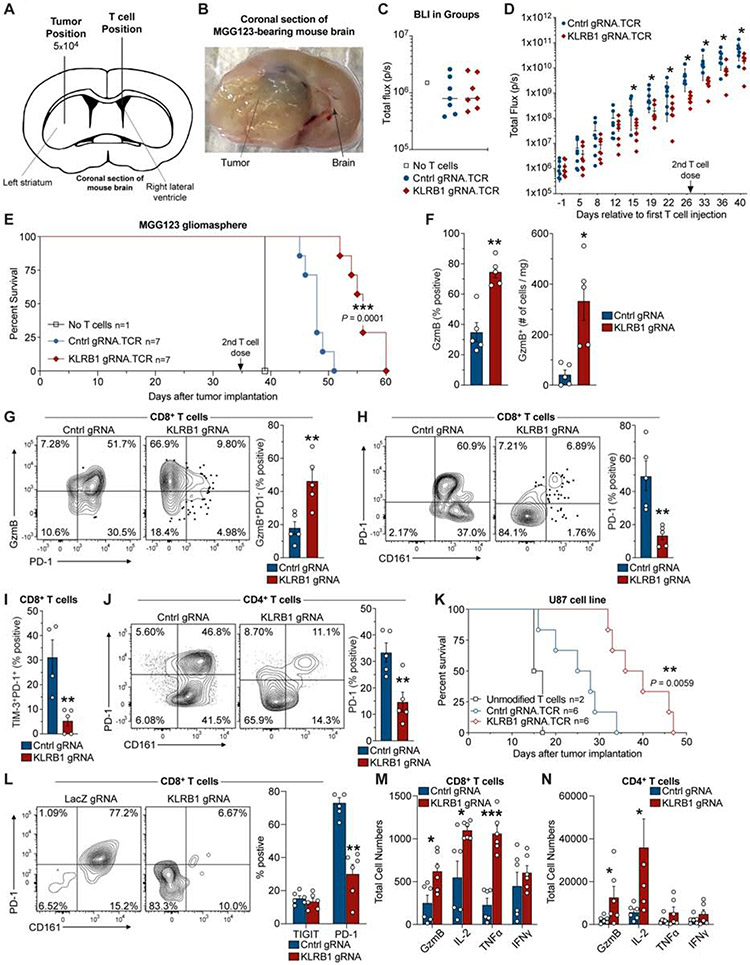
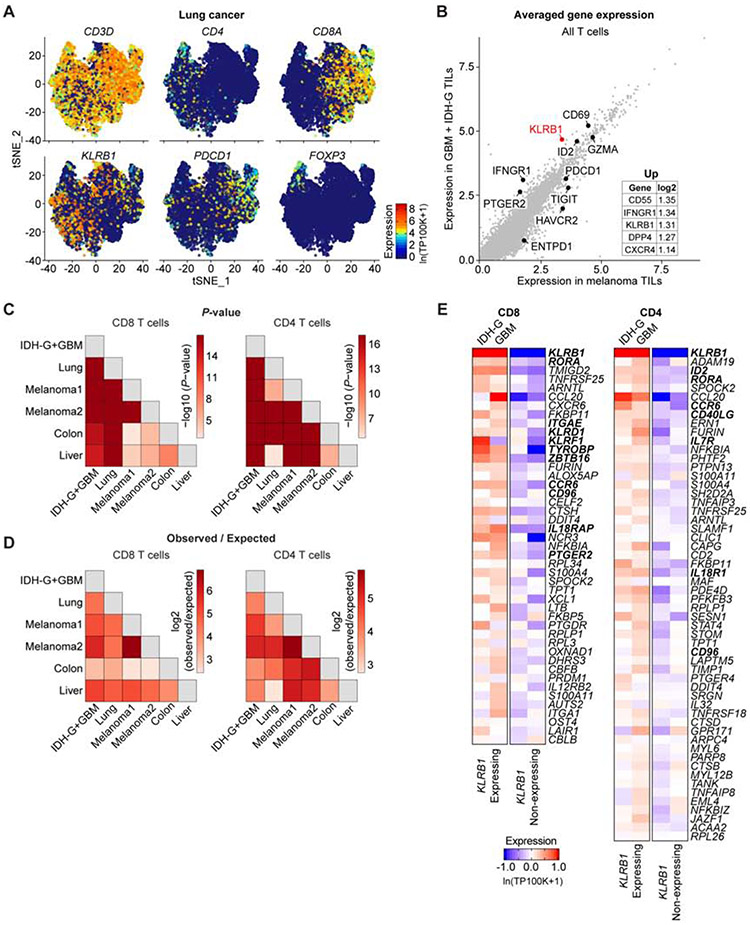
T cells are critical effectors of cancer immunotherapies, but little is known about their gene expression programs in diffuse gliomas. Here, we leverage single-cell RNA sequencing (RNA-seq) to chart the gene expression and clonal landscape of tumor-infiltrating T cells across 31 patients with isocitrate dehydrogenase (IDH) wild-type glioblastoma and IDH mutant glioma. We identify potential effectors of anti-tumor immunity in subsets of T cells that co-express cytotoxic programs and several natural killer (NK) cell genes. Analysis of clonally expanded tumor-infiltrating T cells further identifies the NK gene KLRB1 (encoding CD161) as a candidate inhibitory receptor. Accordingly, genetic inactivation of KLRB1 or antibody-mediated CD161 blockade enhances T cell-mediated killing of glioma cells in vitro and their anti-tumor function in vivo. KLRB1 and its associated transcriptional program are also expressed by substantial T cell populations in other human cancers. Our work provides an atlas of T cells in gliomas and highlights CD161 and other NK cell receptors as immunotherapy targets.

Keywords: CD161; IDH-mutant gliomas; T cells; glioblastoma; single-cell RNA-seq.


Conflict of interest statement

Declaration of interests N.D.M., O.A., I.T., A.R., M.L.S., and K.W.W. are co-inventors of a patent application on the CLEC2D-CD161 pathway for the treatment of cancer. K.W.W., M.L.S., and A.R. are co-founders of Immunitas Therapeutics. K.W.W., M.L.S., and I.T. are advisory board members of Immunitas Therapeutics. K.W.W. serves on the scientific advisory board of TCR2 Therapeutics, T-Scan Therapeutics, SQZ Biotech, and Nextechinvest and received sponsored research funding from Bristol-Myers Squibb and Novartis. A.R. is a founder and equity holder of Celsius Therapeutics, an equity holder in Immunitas Therapeutics, and until August 31, 2020, was an SAB member of Syros Pharmaceuticals, Neogene Therapeutics, Asimov, and Thermo Fisher Scientific. From August 1, 2020, A.R. is an employee of Genentech. N.D.M. serves as a scientific advisor to Immunitas Therapeutics. A.M. is cofounder, member of the Boards of Directors, and member of Scientific Advisory Boards of Spotlight Therapeutics and Arsenal Biosciences. A.M. has served as an advisor to Juno Therapeutics, was a member of the scientific advisory board at PACT Pharma, and an advisor to Trizell. A.M. has received an honorarium from Merck and a consulting fee from AlphaSights and is an investor in and informal advisor to Offline Ventures. A.M. owns stock in Arsenal Biosciences, Spotlight Therapeutics, and PACT Pharma. The Marson lab has received research support from Juno Therapeutics, Epinomics, Sanofi, GlaxoSmithKline, Gilead, and Anthem. E.A.C. is currently an advisor to Advantagene Inc., Alcyone Biosciences, Insightec, Inc., Sigilon Therepeutics, and DNAtrix Inc. and has equity interest in DNAtrix; A.M. has advised Oncorus, Merck, Tocagen, Ziopharm, Stemgen, NanoTx., Ziopharm Oncology, Cerebral Therapeutics, Genenta, Merck, Janssen, Karcinolysis, and Shanaghai Biotech and has received research support from Advantagene, NewLink Genetics, and Amgen. A.M. is a named inventor on patents related to oncolytic HSV1. D.A.R. has received research support from Acerta Phamaceuticals, Agenus, Celldex, EMD Serono, Incyte, Inovio, Midatech, Omniox, and Tragara, and he has served as paid consultant for Abbvie, Advantagene, Agenus, Amgen, Bayer, Bristol-Myers Squibb, Celldex, DelMar, EMD Serono, Genentech/Roche, Inovio, Merck, Merck KGaA, Monteris, Novocure, Oncorus, Oxigene, Regeneron, Stemline, and Taiho Oncology, Inc. P.K.B., outside the scope of this work, has consulted for Angiochem, Genentech-Roche, Lilly, Tesaro, ElevateBio, Pfizer (Array), SK Life Sciences, and Dantari and is supported by the Breast Cancer Research Foundation, Damon Runyon Cancer Research Foundation, Ben and Catherine Ivy Foundation, and the National Cancer Institute (5R01CA244975-02, 5R21CA220253-02, and 5R01CA227156-03), BMS, Lilly, and honoraria from Merck, Genentech-Roche, and Lilly. D.P.C. has consulted for Lilly and Boston Pharmaceuticals and has received honoraria and travel reimbursement from Merck. O.R.-R. is an employee of Genentech since October 2020. O.R.-R. is a co-inventor on patent applications filed by the Broad Institute for inventions relating to work in single-cell genomics, such as in PCT/US2018/060860 and US provisional application 62/745,259. E.A.C. is currently an advisor to Advantagene Inc., Alcyone Biosciences, Insightec Inc., DNAtrix, Immunomic Therapeutics, Sangamo Therapeutics, and Seneca Therapeutics, has equity interest in DNAtrix, Immunomic Therapeutics, and Seneca Therapeutics, and has also advised Oncorus, Merck, Tocagen, Ziopharm, Stemgen, NanoTx., Ziopharm Oncology, Cerebral Therapeutics, Genenta. Merck, Janssen, Karcinolysis, and Shanghai Biotech. E.A.C. has received research support from NIH, US Department of Defense, American Brain Tumor Association, National Brain Tumor Society, Alliance for Cancer Gene Therapy, Neurosurgical Research Education Foundation, Advantagene, NewLink Genetics, and Amgen and also is a named inventor on patents related to oncolytic HSV1 and noncoding RNAs. X.S.L. is a cofounder, board member, and consultant of GV20 Oncotherapy and its subsidiaries, SAB of 3DMedCare, a consultant for Genentech, a stockholder of Bristol Myers Squibb (BMY), Thermo Fisher Scientific (TMO), Walgreens Boots Alliance (WBA), Abbott Laboratories (ABT), AbbVie Inc. (ABBV), and Johnson & Johnson (JNJ), and receives research funding from Takeda and Sanofi.

Figures

Fig. 1.
Fig. 1.. Transcriptional features of glioma-infiltrating T cells.
(A) Experimental strategy. (B) Quantification of GBM infiltrating T cells from patients who did or did not receive prior dexamethasone. * P < 0.05, ** P < 0.01 (Mann-Whitney U test). Error bars denote SEM. (C) Uniform Manifold Approximation and Projection (UMAP) visualization of 8,252 T cells from 26 glioma patients colored by T cell sub-cluster. (D) UMAP representation from (C) colored based on patient ID (left) and tumor mutational status (right). (E) Sub-clustering and UMAP visualization of CD8 T cells and CD4 T cells, colored based on NMF clustering; ND – not determined. (F) Heat map showing relative expression of selected genes across glioma T cell subsets (clusters numbered at bottom as in E). Gene expression is shown separately for T cells from IDH-G and GBM based on subsets identified using NMF clustering (E). Gene expression is zero-centered and given in units of ln(TP100K+1).
Fig. 2.
Fig. 2.. Expression of NK cell receptors by population of CD8 T cells.
(A, B) Expression of gene signatures for cytotoxicity (CD8: P < 2.2*1016; CD4: P = 1.52*1013), interferon (CD8: P < 2.2*1016; CD4: P < 2.2*1016) and stress (CD8: P < 2.2*1016; CD4: P < 2.2*1016) are elevated in their respective sub-clusters for GBM compared to IDH-G in both CD8 (A) and CD4 (B) T cells (Komolgorov-Smirnov two-sample test); cluster designation corresponds to Figure 1E, F. (C) Correlation of cytotoxicity signature (x-axis) and NK signature scores (y-axis) for CD8 T cells from cluster 1 (green) or other clusters (2-6, black); clusters as defined in Fig. 1E (STAR Methods). (D) CD8 T cells from all gliomas were split into those with high and low NK signature scores. Heatmap shows relative expression of the 20 most differentially expressed genes for each subset, separately for IDH-G and GBM. NK signature genes are bolded red, cytotoxicity signature genes are bolded black. (E) UMAP visualization of CD8 T cells colored by expression of cytotoxicity, NK receptor or inhibitory receptor signatures (STAR Methods). (F) Expression of three cytotoxicity markers in CD8 T cells. (G) UMAP visualization of CD4 T cells colored by expression of cytotoxicity or inhibitory receptor signatures. (H) Cytotoxic markers in CD4 T cells. (E-H) Displayed on UMAP visualizations as in Figure 1E. Gene expression is given in units of ln(TP100K+1).
Fig. 3.
Fig. 3.. Transcriptional signatures of clonally expanded T cells.
(A) Flow cytometric analysis of GBM-infiltrating CD8 T cells from one patient for protein levels of CD161 (x-axis), NKp80, NKG2C, and TIGIT (y-axis). (B) Summary of data from (A) for tumor-infiltrating T cells from two GBM patients. (C) TCR α and β chain sequences were reconstructed for each cell from scRNA-seq reads for the full-length scRNAseq dataset and displayed as mean percent of T cells with recurrent TCRs within each T cell subset. The mean percent is taken across all individual patient samples, and the error bars show the SEM. (D) Size of TCR clonotypes for five GBM samples based on 5’ scRNA-seq analysis. Clonotype sizes are grouped by colors, and the number of clonotypes for each size group is indicated for each tumor. (E) Comparison of expression for each gene in clonal versus non-clonal T cells from GBM tumors. Z-score of expression (y-axis) and Z-score of coefficient of variation (CV) of expression (x-axis) is shown for each gene separately for CD8 (left) and CD4 (right) T cells (STAR Methods). (F) Heatmap comparing gene expression of clonally expanded, KLRB1 positive and negative T cells from five GBM samples based on 5’ scRNA-seq analysis. Gene expression is zero-centered and given in units of ln(TP100K+1).
Fig. 4.
Fig. 4.. Investigation of CLEC2D – CD161 pathway in GBM.
(A) Quantification of transcript levels for CLEC2D and selected genes in malignant cells, myeloid cells, and oligodendrocytes from published glioma datasets. Gene expression is zero-centered and given in units of ln(TP100K+1). (B) Diversity of TCRα V and J gene segment usage by CD8 T cells expressing KLRB1. (C) Flow cytometric analysis of CD161 protein on the surface of CD8 (top) and CD4 (bottom) T cells in GBM (filled colors) versus blood T cells (blue line) from the same patient. Dotted line indicates staining with isotype control antibody; percentage of CD161+ tumor-infiltrating T cells is indicated. (D and E) Quantification of CD161 and PD-1 positive T cells in two GBM (E208 and E161), based on fluorescence minus one (FMO) and isotype controls, (D) and summary of data for five GBM (E). Percentage of CD161 versus PD-1 positive T cells, P < 0.006 for CD8 and P < 0.003 for CD4 T cells, Mann-Whitney U test. Error bars denote SEM. (F) In situ hybridization in two IDH-G (upper panel) and two GBM (lower panel) with probes for KLRB1 and CD3E (top) as well as CLEC2D and CD45 (bottom), counterstained with hematoxylin (light purple). Top row shows subsets of cells co-expressing CD3E and KLRB1 (black arrowheads); bottom row highlights CLEC2D expression in malignant cells (yellow arrowheads) and CD45 positive immune cells (black arrowheads); * lumen of blood vessels. (G, H) Quantification of infiltrating CD3+ T cells and CD3CD56+ NK cells in five GBM.
Fig. 5.
Fig. 5.. Targeting of CD161 pathway enhances T cell activation and reduces PD-1 expression.
(A) Workflow of experimental strategy to interrogate the function of the KLRB1 gene in primary human T cells. (B) qPCR analysis of CLEC2D and GAPDH mRNA in four gliomasphere cultures and U-87 MG cell line. (C) T cell cytotoxicity assay. Gliomaspheres (MGG123, MGG75 or D270) were co-cultured with KLRB1 or control edited T cells at an effector to target (E:T) ratio of 1:1 or 0.25:1 for 8 hours. The percentage of killed (Zombie UV+) tumor cells was quantified by flow cytometry; cultures without T cells (0:1) were used to assess background levels of apoptosis. (D) Strategy for evaluation of the CD161 – CLEC2D pathway with a CD161 blocking monoclonal antibody. (E) T cell killing assay with CD161 blocking mAb (HP-3G10) or isotype control IgG. (F) Labeling of CD8 T cells after 24 hours for surface localization of CD107a degranulation marker. (G-I) Analysis of PD-1 expression by CD8 T cells. T cells were co-cultured for 72 hours with patient-derived gliomaspheres at the indicated E:T ratios and PD-1 surface expression was evaluated by flow cytometry. Pathway was targeted by editing of KLRB1 gene in T cells or addition of CD161 blocking mAb. (J, K) Cytokine release by T cells. T cells were co-cultured for 72 hours with gliomaspheres from GBM (MGG123, MGG75) (J) or IDH-G (BT142) (K) at the indicated E:T ratios. Experiments in (C) were performed three times, (E-K) were performed two times, (B) was performed once. * P < 0.05, ** P < 0.01, *** P < 0.001, error bars denote SEM. Mann-Whitney U test (C, E-F, H-K).
Fig. 6.
Fig. 6.. KLRB1 gene inactivation in T cells improves survival in two humanized GBM models.
(A) Schematic indicating injection sites of GBM cells into the striatum and T cells into the contralateral lateral ventricle. (B) Coronal section of the mouse brain at survival endpoint. (C) Bioluminescence imaging (BLI) on day −1 (relative to first T cell injection). (D) Kinetic analysis of tumor burden based on BLI signal from mice that received KLRB1 or control edited T cells; day 0 corresponds to first T cell injection; 2nd T cell injection is indicated. (E) Survival analysis for MGG123 model following transfer of KLRB1 or control edited T cells. (F-J) Flow cytometry analysis of KLRB1 or control edited T cells infiltrating MGG123 at a late disease stage (moribund). (K) Survival analysis for U87 model following transfer of KLRB1 or control edited T cells. (L-N) Flow cytometry analysis of T cells from U-87 MG tumors 8 days following T cell injection. Experiments in (C-E) & (K) were performed twice; (F-J) and (L-N) were performed once. * P < 0.05, ** P < 0.01, *** P < 0.001, error bars denote SEM. Mann-Whitney U test (D), (F-J), (L-N) and Log-rank (Mantel-Cox) test (E), (K).
Fig. 7.
Fig. 7.. Identification of a T cell KLRB1 program across multiple cancer types.
(A) t-distributed stochastic neighbor embedding (t-SNE) visualization showing expression of key genes in T cells isolated from lung adenocarcinoma. Gene expression is given in units of ln(TP100K+1). (B) Averaged expression of genes in tumor-infiltrating T cells (TILs) in GBM + IDH-G (y-axis) versus melanoma (x-axis). The inset lists the genes with the greatest log2 fold change. (C and D) Overlap of KLRB1 transcriptional programs in CD8 T cells (left) and CD4 T cells (right) between the different pairs of cancer datasets. The p-values (C) and observed vs. expected ratio (D) express the significance (hypergeometric test) and magnitude of the overlap between genes in the KLRB1 transcriptional programs from the different cancers. The Melanoma1 and Melanoma2 datasets refer to two separate melanoma scRNA-seq studies (Jerby-Arnon et al., 2018, Sade-Feldman et al., 2018). (E) Heatmap showing the expression of all genes for the pan-cancer KLRB1 program. This pan-cancer KLRB1 program was defined based on overlap in the individual KLRB1 programs from six scRNA-seq cancer datasets. Gene expression of the pan-cancer program is shown for CD4 and CD8 T cells from the gliomas in this study (GBM and IDH-G), and T cells are further divided into KLRB1 expressing and KLRB1 nonexpressing cells. Gene expression is zero-centered, and given in units of ln(TP100K+1).

Comment in

References

    1. Aldemir H, Prod'homme V, Dumaurier MJ, Retiere C, Poupon G, Cazareth J, Bihl F, and Braud VM (2005). Cutting edge: lectin-like transcript 1 is a ligand for the CD161 receptor. J Immunol 175, 7791–7795. - PubMed
    1. Blondel VD, Guillaume J-L, Lambiotte R, and Lefebvre E (2008). Fast unfolding of communities in large networks. Journal of Statistical Mechanics: Theory and Experiment.
    1. Brown CE, Alizadeh D, Starr R, Weng L, Wagner JR, Naranjo A, Ostberg JR, Blanchard MS, Kilpatrick J, Simpson J, et al. (2016). Regression of Glioblastoma after Chimeric Antigen Receptor T-Cell Therapy. N Engl J Med 375, 2561–2569. - PMC - PubMed
    1. Bunse L, Pusch S, Bunse T, Sahm F, Sanghvi K, Friedrich M, Alansary D, Sonner JK, Green E, Deumelandt K, et al. (2018). Suppression of antitumor T cell immunity by the oncometabolite (R)-2-hydroxyglutarate. Nat Med 24, 1192–1203. - PubMed
    1. Chan CJ, Martinet L, Gilfillan S, Souza-Fonseca-Guimaraes F, Chow MT, Town L, Ritchie DS, Colonna M, Andrews DM, and Smyth MJ (2014). The receptors CD96 and CD226 oppose each other in the regulation of natural killer cell functions. Nat Immunol 15, 431–438. - PubMed

Publication types