. 2021 Jul:49:101191.
doi: 10.1016/j.molmet.2021.101191. Epub 2021 Feb 13.

Sensory neurons derived from diabetic rats exhibit deficits in functional glycolysis and ATP that are ameliorated by IGF-1

Affiliations

Sensory neurons derived from diabetic rats exhibit deficits in functional glycolysis and ATP that are ameliorated by IGF-1

Mohamad-Reza Aghanoori et al. Mol Metab. 2021 Jul.

Abstract

Objective: The distal dying-back of the longest nerve fibres is a hallmark of diabetic neuropathy, and impaired provision of energy in the form of adenosine triphosphate (ATP) may contribute to this neurodegenerative process. We hypothesised that energy supplementation via glycolysis and/or mitochondrial oxidative phosphorylation is compromised in cultured dorsal root ganglion (DRG) sensory neurons from diabetic rodents, thus contributing to axonal degeneration. Functional analysis of glycolysis and mitochondrial respiration and real-time measurement of ATP levels in live cells were our specific means to test this hypothesis.

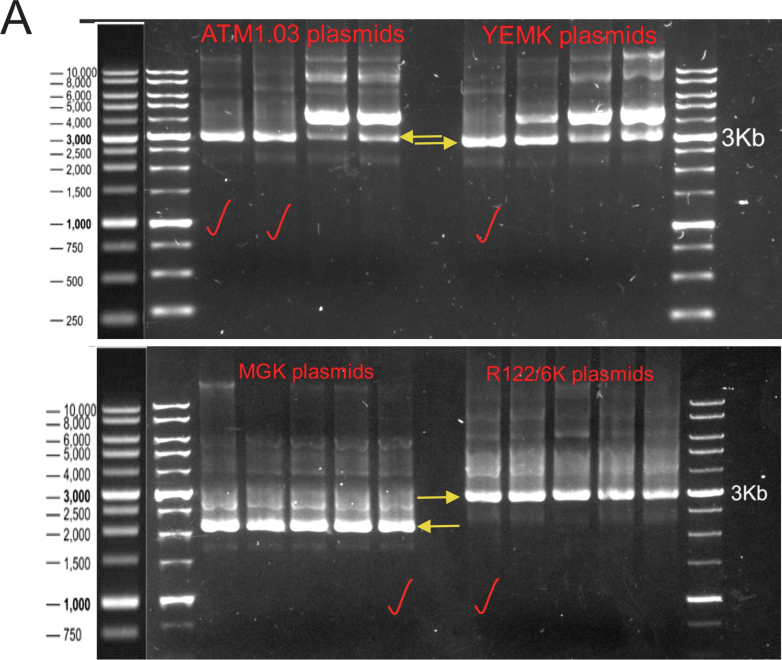
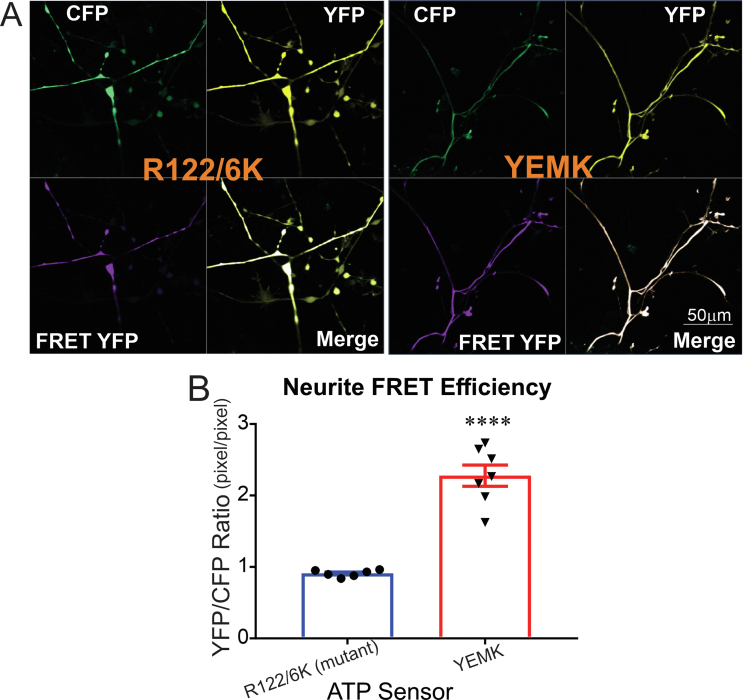
Methods: DRG neuron cultures from age-matched control or streptozotocin (STZ)-induced type 1 diabetic rats were used for in vitro studies. Three plasmids containing ATP biosensors of varying affinities were transfected into neurons to study endogenous ATP levels in real time. The Seahorse XF analyser was used for glycolysis and mitochondrial respiration measurements.

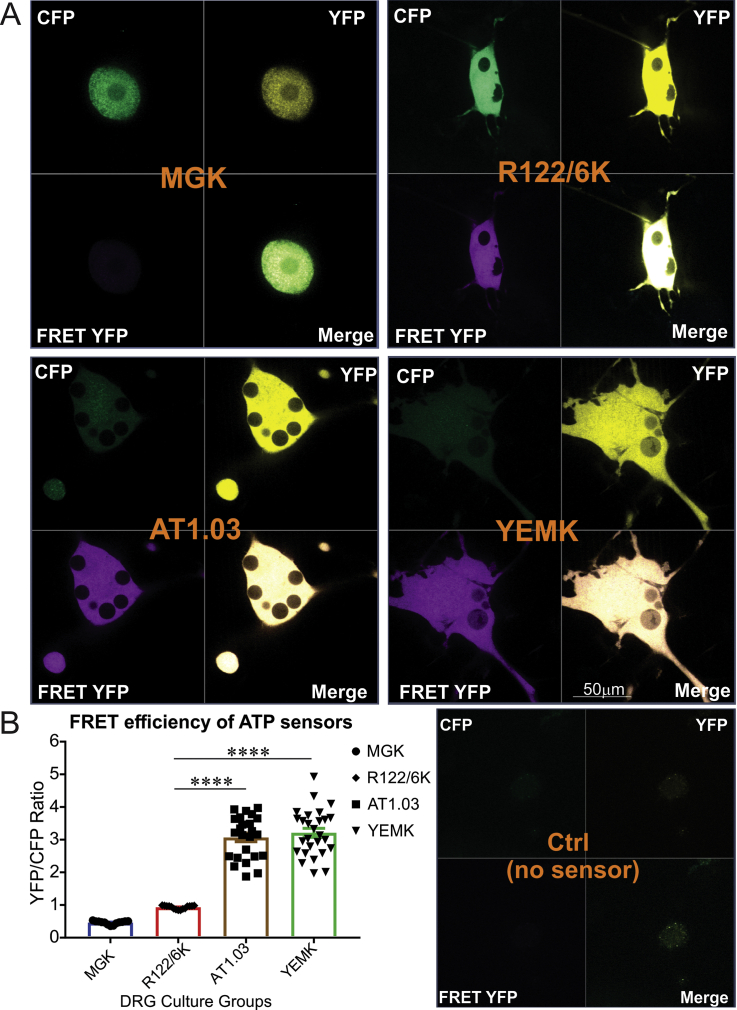
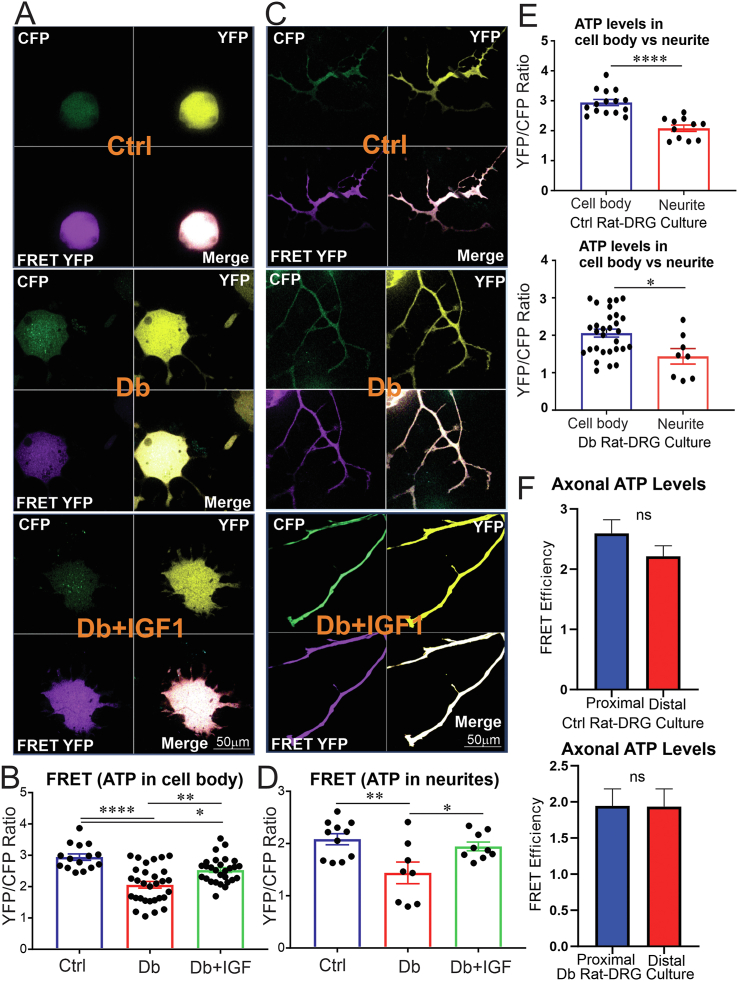
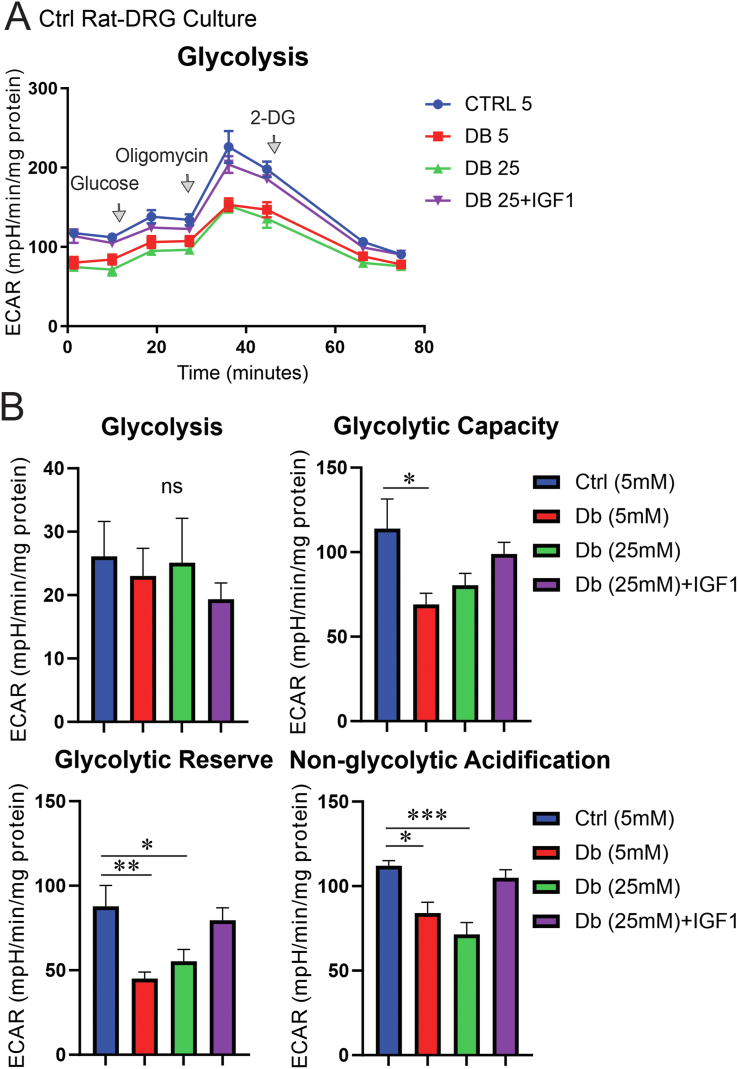
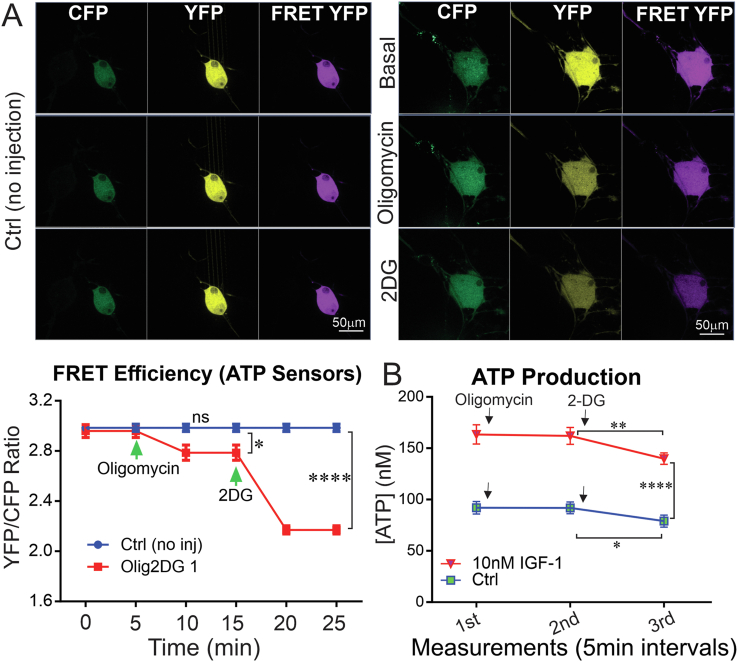
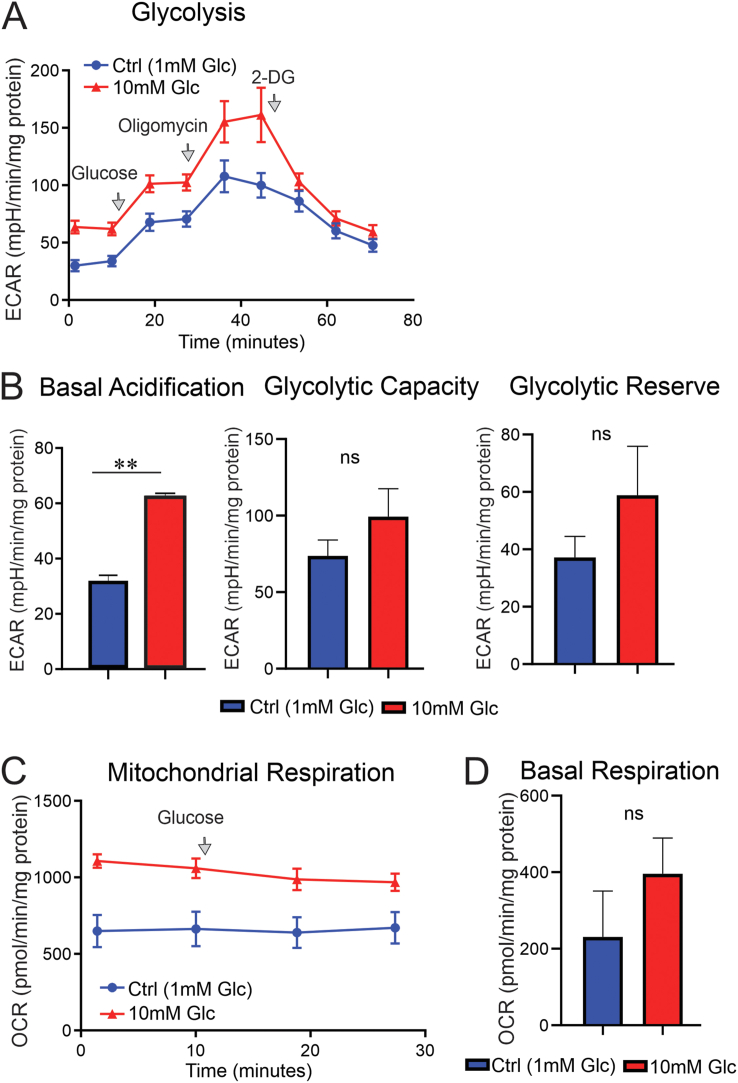
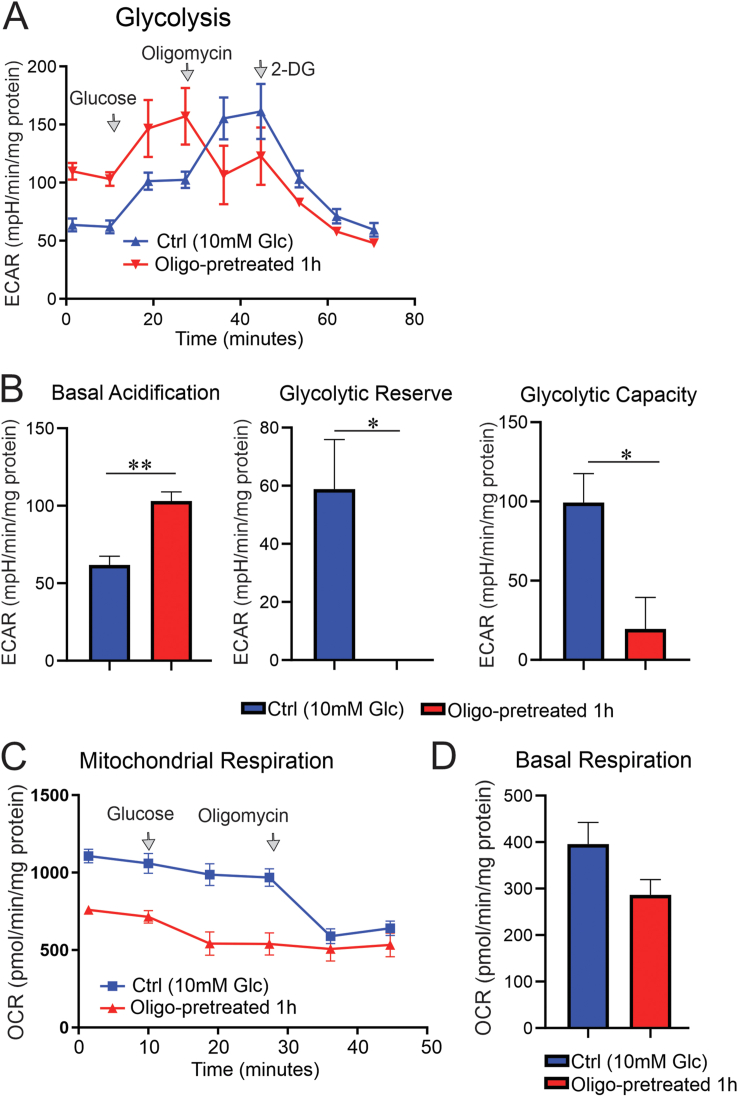
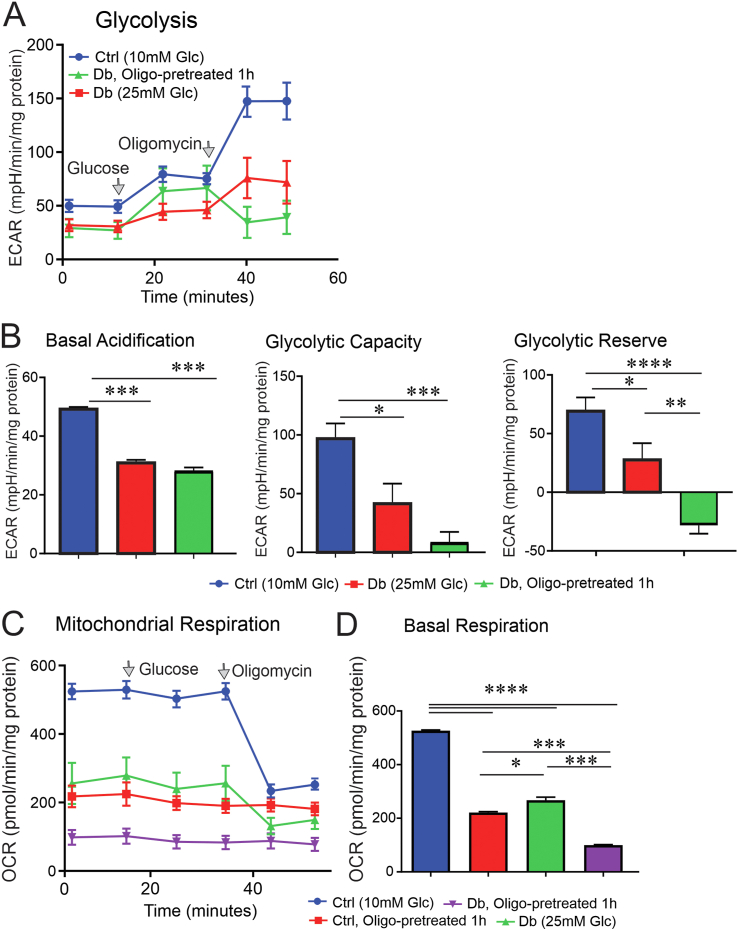
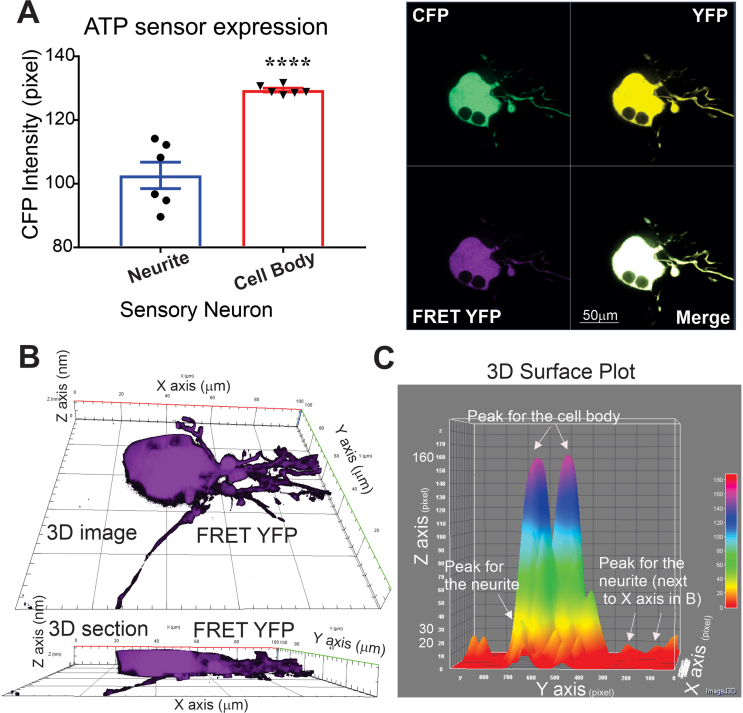
Results: Fluorescence resonance energy transfer (FRET) efficiency (YFP/CFP ratio) of the ATP biosensors AT1.03 (low affinity) and AT1.03YEMK (medium affinity) were significantly higher than that measured using the ATP-insensitive construct AT1.03R122/6K in both cell bodies and neurites of DRG neurons (p < 0.0001). The ATP level was homogenous along the axons but higher in cell bodies in cultured DRG neurons from both control and diabetic rats. Treatment with oligomycin (an ATP synthase inhibitor in mitochondria) decreased the ATP levels in cultured DRG neurons. Likewise, blockade of glycolysis using 2-deoxy-d-glucose (2-DG: a glucose analogue) reduced ATP levels (p < 0.001). Cultured DRG neurons derived from diabetic rats showed a diminishment of ATP levels (p < 0.01), glycolytic capacity, glycolytic reserve and non-glycolytic acidification. Application of insulin-like growth factor-1 (IGF-1) significantly elevated all the above parameters in DRG neurons from diabetic rats. Oligomycin pre-treatment of DRG neurons, to block oxidative phosphorylation, depleted the glycolytic reserve and lowered basal respiration in sensory neurons derived from control and diabetic rats. Depletion was much higher in sensory neurons from diabetic rats compared to control rats. In addition, an acute increase in glucose concentration, in the presence or absence of oligomycin, elevated parameters of glycolysis by 1.5- to 2-fold while having no impact on mitochondrial respiration.

Conclusion: We provide the first functional evidence for decreased glycolytic capacity in DRG neurons derived from type 1 diabetic rats. IGF-1 protected against the loss of ATP supplies in DRG cell bodies and axons in neurons derived from diabetic rats by augmenting various parameters of glycolysis and mitochondrial respiration.

Keywords: ATP biosensors; Axon regeneration; Bioenergetics; Diabetic neuropathy; Mitochondrial respiration; Neurite outgrowth.


Figures

Figure 1
Figure 1
Wild-type and mutant ATP sensors were detected in sensory neurons derived from rats. DRG neurons derived from adult control rats were transfected with AT3.10MGK (high affinity), AT1.03YEMK (medium affinity), AT1.03 (low affinity) and AT1.03R122/6K (mutant) constructs for 48 h. Images were taken using confocal microscope and FRET efficiency (YFP/CFP ratio) was calculated for each group of ATP sensors. No FRET signal was detected in MGK-transfected sensory neurons in our in vitro system. (A) shows representative fluorescent images and (B) reveals tabulated data, and all groups were compared to mutant as the control group. Data are mean ± SEM of N = 25–35 images (1–3 neurons per image were analysed); ∗∗∗∗ = p < 0.0001; analysed by one-way ANOVA with Dunnett's post-hoc test.
Figure 2
Figure 2
Energy deficit in sensory neurons from diabetic rats was prevented by IGF-1 treatment. DRG neurons derived from adult control or STZ-induced diabetic rats were transfected with AT1.03YEMK (medium affinity) for 48 h. A subgroup of DRG neurons from diabetic rats were treated with 10 nM IGF-1 for the final 24 h. (A, B) Cell body and (C, D) axonal images were taken using confocal microscope and FRET efficiency (YFP/CFP ratio) was calculated for each group of ATP sensors. In (E), FRET efficiency of cell body and neurites of the neurons are compared within groups. In (F), FRET efficiency of proximal and distal parts of the longest neurites are compared within groups. Data are mean ± SEM of N > 30 images for cell bodies and N > 8 for axons (1–2 cell bodies/neurites per image were analysed); ∗ = p < 0.05 or ∗∗ = p < 0.01 or ∗∗∗∗ = p < 0.0001; analysed by Student's t-test or one-way ANOVA with Tukey's post-hoc test.
Figure 3
Figure 3
Glycolytic capacity and reserve were defective in sensory neurons from diabetic rats and were restored with IGF-1 treatment. DRG neurons derived from adult control and diabetic rats were cultured in the presence of 10 mM or 25 mM of glucose overnight and underwent glycolysis analysis test using the Seahorse XF24 bioanalyser. Media was replaced with no-glucose media 1 h prior to the experiment. Glucose (10 mM), oligomycin (1 μM) and 2-deoxy-glucose (2DG: a glucose analogue) (50 mM) were sequentially injected to determine the extracellular acidification rate (ECAR). More details on glycolysis parameters are given in the method section. Data are mean ± SEM of N = 4–5 replicates; ∗ = p < 0.05 or ∗∗ = p < 0.01 or ∗∗∗ = p < 0.001; analysed by one-way ANOVA with Dunnett's post-hoc test.
Figure 4
Figure 4
Inhibition of glycolysis caused a greater decrease in ATP compared with inhibition of ATP synthase. DRG neurons derived from adult control rats were transfected with YEMK (medium affinity) construct for 48 h. Images were taken using confocal microscope and FRET efficiency (YFP/CFP ratio) was calculated for each group of cultured neurons transfected with ATP sensors. (A) The group with no injection was considered as the control group. A group of cells were treated with oligomycin and then 2DG on-stage. FRET at basal level, after oligomycin (irreversible ATP synthase inhibitor) injection, and after 2-deoxy glucose (2-DG: glycolysis inhibitor) injection was measured. In (B), a similar approach was used to measure ATP levels using a luminescent-based ATP assay kit except that all treatments were done prior to one-time measurement of ATP. A subgroup of neurons was treated with 10 nM IGF-1 the day before the assay. In (A), data are mean ± SEM of N > 15 trials (at least 15 neurons from 15 distinct wells were analysed per group). In (B), data are mean ± SEM of N = 5 (5 wells per group); ∗ = p < 0.05 or ∗∗ = p < 0.01 or ∗∗∗∗ = p < 0.0001; analysed by one-way ANOVA with Dunnett's post-hoc test.
Figure 5
Figure 5
Higher glucose concentration doubled basal glycolysis and basal mitochondrial respiration in cultured sensory neurons. DRG neurons derived from adult control rats were cultured in the presence of 1 mM or 10 mM of glucose overnight and underwent glycolysis analysis and mitochondrial OCR assay using Seahorse XF24 analyser. All culture groups were starved of glucose for 1.5 h prior to the injection of 10 mM glucose programmed by the Seahorse analyser. More details on parameters of glycolysis and mitochondrial respiration are given in method section. In (A), glucose (10 mM), oligomycin (1 μM) and 2-deoxy-glucose (2DG: a glucose analogue) (50 mM) were sequentially injected to determine the extracellular acidification rate (ECAR). In (C), 10 mM glucose was injected to measure mitochondrial OCR under acute change in glucose concentration. In (A and C), first measurements of ECAR and OCR are considered basal levels of glycolysis and mitochondrial respiration, respectively. Basal glycolysis is not tabulated. Data are mean ± SEM of N = 4–5 replicates; analysed by Student's t-test.
Figure 6
Figure 6
Oligomycin treatment doubled glycolysis while decreasing mitochondrial respiration in cultured sensory neurons. DRG neurons derived from adult control rats were cultured in the presence of 10 mM of glucose and incubated overnight. On the day of glycolysis analysis and mitochondrial OCR assay, culture groups were starved of glucose for 1.5 h prior to the injection of 10 mM glucose programmed by the Seahorse bioanalyser. A subgroup of neurons was pre-treated with 1 μM oligomycin for a total of 1 h before the measurements. In (A), glucose (10 mM), oligomycin (1 μM) and 2-deoxy-glucose (2DG: a glucose analogue) (50 mM) were sequentially injected to determine the extracellular acidification rate. In (C), glucose (10 mM) and oligomycin (1 μM) were sequentially injected and mitochondrial OCR was measured using Seahorse XF24 analyser. More details on parameters of glycolysis and mitochondrial respiration are given in the method section. Data are mean ± SEM of N = 4–5 replicates; ∗ = p < 0.05 or ∗∗ = p < 0.01; analysed by Student's t-test.
Figure 7
Figure 7
DRG neurons from diabetic rats showed a deficit in glycolysis, and oligomycin treatment exacerbated the defect. DRG neurons derived from control and diabetic rats were cultured in the presence of 10 mM or 25 mM glucose, respectively and incubated overnight. On the day of glycolysis analysis and mitochondrial OCR assay, all culture groups were starved of glucose for 1.5 h prior to the injection of 10 mM of glucose programmed by the Seahorse analyser. A subgroup of neurons was pre-treated with 1 μM of oligomycin for a total of 1 h before the measurements. In (A), glucose (10 mM) and oligomycin (1 μM) were sequentially injected to determine the extracellular acidification rate. The glycolytic capacity and reserve calculated in (B) are not corrected to basal levels since 2DG was not used as the last injection. In (C), glucose (10 mM) and oligomycin (1 μM) were sequentially injected and mitochondrial OCR was measured using Seahorse XF24 analyser. More details on parameters of glycolysis and mitochondrial respiration are given in the method section. Data are mean ± SEM of N = 5 replicates; ∗ = p < 0.05 or ∗∗ = p < 0.01; or ∗∗∗ = p < 0.001; or ∗∗∗∗ = p < 0.0001; analysed by one-way ANOVA with Tukey's post-hoc test.
Supplemental Figure 1
Validation of size and conformation of plasmids. Plasmids were run on 0.8% agarose gel. (A) Plasmids (check mark) with the right size and highest level of supercoiled conformation (arrows) were used for transfection and further transformation experiments. Each lane indicates plasmids from one colony of competent DH5α cells carrying an ATP biosensor.
Supplemental Figure 2
The higher FRET efficiency of medium affinity construct (AT1.03YEMK) versus mutant construct (AT1.03R122/6K) was also evident in the neurites of cultured DRG neurons. DRG neurons derived from adult control rats were transfected with AT1.03YEMK (medium affinity) and AT1.03R122/6K (mutant) constructs for 48 h. Images were taken from longest neurite regions using confocal microscope, and FRET efficiency (YFP/CFP ratio) was calculated for each group of cultured neurons expressing a specific ATP sensor. Data are mean ± SEM of N=6-7 neurites from 6-7 different images; ∗∗∗∗=p<0.0001; analysed by Student’s t-test.
Supplemental Figure 3
The depth and intensity of FRET signal is higher in cell bodies than in axons of sensory neurons. DRG neurons derived from adult control rats were transfected with AT1.03YEMK (medium affinity) for 48 h. Images were taken from cell body and axonal regions using confocal microscope, and FRET YFP as well as CFP intensity were calculated and analysed independently. In (A), CFP intensity was measured in 6 cell bodies and corresponding neurites of the same neurons derived from control rats. A representative image is given. In (B), FRET YFP intensity from the representative image was plotted on X, Y and Z axes for volumetric analysis of neurites and cell body. In (C), color-coded 3D surface plot of the same neuron was made using FRET YFP intensity measures by using ImageJ. Colours represent the depth of the Z axis (in pixel) in the cell body and neurites. Data are mean ± SEM of N=6 images; ∗∗∗∗=p<0.0001; analysed by Student’s t-test.

Similar articles

Cited by

References

    1. Mergenthaler P., Lindauer U., Dienel G.A., Meisel A. Sugar for the brain: the role of glucose in physiological and pathological brain function. Trends in Neurosciences. 2013;36(10):587–597. - PMC - PubMed
    1. Inman D.M., Harun-Or-Rashid M. Metabolic vulnerability in the neurodegenerative disease glaucoma. Frontiers in Neuroscience. 2017;11:146. - PMC - PubMed
    1. Bernstein B.W., Bamburg J.R. Actin-ATP hydrolysis is a major energy drain for neurons. Journal of Neuroscience. 2003;23(1):1–6. - PMC - PubMed
    1. Wang S.S., Shultz J.R., Burish M.J., Harrison K.H., Hof P.R., Towns L.C. Functional trade-offs in white matter axonal scaling. Journal of Neuroscience. 2008;28(15):4047–4056. - PMC - PubMed
    1. Chen H., Chan D.C. Critical dependence of neurons on mitochondrial dynamics. Current Opinion in Cell Biology. 2006;18(4):453–459. - PubMed

Publication types

Substances

Grants and funding