. 2021 Apr 27;143(17):1687-1703.
doi: 10.1161/CIRCULATIONAHA.120.051911. Epub 2021 Feb 17.

Excessive O-GlcNAcylation Causes Heart Failure and Sudden Death

Affiliations

Excessive O-GlcNAcylation Causes Heart Failure and Sudden Death

Priya Umapathi et al. Circulation. .

Erratum in

Abstract

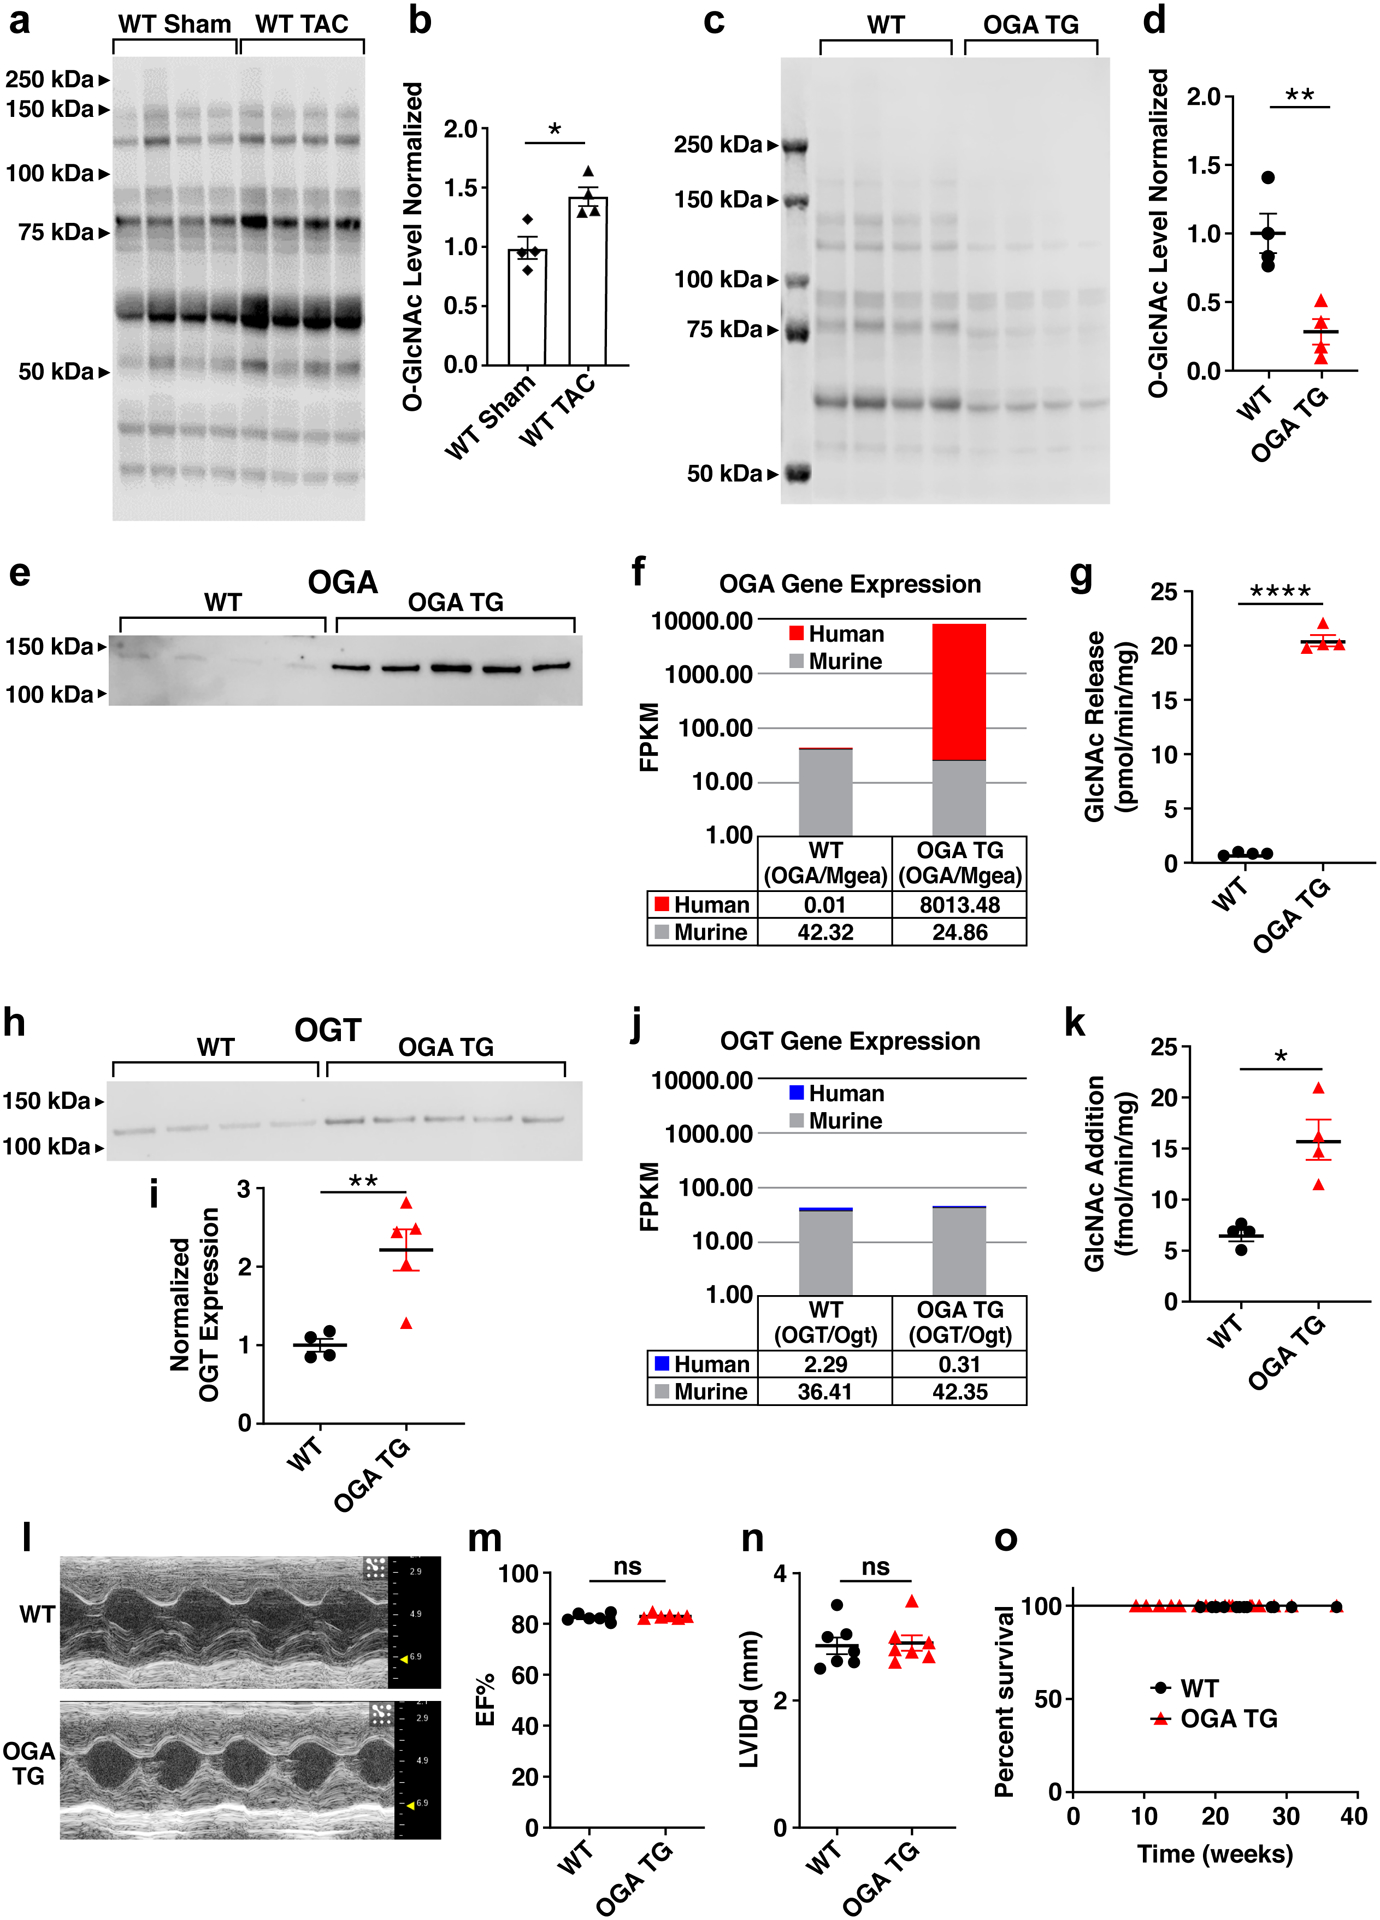
Background: Heart failure is a leading cause of death worldwide and is associated with the rising prevalence of obesity, hypertension, and diabetes. O-GlcNAcylation (the attachment of O-linked β-N-acetylglucosamine [O-GlcNAc] moieties to cytoplasmic, nuclear, and mitochondrial proteins) is a posttranslational modification of intracellular proteins and serves as a metabolic rheostat for cellular stress. Total levels of O-GlcNAcylation are determined by nutrient and metabolic flux, in addition to the net activity of 2 enzymes: O-GlcNAc transferase (OGT) and O-GlcNAcase (OGA). Failing myocardium is marked by increased O-GlcNAcylation, but whether excessive O-GlcNAcylation contributes to cardiomyopathy and heart failure is unknown.

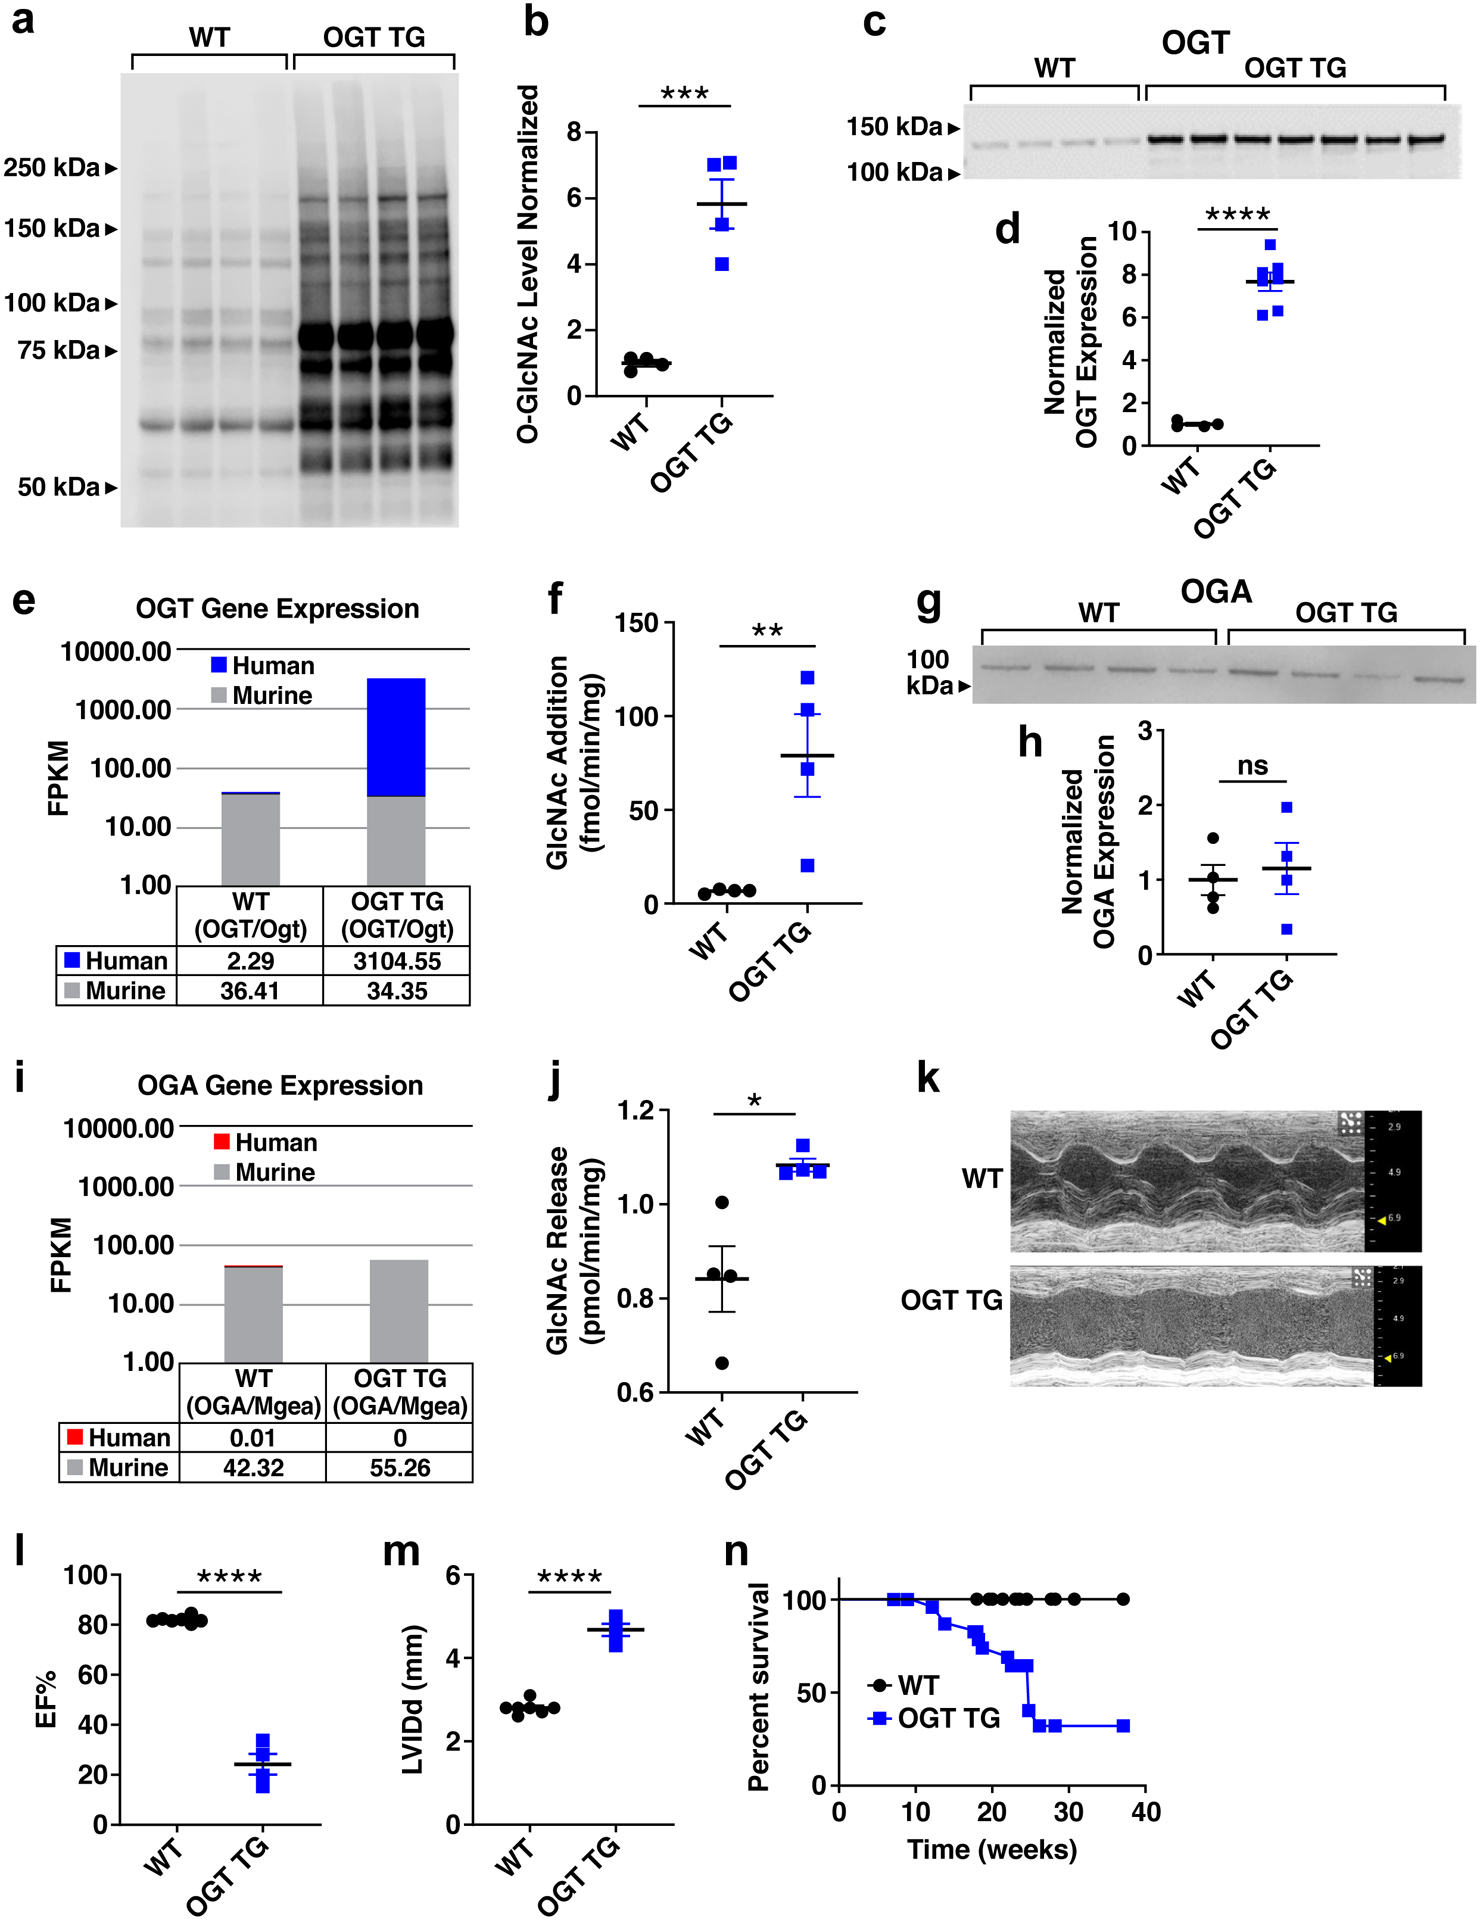
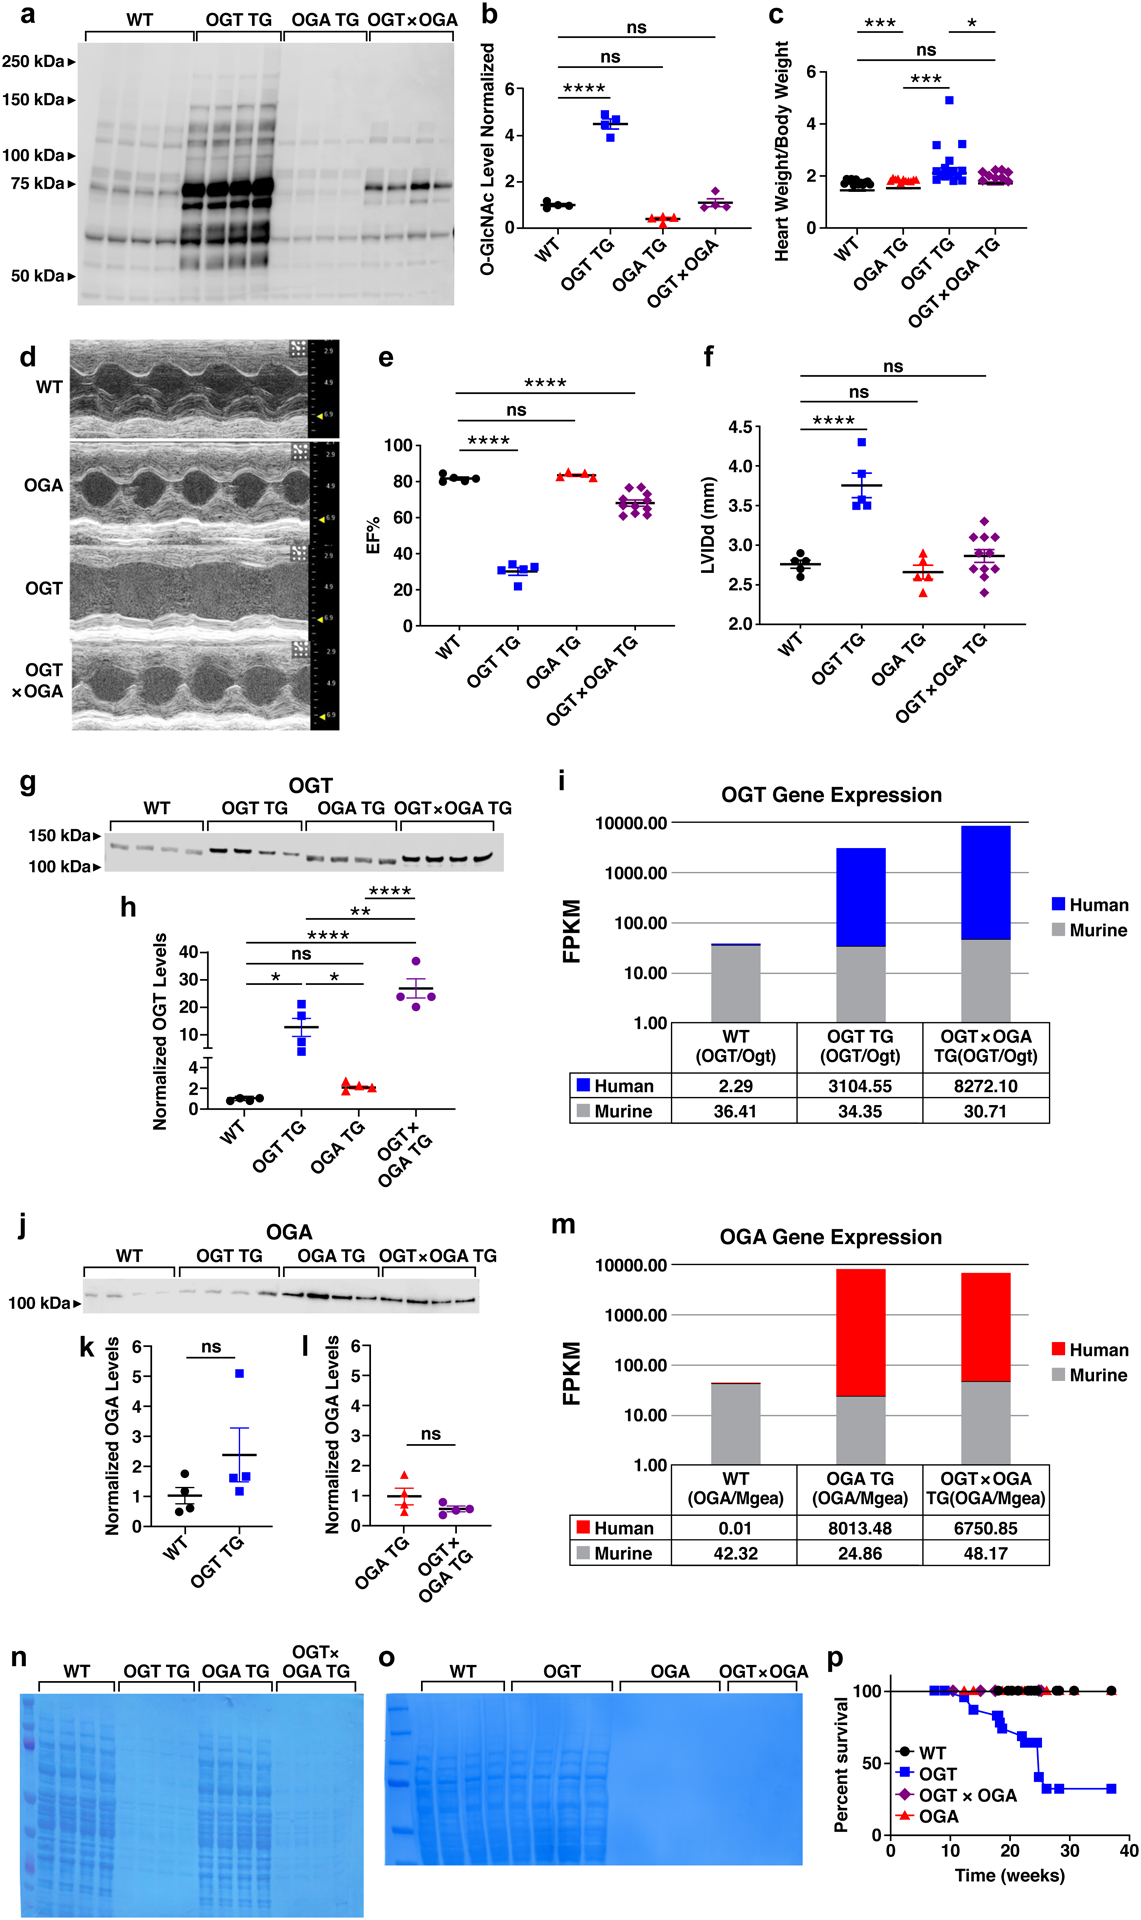
Methods: We developed 2 new transgenic mouse models with myocardial overexpression of OGT and OGA to control O-GlcNAcylation independent of pathologic stress.

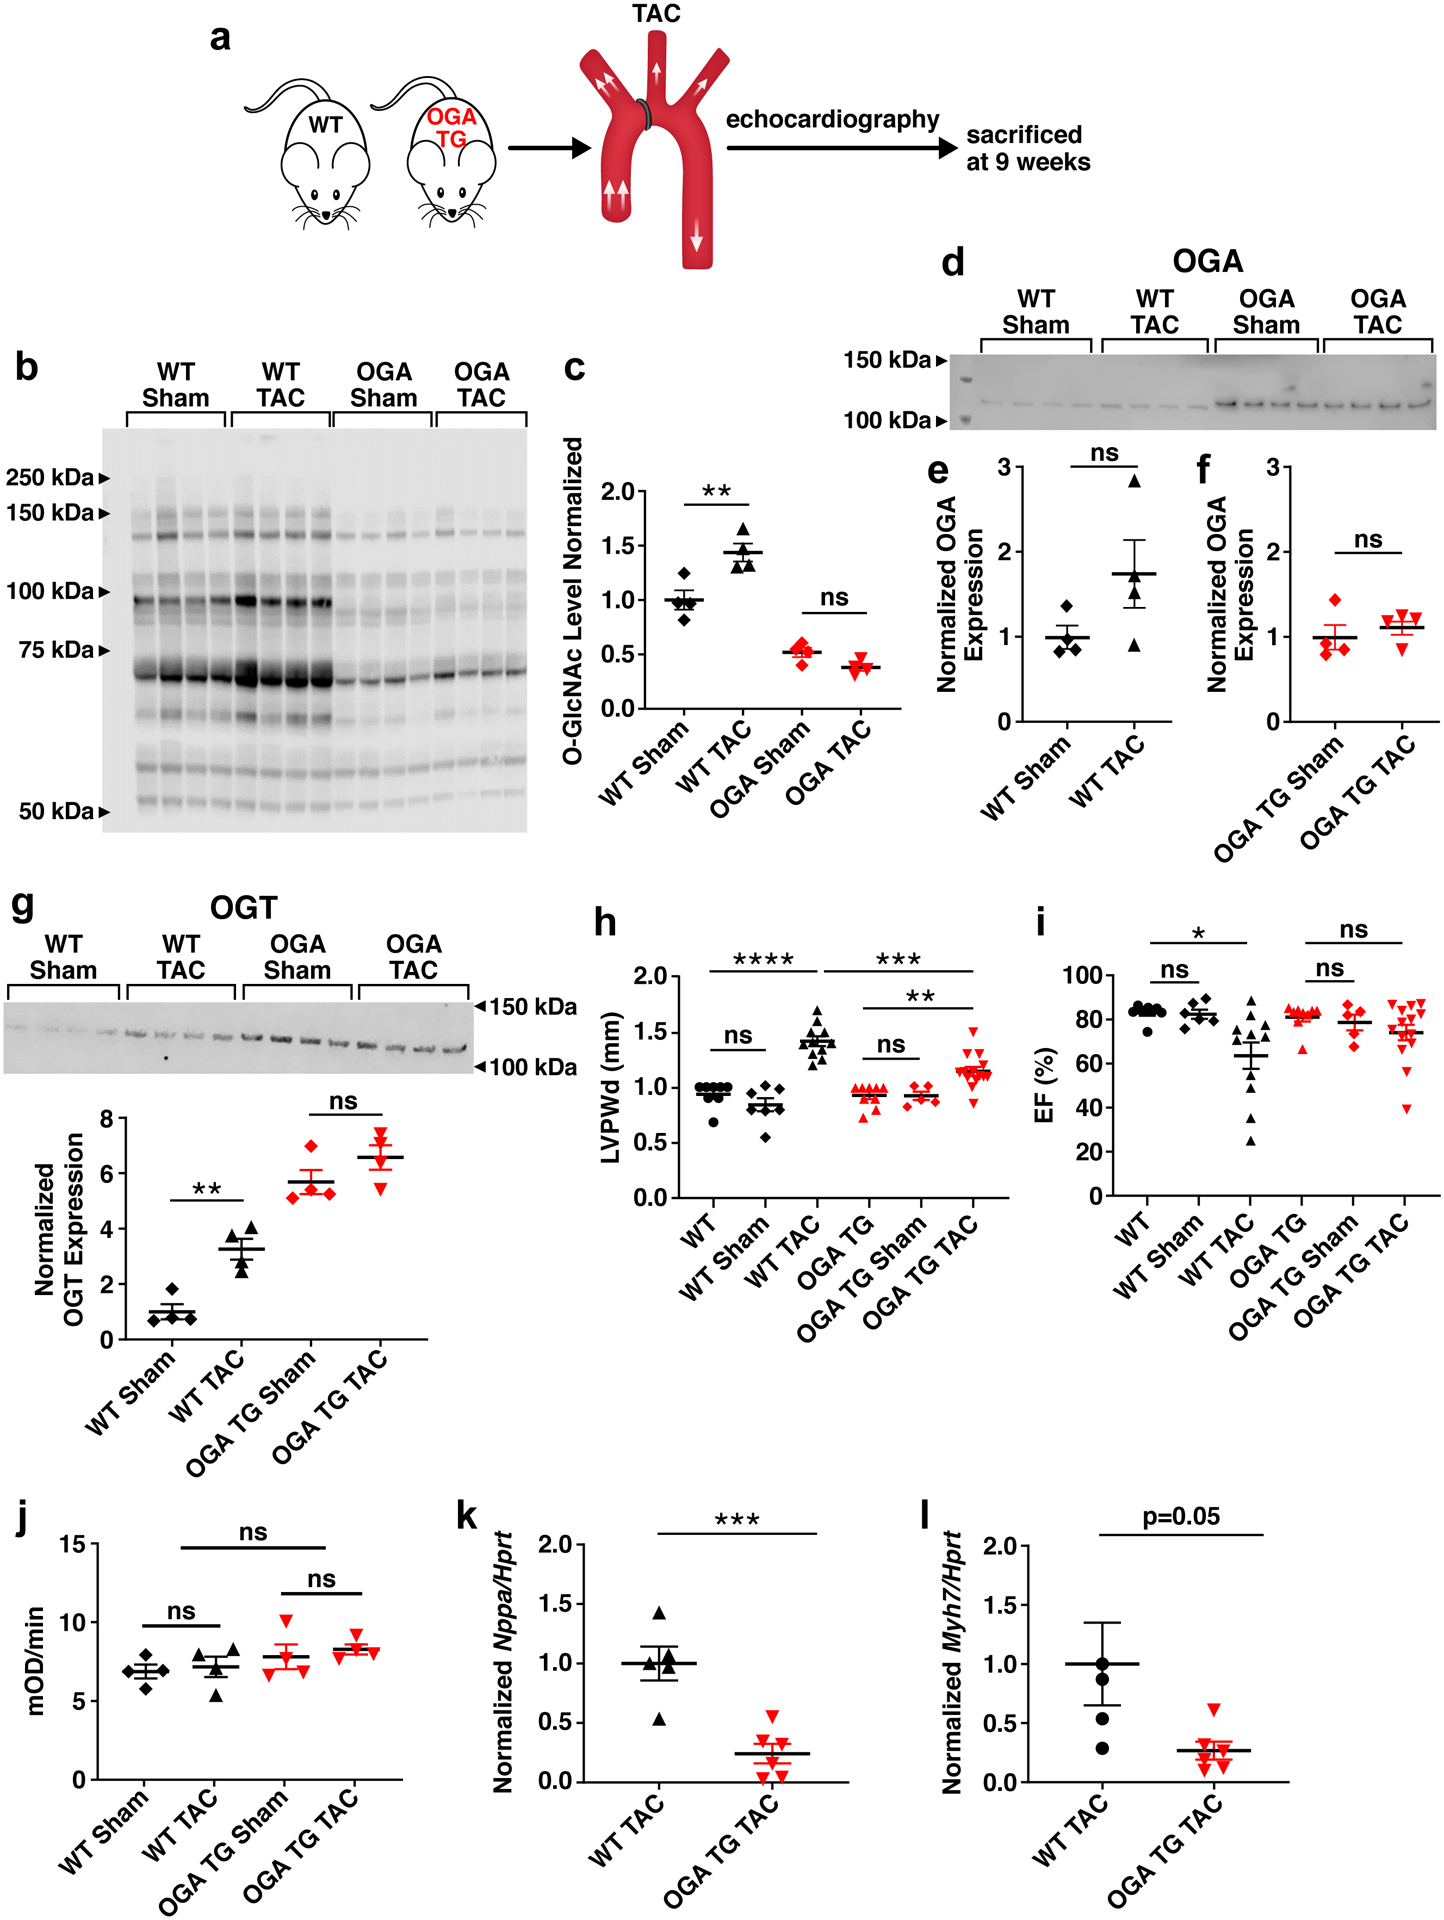
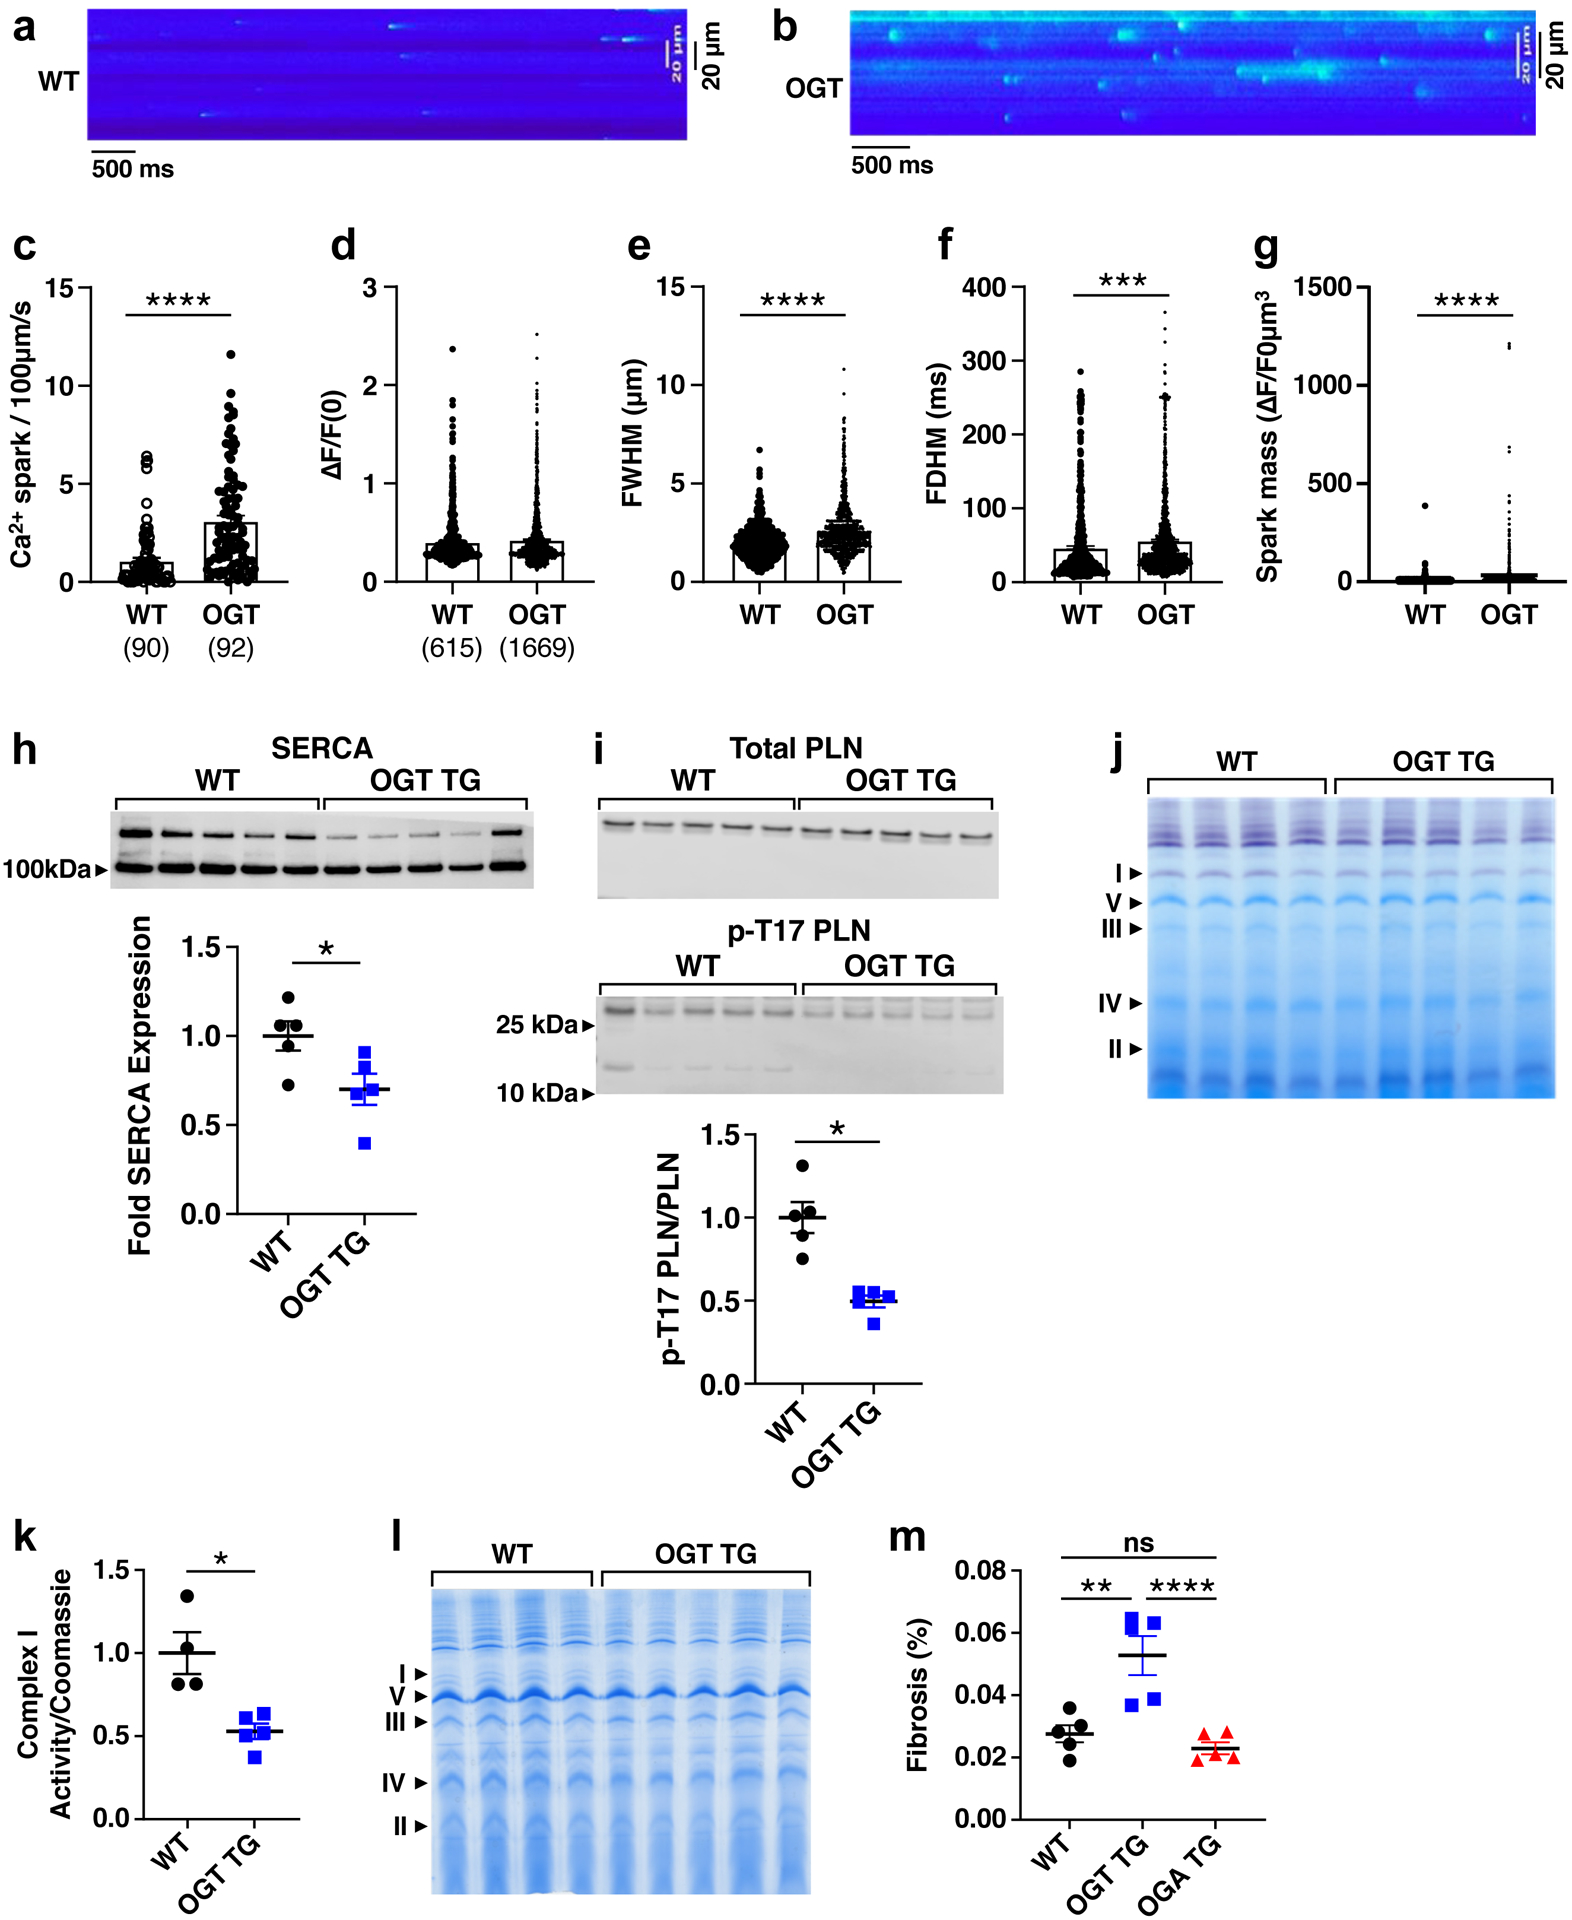
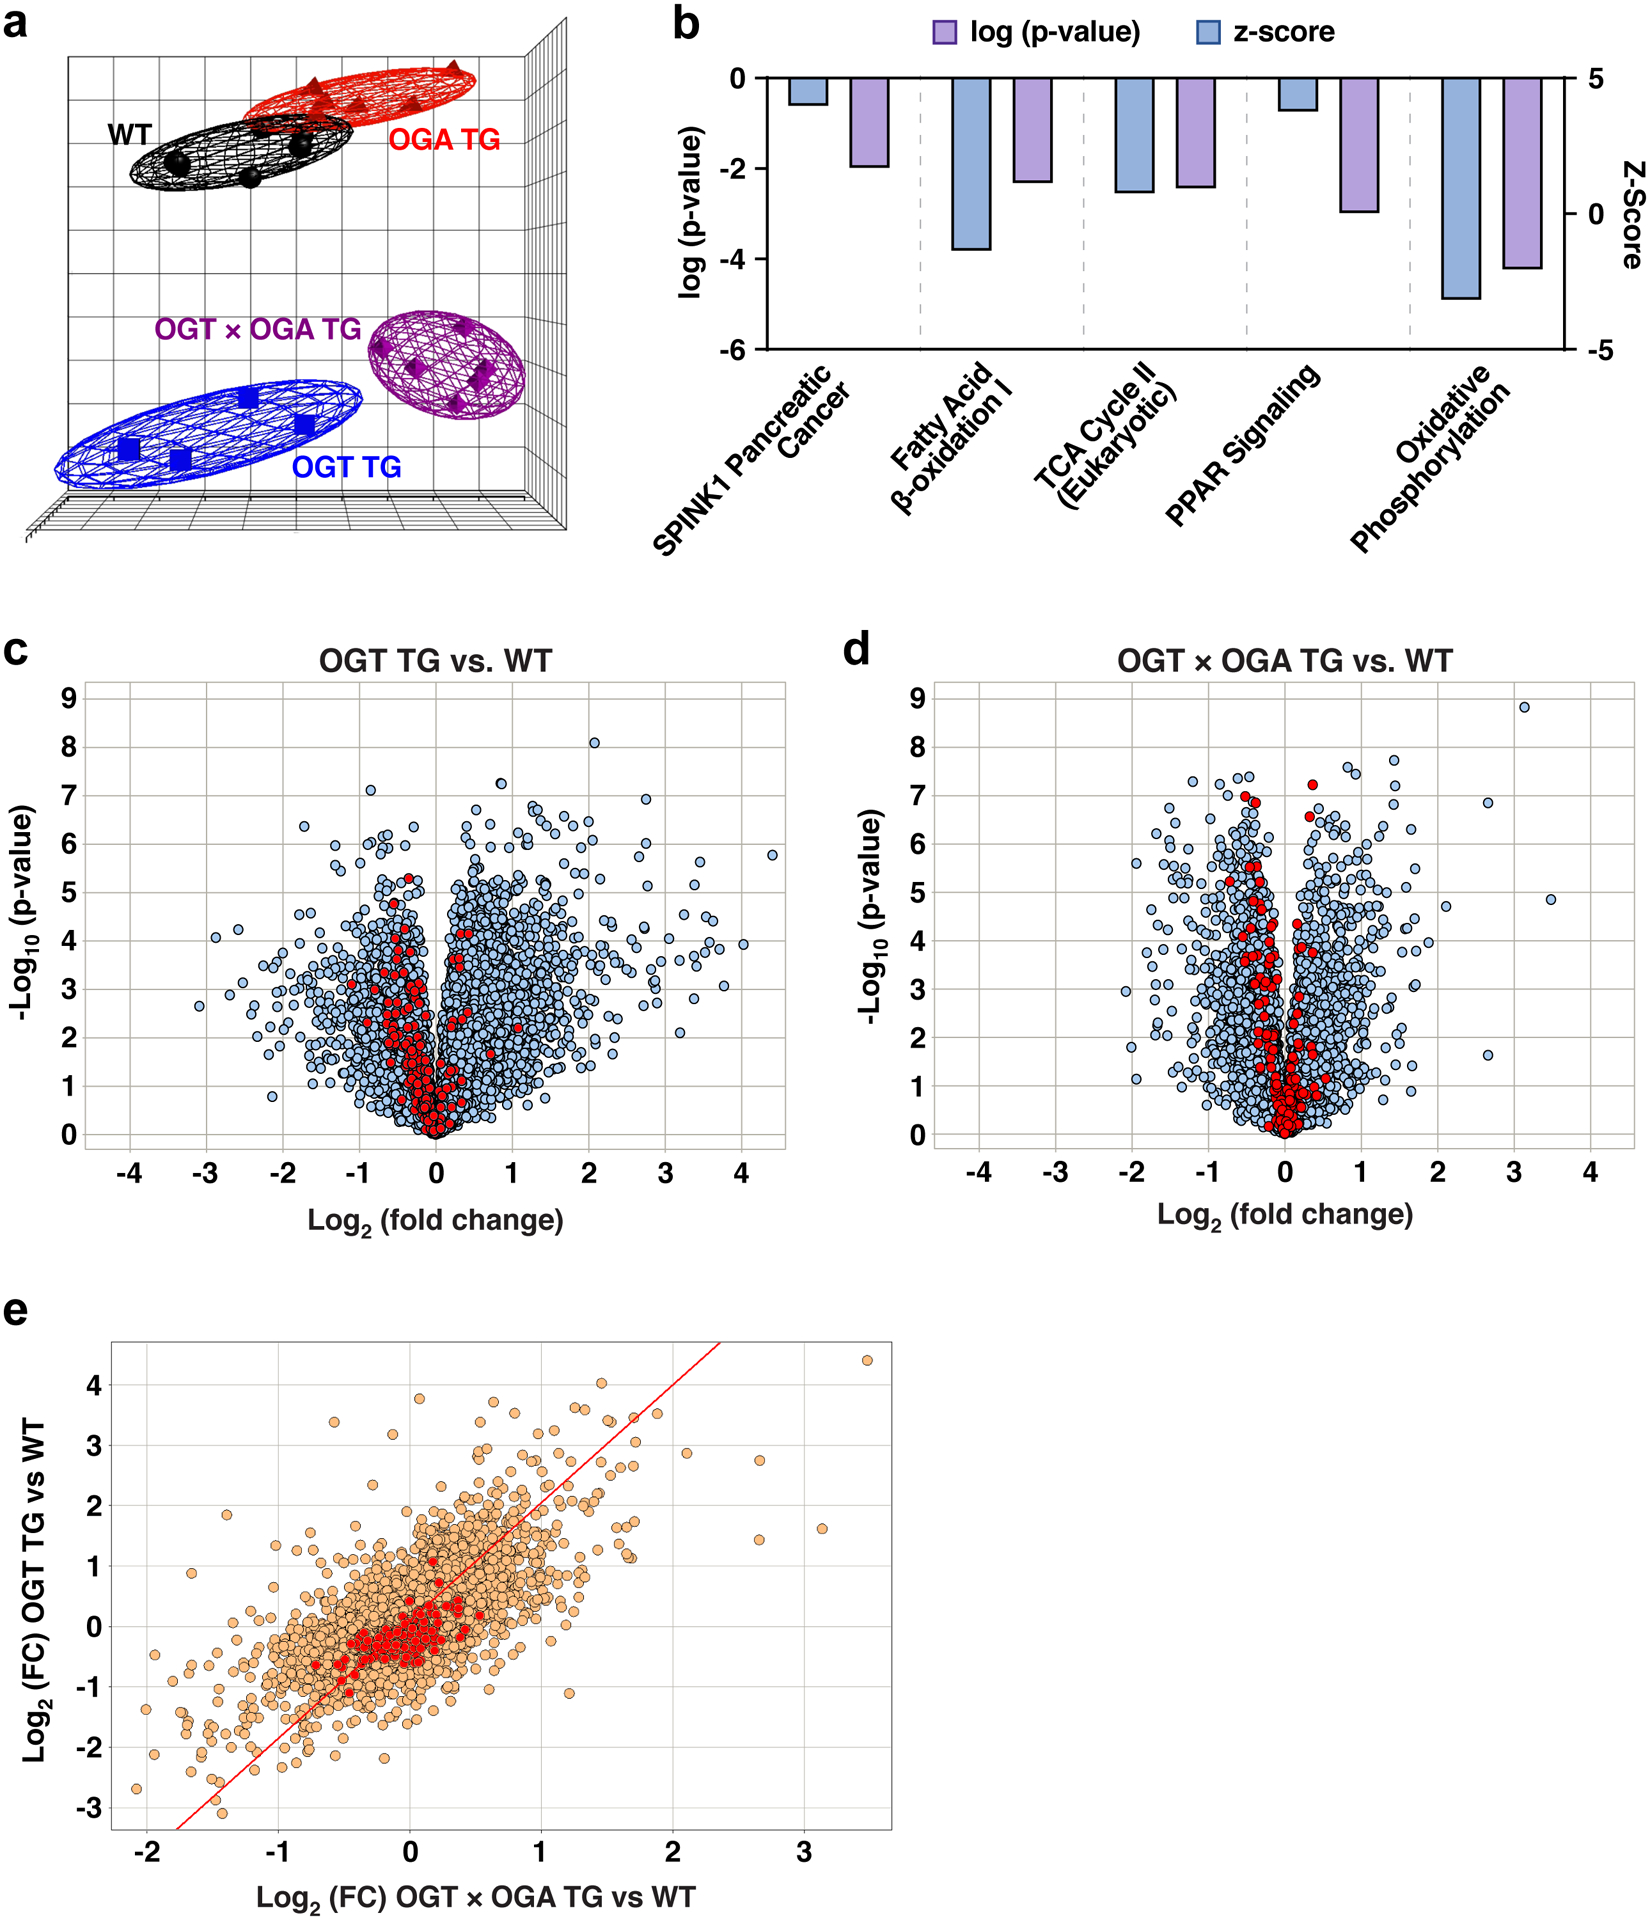
Results: We found that OGT transgenic hearts showed increased O-GlcNAcylation and developed severe dilated cardiomyopathy, ventricular arrhythmias, and premature death. In contrast, OGA transgenic hearts had lower O-GlcNAcylation but identical cardiac function to wild-type littermate controls. OGA transgenic hearts were resistant to pathologic stress induced by pressure overload with attenuated myocardial O-GlcNAcylation levels after stress and decreased pathologic hypertrophy compared with wild-type controls. Interbreeding OGT with OGA transgenic mice rescued cardiomyopathy and premature death, despite persistent elevation of myocardial OGT. Transcriptomic and functional studies revealed disrupted mitochondrial energetics with impairment of complex I activity in hearts from OGT transgenic mice. Complex I activity was rescued by OGA transgenic interbreeding, suggesting an important role for mitochondrial complex I in O-GlcNAc-mediated cardiac pathology.

Conclusions: Our data provide evidence that excessive O-GlcNAcylation causes cardiomyopathy, at least in part, attributable to defective energetics. Enhanced OGA activity is well tolerated and attenuation of O-GlcNAcylation is beneficial against pressure overload-induced pathologic remodeling and heart failure. These findings suggest that attenuation of excessive O-GlcNAcylation may represent a novel therapeutic approach for cardiomyopathy.

Keywords: CaMKII; Uridine diphosphate N-acetylglucosamine; cardiac arrhythmia; heart failure; hypertension; hypertrophy; post-translational protein processing.


Figures

Figure 1.
Figure 1.. Myocardial OGA over-expression decreases total O-GlcNAc modified protein levels but does not cause cardiomyopathy.
a. Representative western blot and b. summary data for total O-GlcNAc modified protein levels (OGN) from whole heart lysates of 8–12 week old mice. Hearts were removed 9 weeks after transverse aortic constriction(TAC) or sham surgery (n = 4 mice/group). c. Western blot of O-GlcNAc levels and d. summary data from cardiac lysates using WT (n = 4) and OGA TG (n = 4) mice. e. Western blot of OGA, 25 ug WT (n=4) protein, 0.25 ug OGA (n=5) TG protein loaded f. human (OGA) and murine (Mgea) transcript levels in WT (n=6) and OGA TG (n=6) mice g. OGA activity assay measuring GlcNAc release in WT (n = 4) and OGA TG (n = 4) mouse hearts at 8–10 weeks. h. OGT protein expression and i. summary data from whole heart lysates from OGA TG (n = 5) and WT (n = 4) mice. j. Human (OGT) and murine (Ogt) transcript levels WT (n=6) and OGA TG (n=6) mice. k. OGT activity assay measuring O-GlcNAc addition in WT (n =4) and OGA TG(n = 4) animals. l. Example images of left ventricular M-mode echocardiograms from WT and OGA TG mice. Summary echocardiographic data for m. left ventricular ejection fraction (EF) and n. left ventricular end-diastolic internal diameter (LVIDd) acquired at 8–10 weeks of age (WT n = 7, OGA TG n = 7). o. Kaplan-Meier survival analysis for OGA TG (n = 11) and WT littermates (n = 9). Data are represented as means ± SEM, significance was determined using the log rank (Mantel-Cox) test. (****P<0.0001, **P<0.01, *P<0.05, ns=not significant for all panels).
Figure 2.
Figure 2.. Myocardial-targeted OGA over-expression protects against left ventricular hypertrophy and contractile dysfunction after transverse aortic constriction (TAC) surgery
a. Schematic of the TAC left ventricular pressure-overload model performed in 8–10 week old WT and OGA TG mice. b. Western blot and c. summary data of total O-GlcNAc levels from WT sham (n=4), WT TAC (n=4), OGA TG Sham (n=4) and OGA TG TAC (n=4) whole heart lysates 9 weeks after intervention. d. Western blot for OGA from whole heart lysates from OGA TG (Sham n =4, TAC n=4) and WT (Sham n=4, TAC n=4) mice, protein loading 25 ug WT mice, 0.25 ug OGA TG mice. e. Quantification OGA levels in WT sham and TAC. f. Quantification of OGA levels in OGA TG Sham and TAC. g. OGT protein expression and quantification h. left ventricular posterior wall thickness measured at end-diastole (LVPWd) in WT(baseline n=8, sham n =7, TAC n=11) and OGA TG (baseline n=9, sham n=5, TAC n=11) and i. Left ventricular ejection fractions (EF) in OGA TG and WT littermate hearts 9 weeks after TAC surgery. j. Complex I activity spectrophotometer assay summary data in WT (sham n=4, TAC n =4) and OGA TG (sham n=4, TAC n=4). k. Quantification of Nppa and l. Myh7 mRNA expression normalized to Hypoxanthine Peroxidase Reductase Transferase (Hprt) in OGA TG (n=6) and WT (n=5) hearts 9 weeks after TAC. Data are represented as mean ± SEM. Significance was determined using a two-tailed Student’s t test or 1 way ANOVA with Tukey’s multiple comparisons test, as appropriate (****P<0.0001, ***P<0.001, **P<0.01, *P<0.05, ns=not significant).
Figure 3.
Figure 3.. OGT TG mice have increased O-GlcNAc, dilated cardiomyopathy, and premature death
a. Western blot and b. summary data for total O-GlcNAc levels in cardiac lysates from OGT TG and WT littermates (WT n = 4, OGT TG n = 4 hearts). c. OGT protein expression and d. summary data (WT n = 4, OGT TG n = 7) and e. human (OGT) and murine (Ogt) transcript levels WT (n=6) and OGT TG (n=6) mice. f. OGT activity assay measuring O-GlcNAc addition in WT (n =4) and OGT TG (n = 4) animals g. OGA protein expression and h. summary data in cardiac lysates (WT n = 4 and OGT TG n = 4 hearts). i. human (OGA) and murine(Mgea) transcript levels in WT (n=6) and OGT TG (n=6) mice. j. OGA activity assay measuring GlcNAc release in WT (n = 4) and OGT TG (n = 4) mouse hearts at 8–10 weeks. k. Example M-mode left ventricular echocardiograms from WT and OGT TG mice. l. Summary echocardiographic data for left ventricular ejection fraction (EF) and m. left ventricular internal diameter in diastole (LVIDd) in 8–12 week old mice (WT n = 7, OGT TG n = 5). n. Kaplan-Meier survival analysis for OGT TG and WT littermate mice (n = 9 WT, n = 14 OGT TG). Data are represented as mean ± SEM; significance was determined using a two-tailed Student’s t test (****P<0.0001, ***P<0.001, **P<0.01, *P<0.05, ns=not significant).
Figure 4.
Figure 4.. OGT TG mice have increased calcium sparks and impaired mitochondrial energetics
Representative images of calcium sparks recorded from ventricular myocytes from a. WT and b. OGT mice. c. Frequency of calcium sparks from ventricular myocytes of WT (n=90 cells, m=3 mice) and OGT (n=92 cells, m=4 mice) mice. d. Amplitude of calcium sparks from ventricular myocytes of WT (n=615 sparks) and OGT (n=1669 sparks) mice. e. Full width at half-maximum amplitude (FWHM) of calcium sparks from ventricular myocytes of WT and OGT mice. f. Full duration at half-maximum amplitude (FDHM). g. Spark mass based on equation: spark amplitudeX1.206XFWHM^3. h. SERCA and i. phospho-PLN/PLN levels measured by western blot in WT(n=5) and OGT TG (n=5) mice j. A blue native gel with WT (n = 4) and OGT TG (n = 5) mitochondrial isolates from heart stained for complex I activity. k. Summary data for complex I activity normalized to total mitochondrial protein expression. l. Total mitochondrial protein (1 heart/lane for panels j and l). m. Percent fibrosis of the left ventricular cavity in WT, OGT TG, OGA TG (all n=5) via Masson’s Trichrome stain. Data are represented as mean ± SEM, significance was determined using a Student’s two-tailed t test (****P<0.0001, ***P<0.001, **P<0.01, *P<0.05, ns=not significant).
Figure 5.
Figure 5.. Rescue of OGT TG cardiomyopathy and premature mortality by OGA TG interbreeding
a. Western blot of total O-GlcNAcylation modified proteins in cardiac lysates from WT (n = 4), OGT TG (n = 4), OGA TG (n = 4), and OGT x OGA TG (n = 4) mice, and b. summary data. c. heart weight/body weight from WT (n = 12), OGA TG (n = 7), OGT TG (n = 15), OGT x OGA TG (n = 9) d. example images of left ventricular M - mode echocardiography of WT, OGA TG, OGT TG and OGT x OGA TG mice at 8–10 weeks of age. e. left ventricular ejection fraction (EF) and f. left ventricular internal diameter in diastole (LVIDd) g. western blot of OGT protein expression and summary data h. in hearts from WT (n = 4), OGT TG (n = 4), OGA TG (n = 4), and OGT x OGA TG (n = 4) mice (15 ug protein loaded in WT, OGA TG, 1.5 ug protein loaded in OGT TG, OGT x OGA TG) i. human (OGT) and murine (Ogt) transcript levels WT (n=6), OGT TG (n=6) and OGT x OGA TG (n=6) mice j. OGA protein expression in WT (n=4), OGT TG (n=4), OGA TG (n=4) and OGT x OGA TG (n=4) protein loading 25 ug WT and OGT TG mice, 0.25 ug OGA TG and OGT x OGA TG mice . k. summary data from WT (n = 4), OGT TG (n = 4) and l. OGA TG (n = 4), OGT x OGA TG (n = 4). m. human (OGA) and murine(Mgea) transcript levels in WT (n=6), OGT TG (n=6) and OGT x OGA TG (n=6) mice. n. Coomassie total protein loading control for OGT (15 ug protein loaded in WT, OGA TG, 1.5 ug protein loaded in OGT TG, OGT x OGA TG lanes) and o. OGA levels in WT, OGT TG, OGA TG and OGT x OGA TG, WT and OGT TG sample loaded at 25 ug protein, OGA TG and OGT x OGA TG samples loaded at 0.25 ug. p. Kaplan-Meier survival analysis for WT (n = 9), OGA TG (n = 11), OGT TG (n = 14) and OGT TG x OGA TG mice (n = 9). Data are represented as mean ± SEM, significance was determined using a two- tailed Student’s t test or log-rank test (survivorship). (****P<0.0001, ***P<0.001, **P<0.01 , *P<0.05, ns=not significant for all panels).
Figure 6.
Figure 6.. Reduced oxidative phosphorylation through impaired Complex I activity in OGT TG cardiomyopathy is rescued in OGT x OGA TG mice
Blue Native gel WT (n=4), OGT TG (n=4), OGT x OGA TG (n=4) stained for a. complex I activity, and b. Coomassie stain for total mitochondrial protein expression from heart (1 heart/lane), and c. Complex I activity spectrophotometer assay summary data. d. Measurement of isolated mitochondria OCR after sequential addition of ADP, oligomycin, FCCP and rotenone/ antimycin A in the presence of substrates pyruvate, glutamate, and malate from all genotypes (WT, OGT TG, OGA TG n = 6, OGT x OGA TG n = 5). e. OCR measurement before ADP addition (the first time point in 6d) f. OCR measurement after ADP addition (the third time point in 6d). Data are represented as mean ± SEM, significance was determined using a 1 way ANOVA with Tukey’s multiple comparisons test. (**P<0.01, *P<0.05, ns=not significant).
Figure 7.
Figure 7.. Metabolic gene expression defects in OGT TG mice are recovered by OGA TG interbreeding
a. Principal component analysis of RNA Seq data from WT, OGT TG, OGA TG and OGT x OGA TG hearts (n = 6 in all groups, M = F) demonstrating clustering by similarity of transcriptome. b. The top 5 significant canonical pathways and biological functions identified by Ingenuity Pathway analysis with a regulation z-score and an overlap p-value (Fisher’s exact test; p < 0.05) for the comparison of significant differentially expressed genes in the dataset comparing OGT TG vs OGT x OGA TG. The Z-score represents the observed up or down regulation compared to known changes that are either activating or inhibiting, as derived from the literature and compiled in the Ingenuity® Knowledge Base. Pathways represented here are overall inhibited. c. Volcano plots representing gene set enrichment analysis of hallmark genes (as derived from the Molecular Signature Database) for oxidative phosphorylation comparing OGT TG versus WT and d. expression of oxidative phosphorylation genes in OGT x OGA TG versus WT. All genes are represented in grey and hallmark oxidative phosphorylation genes are represented in red. e. Scatter plot comparing overlapping genes between OGT TG versus WT and OGT x OGA TG versus WT (all genes in gold and hallmark gene set oxidative phosphorylation genes in red, FC = fold change).

Similar articles

Cited by

References

    1. Ida GL, Jan Magnus A, Heidi K, Eirik Q, Ivar S, Theis T, Geir C, Line MG-W and Cathrine RC. Cardiac O-GlcNAc signaling is increased in hypertrophy and heart failure. Physiological Genomics. 2012;44:162–172. - PubMed
    1. Watson LJ, Facundo HT, Ngoh GA, Ameen M, Brainard RE, Lemma KM, Long BW, Prabhu SD, Xuan Y-T and Jones SP. O-linked β-N-acetylglucosamine transferase is indispensable in the failing heart. Proceedings of the National Academy of Sciences. 2010;107:17797–17802. - PMC - PubMed
    1. Hill BG, Annamalai L, Readnower RD, Brainard RE, Brittian KR, Cummins TD, DeMartino AM, Watson LJ, Jones SP and Long BW. Cardiomyocyte Ogt is essential for postnatal viability. American Journal of Physiology (Consolidated). 2014;306:H142. - PMC - PubMed
    1. Erickson JR, Pereira L, Wang L, Han G, Ferguson A, Dao K, Copeland RJ, Despa F, Hart GW, Ripplinger CM and Bers DM. Diabetic hyperglycaemia activates CaMKII and arrhythmias by O-linked glycosylation. Nature. 2013;502:372–376. - PMC - PubMed
    1. Lehmann LH, Jebessa ZH, Kreusser MM, Horsch A, He T, Kronlage M, Dewenter M, Sramek V, Oehl U, Krebs-Haupenthal J, von der Lieth AH, Schmidt A, Sun Q, Ritterhoff J, Finke D, Volkers M, Jungmann A, Sauer SW, Thiel C, Nickel A, Kohlhaas M, Schafer M, Sticht C, Maack C, Gretz N, Wagner M, El-Armouche A, Maier LS, Londono JEC, Meder B, Freichel M, Grone HJ, Most P, Muller OJ, Herzig S, Furlong EEM, Katus HA and Backs J. A proteolytic fragment of histone deacetylase 4 protects the heart from failure by regulating the hexosamine biosynthetic pathway. Nat Med. 2018;24:62–72. - PubMed

Publication types

Substances