

doi: 10.1161/CIRCRESAHA.120.317914.
Epub 2021 Feb 17.
miR-33 Silencing Reprograms the Immune Cell Landscape in Atherosclerotic Plaques
Affiliations
- PMID: 33593073
- PMCID: PMC8049965
- DOI: 10.1161/CIRCRESAHA.120.317914
Item in Clipboard
miR-33 Silencing Reprograms the Immune Cell Landscape in Atherosclerotic Plaques
Circ Res.
.
Abstract
[Figure: see text].
Keywords: adaptive immunity; atherosclerosis; inflammation; macrophages; microRNA.
Figures
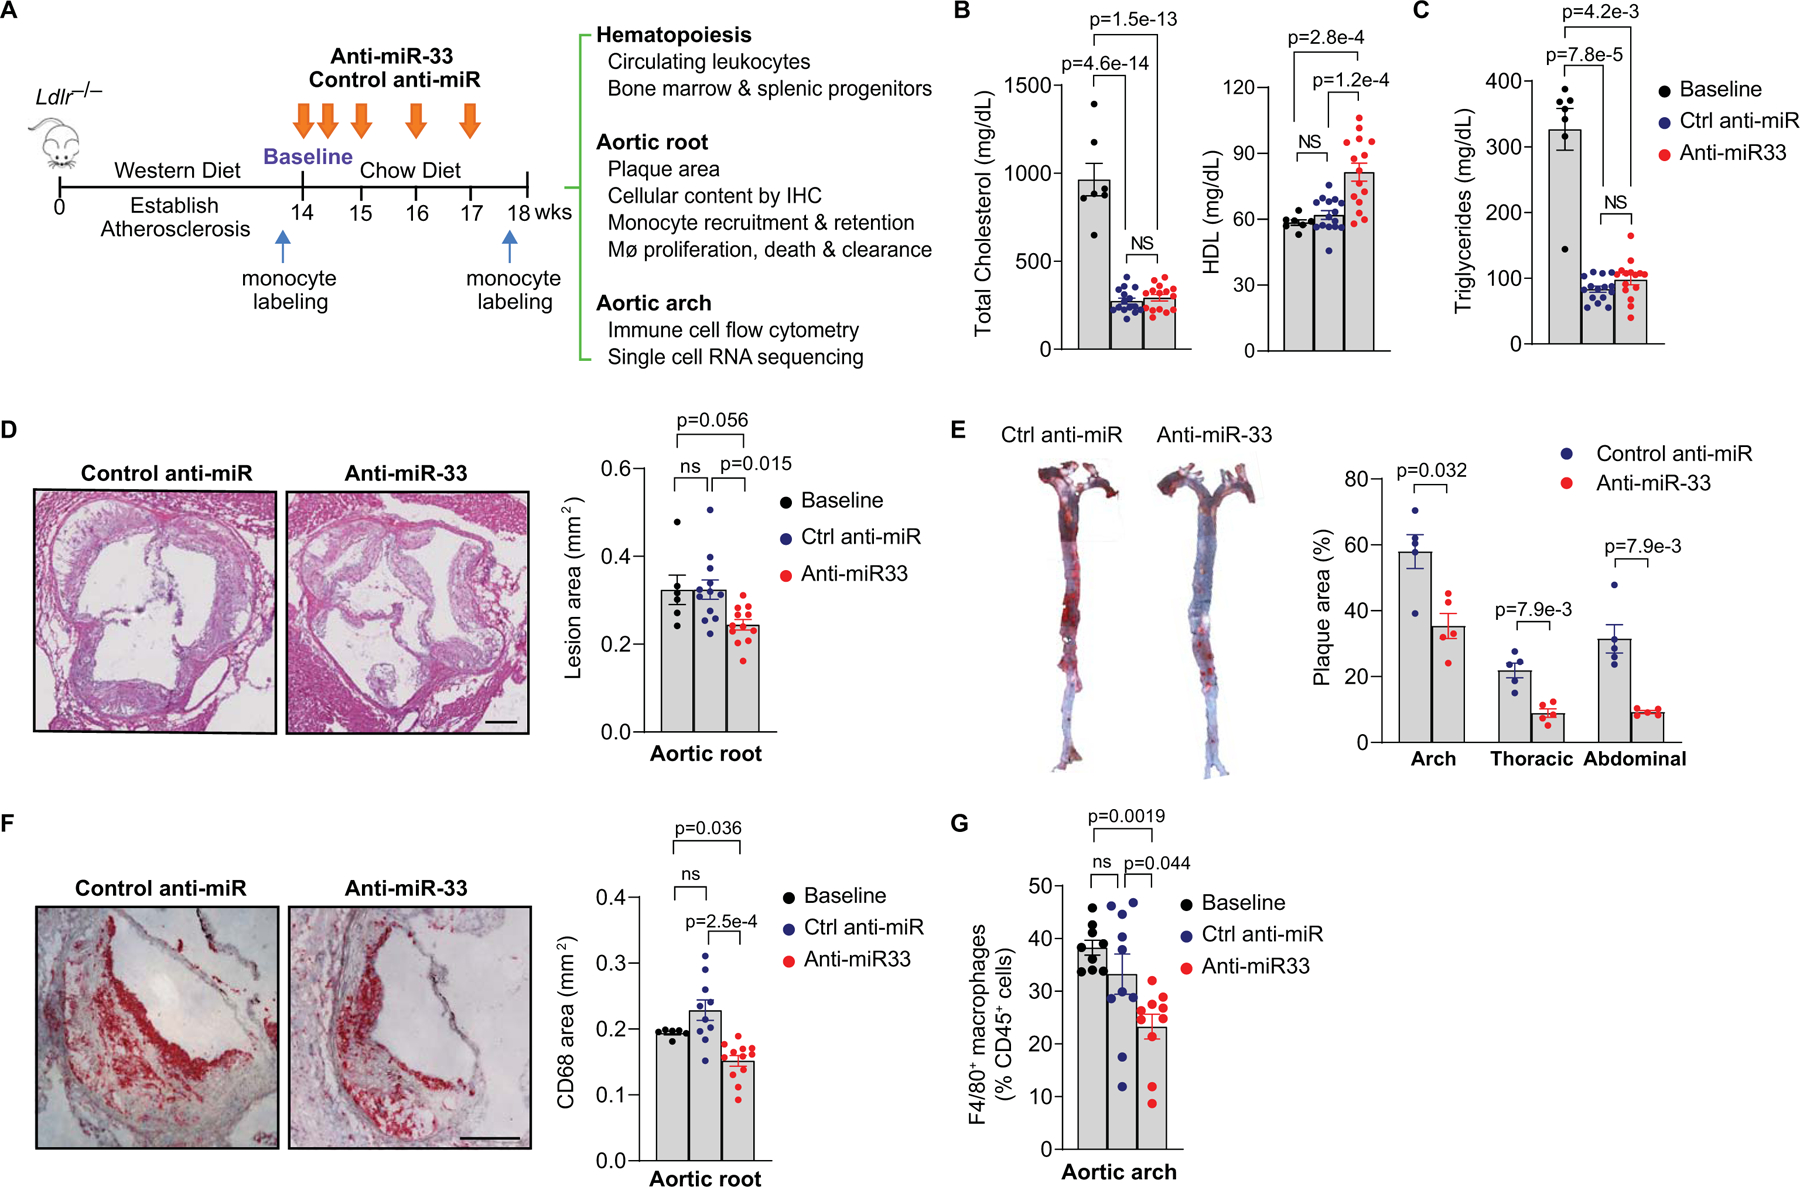
A) Experimental outline: Atherosclerosis was established in Ldlr−/− mice by feeding a western diet for 14 weeks (baseline), after which mice were treated with control anti-miR or anti-miR-33 for 4 weeks on chow diet. Monocyte labeling was performed at baseline to macrophage retention, or 3 days prior to the end of the treatment period to assess monocyte recruitment. B-C) Plasma levels of (B) total cholesterol (TC) and HDL cholesterol and (C) triglycerides (TG), (n=7 baseline, 15 control anti-miR and 15 anti-miR-33). D-E) Quantification of atherosclerotic lesion area in (D) cross-sections of the aortic root (Scale bar = 250 μm) (n= 6 baseline, 12 control anti-miR and 12 anti-miR-33) and (E) the aorta en face (n= 5 mice/group). F-G) Quantification of plaque macrophage content measured by (F) CD68 immunostaining of the aortic root (Scale bar = 250 μm) (n= 6 baseline, 10 control anti-miR and 12 anti-miR-33) and (G) flow cytometric analysis of F4/80 in the aortic arch (n= 9 baseline, 10 control anti-miR and 10 anti-miR-33). Representative images were selected to represent the mean value of each condition. (B-G) Data are the mean ± S.E.M. P values were determined by (B, D) one-way ANOVA with post-hoc Tukey’s test, (E) Mann-Whitney U-test or (C, F, G) Kruskal-Wallis with post-hoc Dunn’s test.
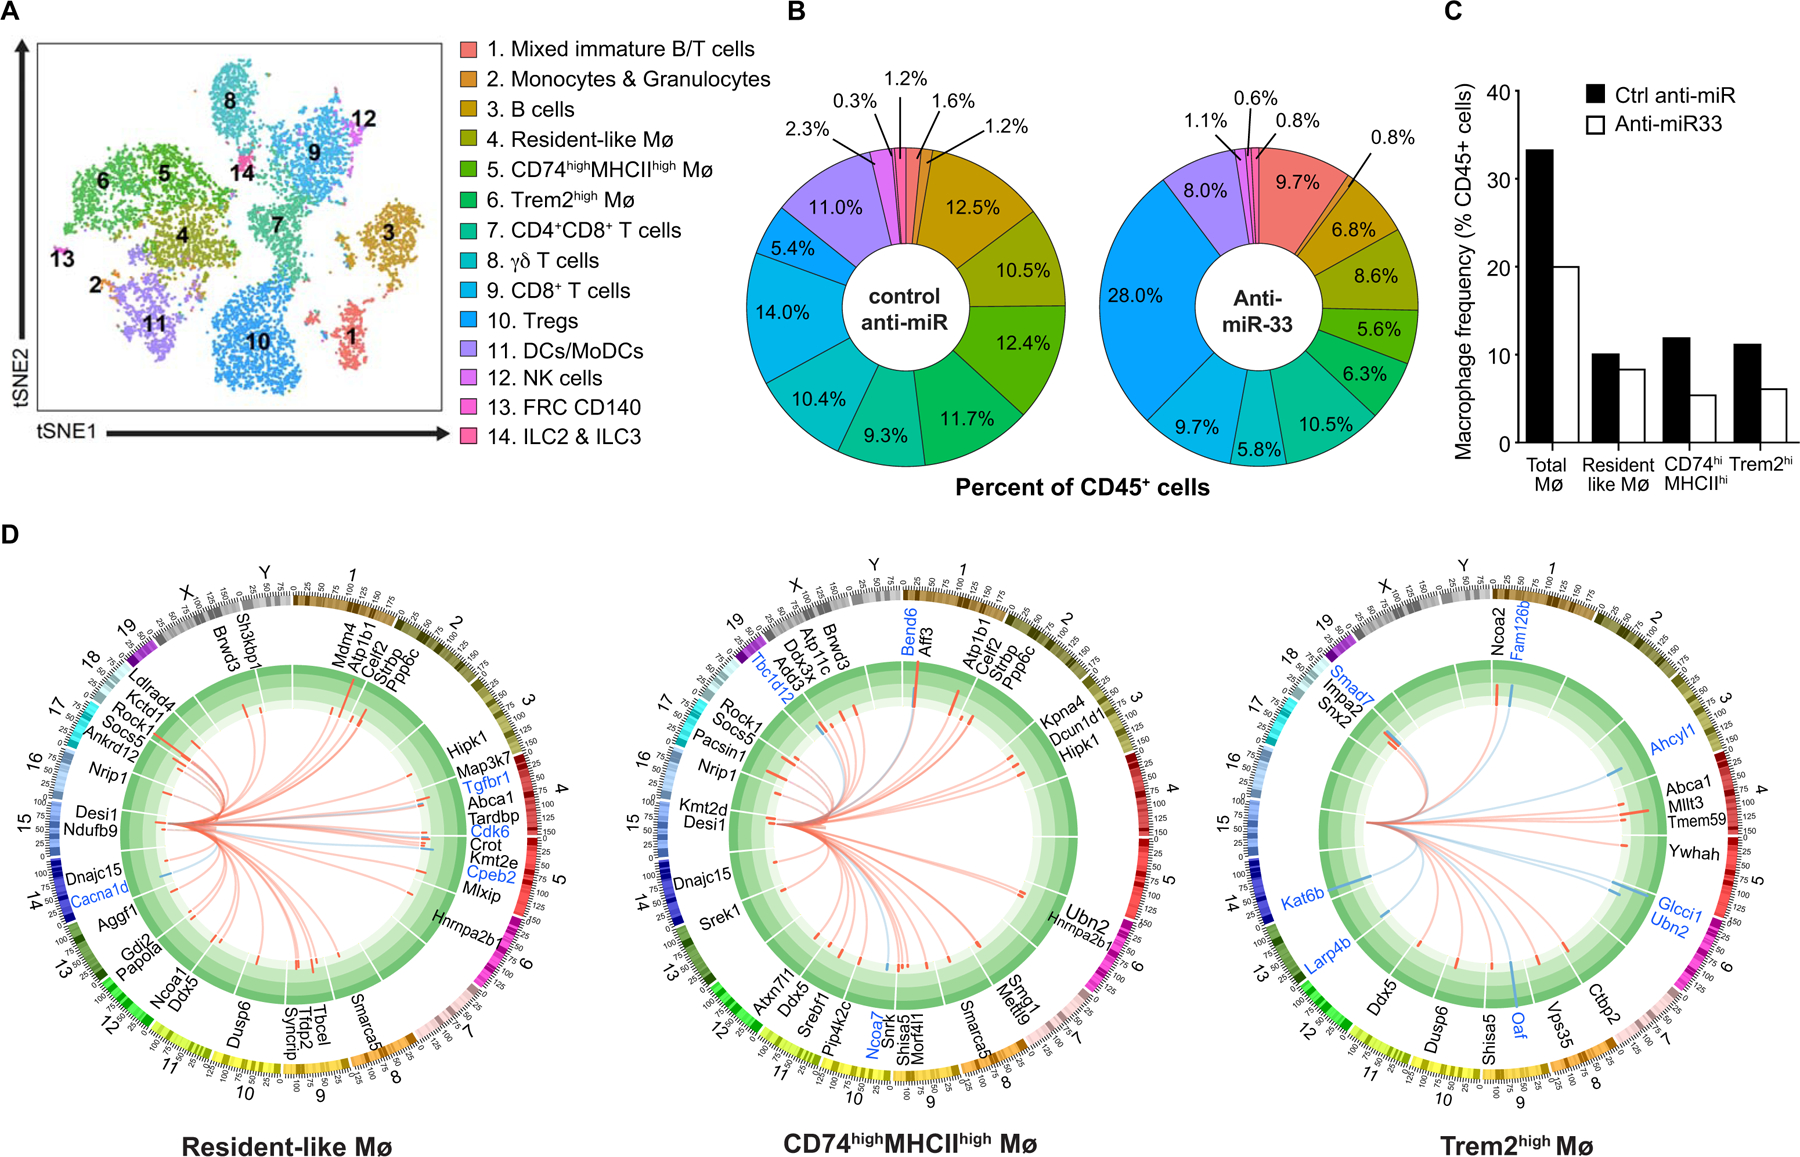
A) t-Stochastic neighbor embedding (t-SNE) plot showing clustering of aortic arch CD45+ cells based on gene expression. B) Immune cell frequencies in the aortic arches of mice treated with anti-miR-33 or control anti-miR. C) Frequency of the 3 macrophage clusters identified by single cell RNA-sequencing of CD45+ cells from the aortic arches of mice treated with anti-miR-33 or control anti-miR. D) Circos plots showing genome-wide differential expression of miR-33 target genes in each of the macrophage clusters. The inner track shows predicted miR-33 target genes that are upregulated (red arcs) or downregulated (blue arcs) in anti-miR-33 vs control anti-miR treatment. The outer track shows the chromosomal location of the miR-33 target genes. Data in A-D are from n=4 mice pooled/group; anti-miR-33 and control anti-miR.
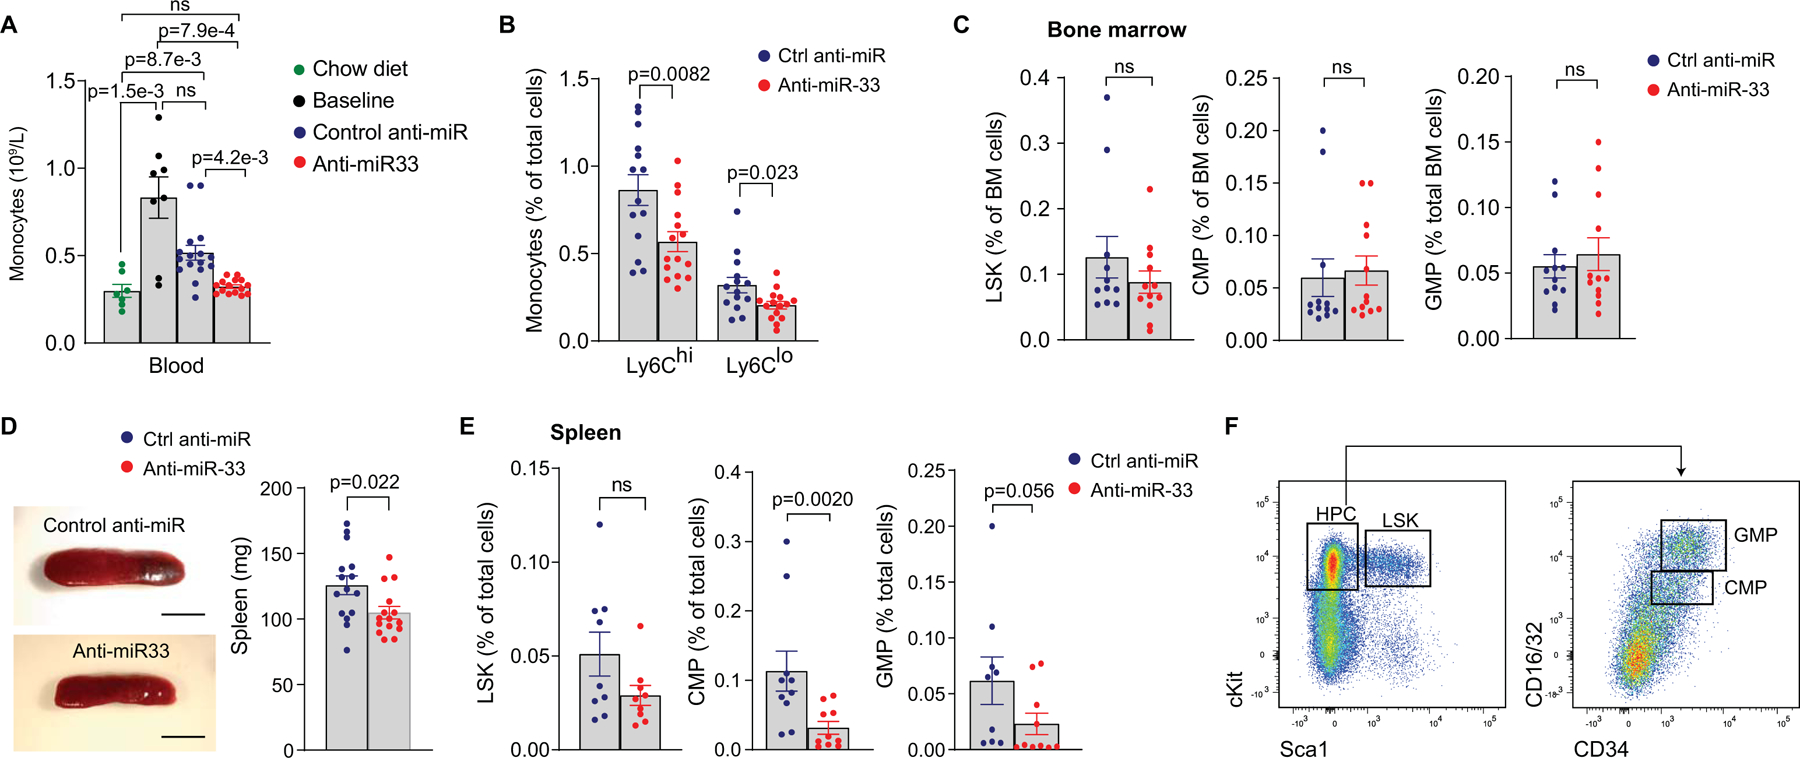
A) Blood levels of monocytes in Ldlr−/− mice fed chow diet, western diet for 14 weeks (Baseline), or after treatment with anti-miR-33 or control anti-miR for 4 weeks. n=7 chow diet, 8 baseline, 16 control anti-miR, 15 anti-miR-33. B) Flow cytometric analysis of Ly6Chi and Ly6Clo monocytes in the blood of atherosclerotic Ldlr−/− mice treated with anti-miR-33 (n=15) or control anti-miR (n=14). C) Flow cytometric analysis of bone marrow hematopoietic stem and progenitor cell populations (LSK, Lin–Sca+Kit– cells; CMP, common myeloid progenitor; GMP, granulocyte-myeloid progenitor, n=12 mice/group). D) Representative images and spleen weights from Ldlr−/− mice treated with anti-miR-33 or control anti-miR. n=15 mice/group. Scale 5 mm. E) Flow cytometric analysis of splenic hematopoietic stem and progenitor cell populations. n=9 control anti-miR and 10 anti-miR-33. F) Flow cytometry gating strategy for LSK, CMP and GMP cells in the bone marrow and spleen. Data in A-E are the mean ± SEM. P values were determined by Kruskal-Wallis with post-hoc Dunn’s test (A), Student’s t-test (B) or Mann-Whitney’s test (C-E). ns=not significant.
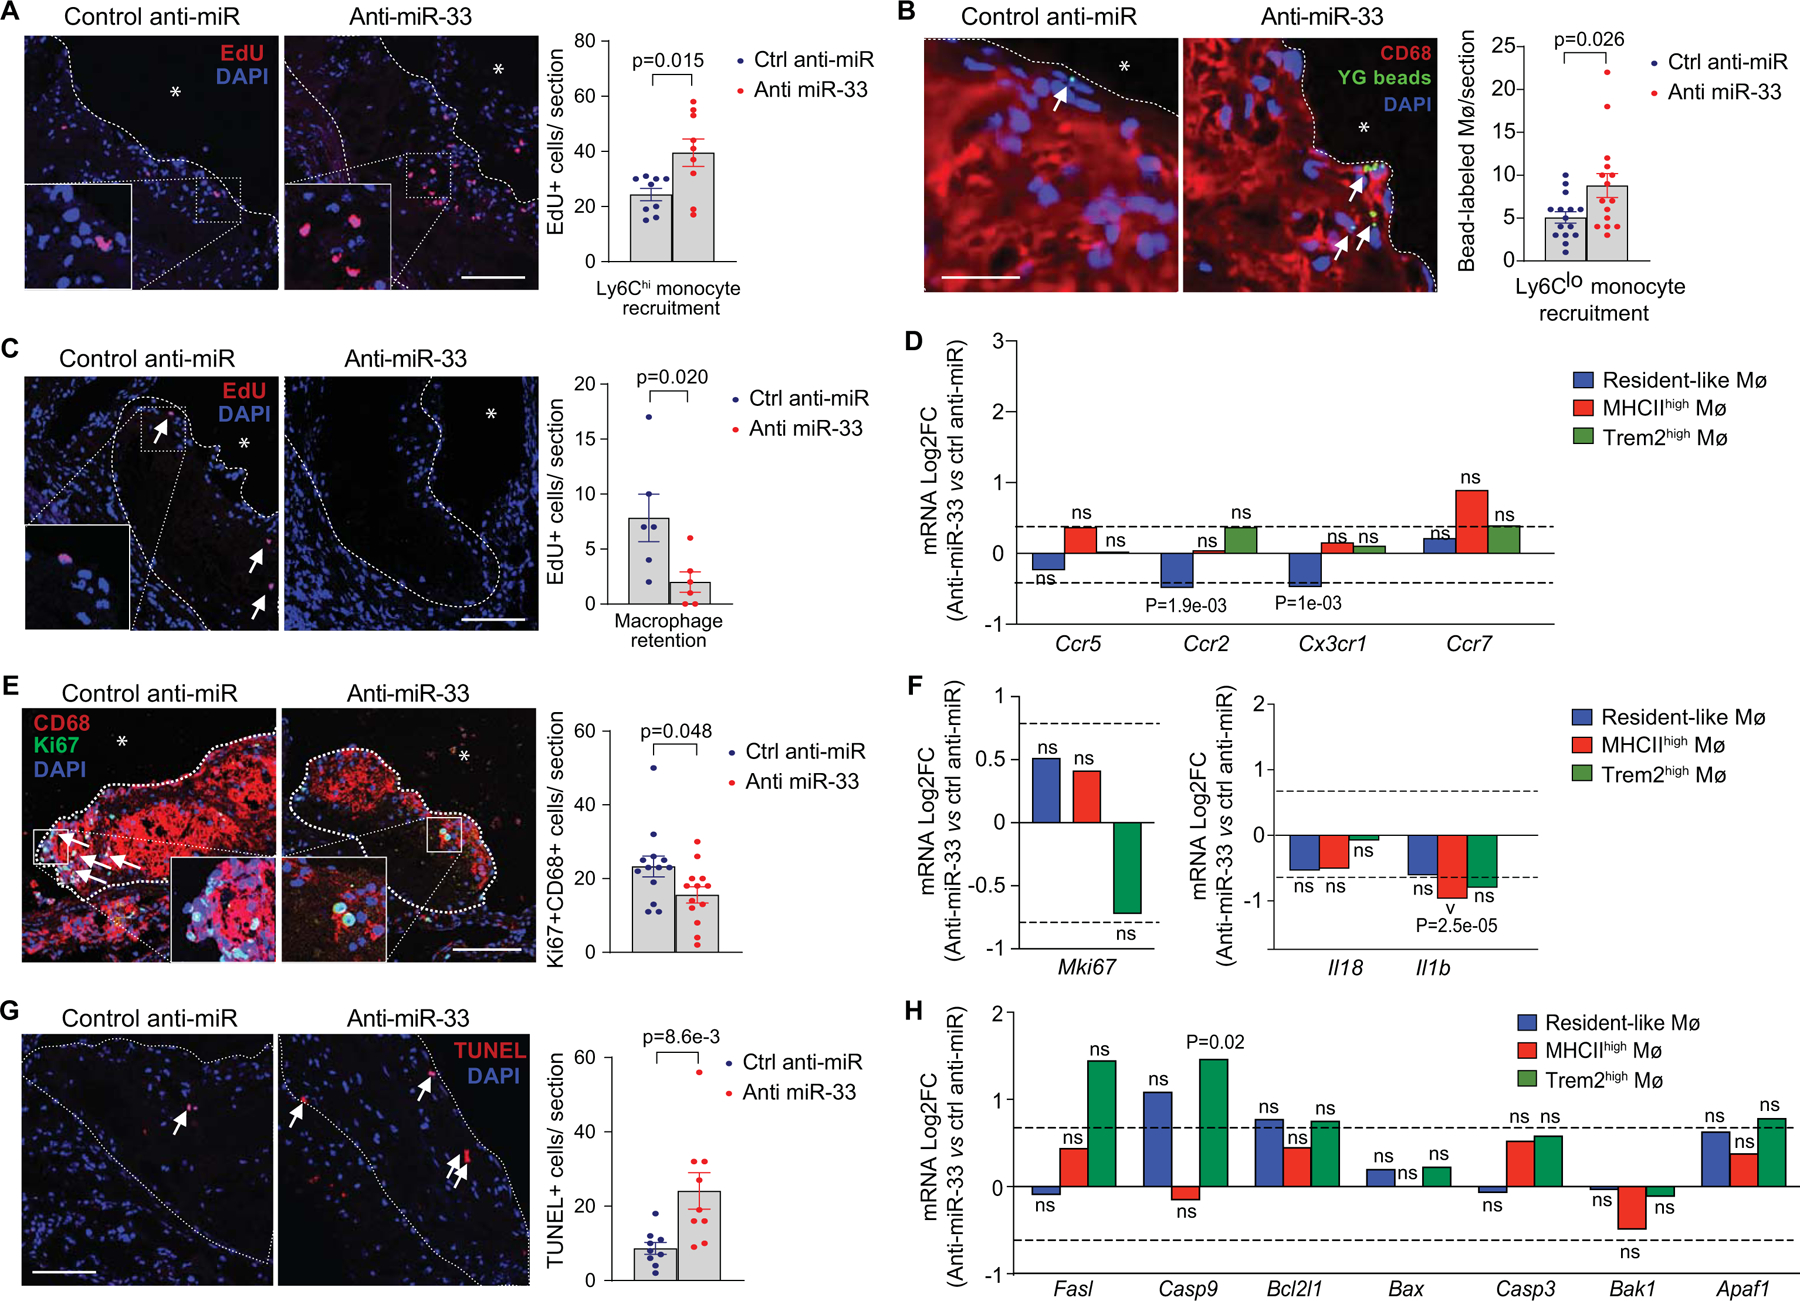
A-B) Representative images and quantification of (A) Edu-labeled Ly6Chi (n=9 mice/group, scale= 100 μm) and (B) fluorescent bead-labeled Ly6Clo (n = 15 mice/group, scale = 10 μm) monocytes recruited into aortic root plaques of Ldlr−/− mice treated with anti-miR-33 or control anti-miR. C) Representative images and quantification of Ly6Chi monocyte-derived macrophages (Edu+) retained in aortic root plaques after 4 weeks of anti-miR-33 or control anti-miR treatment. Scale bar = 100 μm (n = 6/group). D) Fold change in RNA-seq reads of genes involved in macrophage migration and retention in anti-miR33 vs control anti-miR treated mice by macrophage clusters. E) Representative images and quantification of immunostaining for the proliferation marker Ki67 and the macrophage marker CD68 in aortic root plaques of Ldlr−/− mice treated with anti-miR-33 or control anti-miR. Scale bar = 100 μm (n=13/group). F) Fold change in RNA-seq reads of proliferation and inflammatory genes in anti-miR-33 versus control anti-miR treated mice within the indicated aortic macrophage populations. G) Representative images and quantification of the apoptotic cell marker TUNEL in aortic root plaques of Ldlr−/− mice treated with anti-miR-33 or control anti-miR. (n=9 mice/group, scale = 100 μm). H) Fold change in RNA-seq reads of cell death-related genes in anti-miR33 vs control anti-miR treated mice by macrophage clusters (n=4 pooled mice/group in scRNA-seq). P values were determined by Mann-Whitney’s test (A, B, C, E) or by Student’s t-test (D, F, G, H). P values in D, F and H are unadjusted and represent significantly different gene expression presented in Log2FC for anti-miR-33 as compared to control anti-miR treatment in the indicated macrophage cluster. ns=not significant.
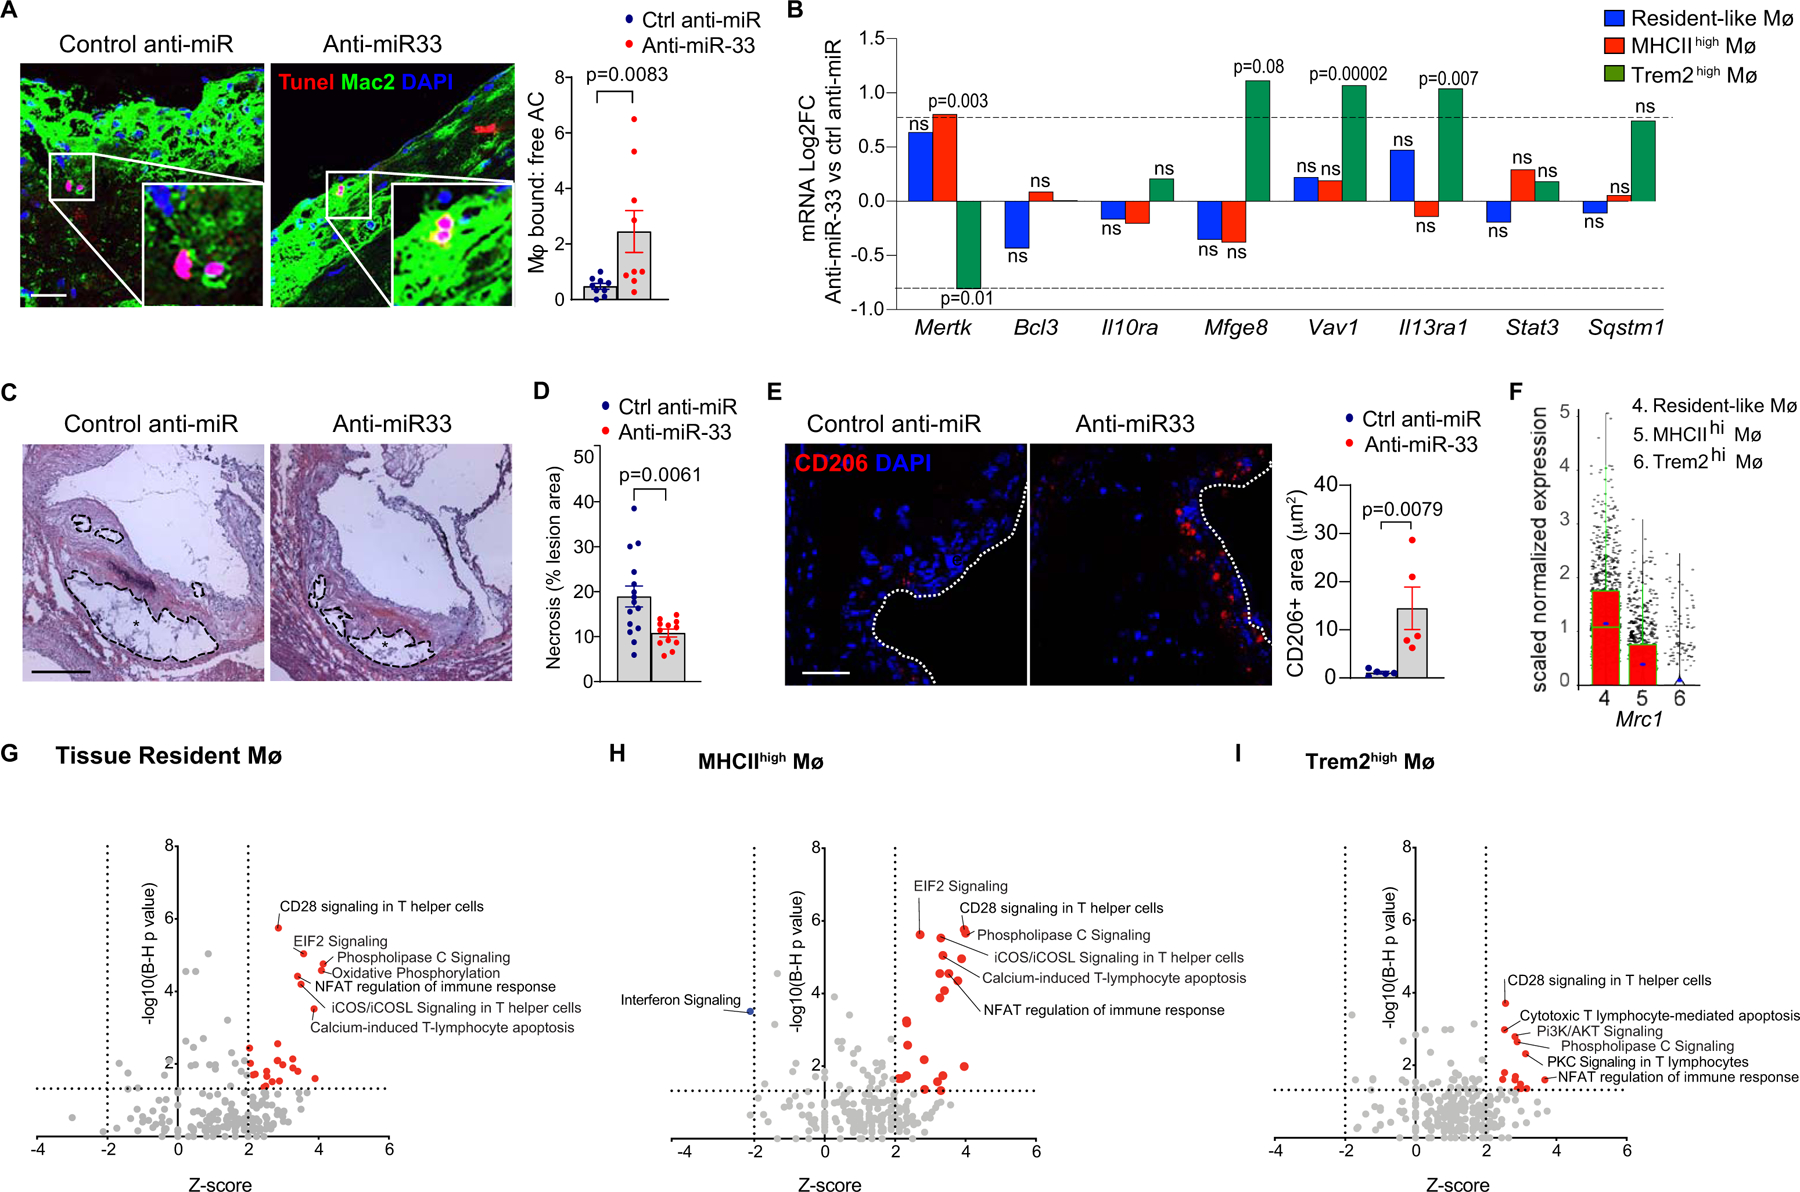
A) Representative images of costaining for the apoptosis marker TUNEL and the macrophage marker Mac-2, and quantification of macrophage-bound and free apoptotic cells to determine efferocytosis in aortic root plaques of Ldlr−/− mice treated with anti-miR-33 or control anti-miR (n=9 mice/group, scale = 25 μm). B) Fold change in RNA-seq reads of efferocytosis-related genes in anti-miR33 vs control anti-miR treated mice by macrophage clusters. P values were determined by Student’s t-test and represent significantly different gene expression presented in Log2FC for anti-miR-33 as compared to control anti-miR treatment in the indicated macrophage cluster. C-D) Quantification of necrotic area in hematoxylin and eosin stained aortic root plaques of mice treated with control anti-miR or anti-miR-33. Representative images shown in D. Scale bar = 250 μm. n=15 control anti-miR and 12 anti-miR-33. E) Representative images and quantification of immunostaining for the M2 macrophage marker CD206 (Mrc1) in aortic root plaques of Ldlr−/− mice treated with anti-miR-33 or control anti-miR. Scale bar = 25 μm. n=5 mice/group. Data in A, C, E are expressed as mean ± SEM. P values were determined by Mann-Whitney’s test (A, E) or Student’s t-test (D). F)
Mrc1 expression in immune cells clusters identified by single cell RNA sequencing of aortic arch CD45+ cells (n=4 mice/group pooled). G-I) Top enriched canonical pathways in aortic macrophage clusters of anti-miR-33 vs control anti-miR treated mice. Significant pathways were identified based on a 5% false discovery rate using the Benjamini-Hochberg procedure (B-H p-value <0.05) within the Canonical Pathways annotations by Ingenuity Pathway Analysis. Activated canonical pathways (Z score >2) are indicated by red filled dots, while inhibited pathways (Z-score <−2) are indicated by blue filled dots. Key pathways of interest are annotated. ns=not significant.
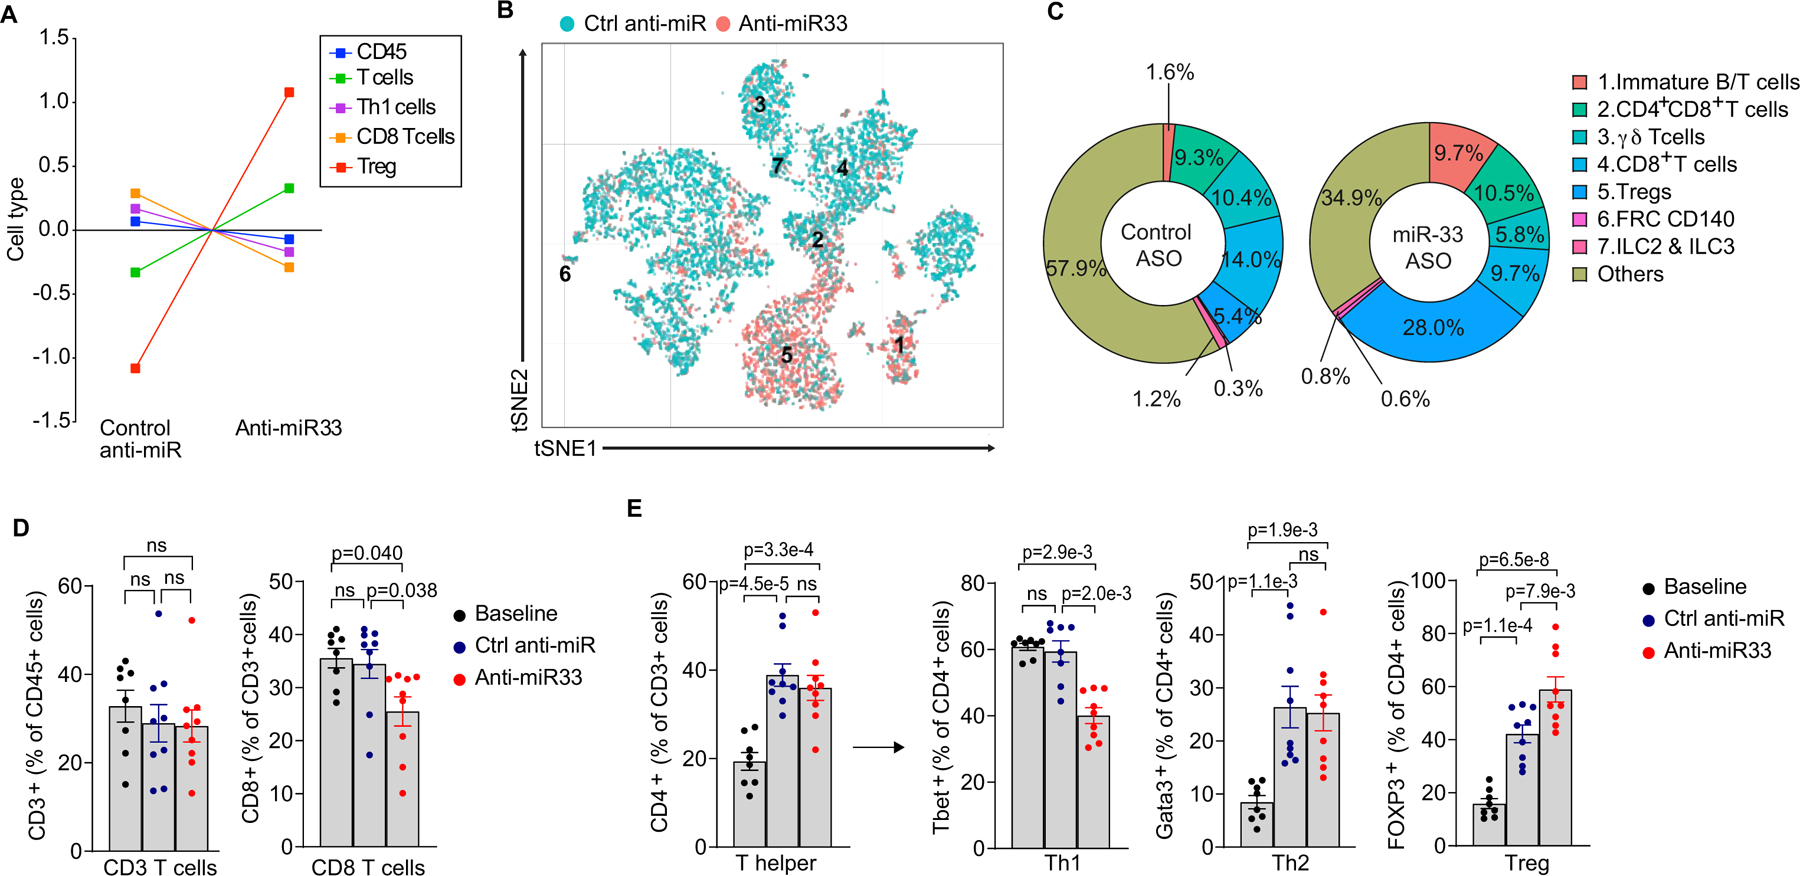
A) NanoString immune profiling gene set analysis of RNA from aortic arches of Ldlr−/− mice treated with anti-miR-33 or control anti-miR (n=6 mice/group). B) t-Stochastic neighbor embedding (t-SNE) plot showing clustering of T cells from the aortic arch of Ldlr−/− mice treated with anti-miR-33 or control anti-miR based on gene expression. n=4 mice pooled/group. C) Frequencies of the T cell clusters identified by single cell RNA-sequencing of CD45+ cells from the aortic arches of mice treated with anti-miR-33 or control anti-miR. D-E) Flow cytometric analysis of CD8+ and CD3+ T cells (D), and CD4+ T helper cell subsets (E) in aortic arches of mice treated with control anti-miR or anti-miR-33 (n=8 baseline, 9 control anti-miR and 9 anti-miR33). Data in D-E are presented as mean ± S.E.M. P values were determined by one-way ANOVA followed by post-hoc Tukey’s test for T cells, T helper cells and regulatory T cells or Kruskal-Wallis followed by Dunn’s test for Th1, Th2 and CD8 T cells. ns=not significant.
References
-
- Danesh J, Collins R, Appleby P and Peto R. Association of fibrinogen, C-reactive protein, albumin, or leukocyte count with coronary heart disease: meta-analyses of prospective studies. JAMA. 1998;279:1477–82. - PubMed
-
- Olivares R, Ducimetiere P and Claude JR. Monocyte count: a risk factor for coronary heart disease? Am J Epidemiol. 1993;137:49–53. - PubMed
Publication types
MeSH terms
Substances
Grants and funding
LinkOut - more resources
Full Text Sources
Other Literature Sources
Molecular Biology Databases
