. 2021 Feb 24;288(1945):20203168.
doi: 10.1098/rspb.2020.3168. Epub 2021 Feb 17.

Evidence for reduced immune gene diversity and activity during the evolution of termites

Affiliations

Evidence for reduced immune gene diversity and activity during the evolution of termites

Shulin He et al. Proc Biol Sci. .

Abstract

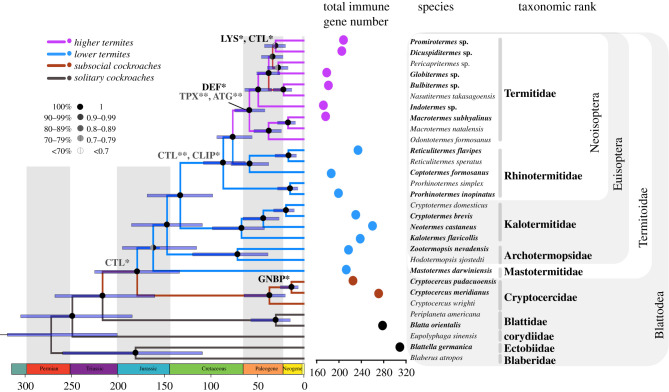
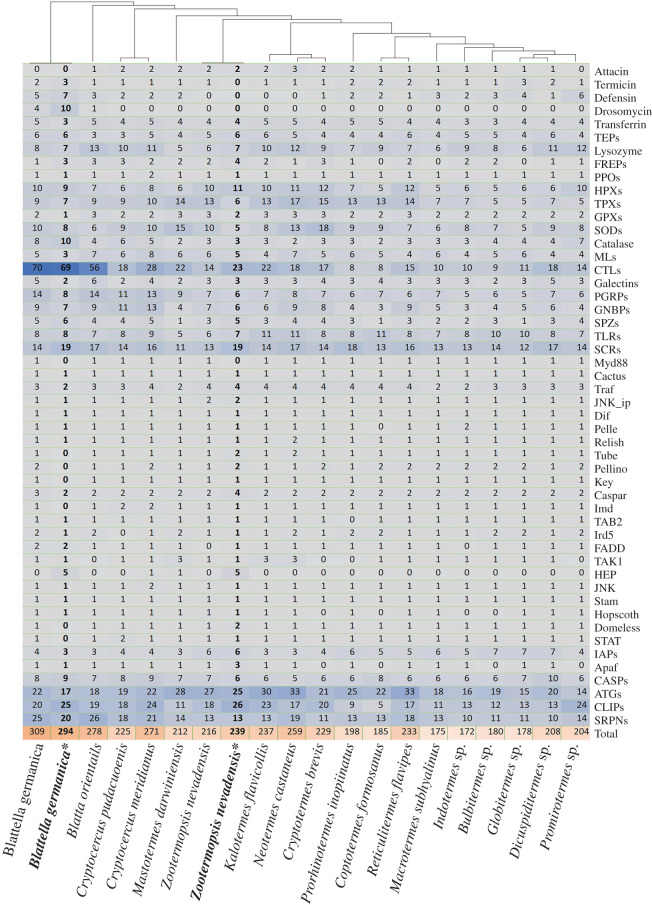
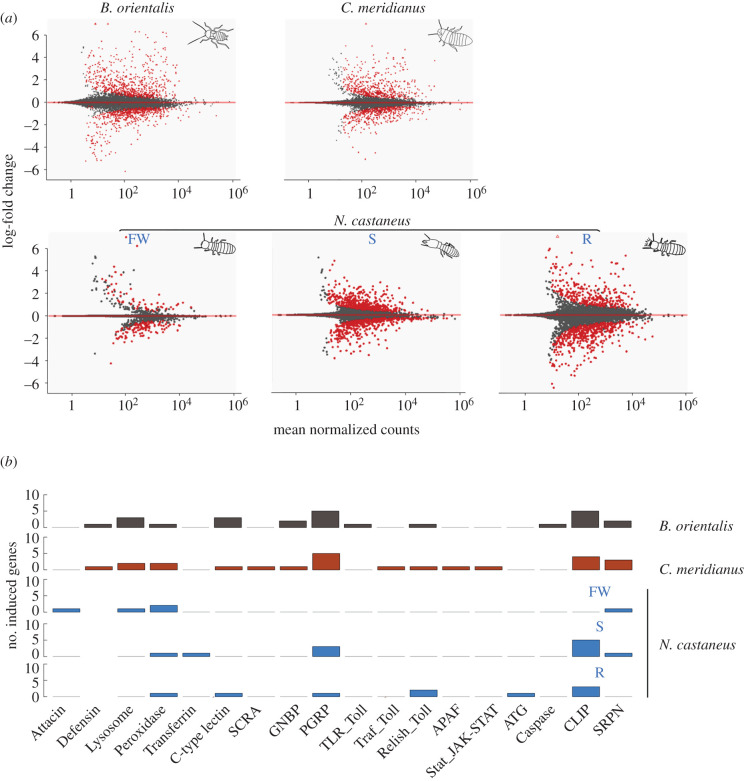
The evolution of biological complexity is associated with the emergence of bespoke immune systems that maintain and protect organism integrity. Unlike the well-studied immune systems of cells and individuals, little is known about the origins of immunity during the transition to eusociality, a major evolutionary transition comparable to the evolution of multicellular organisms from single-celled ancestors. We aimed to tackle this by characterizing the immune gene repertoire of 18 cockroach and termite species, spanning the spectrum of solitary, subsocial and eusocial lifestyles. We find that key transitions in termite sociality are correlated with immune gene family contractions. In cross-species comparisons of immune gene expression, we find evidence for a caste-specific social defence system in termites, which appears to operate at the expense of individual immune protection. Our study indicates that a major transition in organismal complexity may have entailed a fundamental reshaping of the immune system optimized for group over individual defence.

Keywords: cockroach; contraction; expansion; major transition; social insect; subsocial.


Figures

Figure 1.
Figure 1.
Phylogeny of termites and cockroaches alongside total numbers of identified immune genes. Gene family names in grey and black on the phylogeny indicate significant contractions and expansions of individual gene families, respectively. The gene family evolution analysis was conducted in CAFE. ATG, autophagy-related genes; CLIP, serine protease; CTL, C-type lectin; DEF, defensin; GNBP, gram-negative binding protein; LYS, lysozomes; TPX, thiroredoxin peroxidase. Significance levels of 0.05 (*) and 0.01 (**) are shown.
Figure 2.
Figure 2.
Predicted gene numbers in 50 immune gene families. *Gene sets of sequenced genomes were used to verify immune gene predictions from our de novo transcriptomic data.
Figure 3.
Figure 3.
Individual immune response following injection with a cocktail of heat-killed microorganisms versus an equivalent Ringer's solution. (a) MA plots of gene expression in B. orientalis and C. meridianus (upper panel) or each caste of N. castaneus: FW, false workers; S, soldiers; R, reproductives. Red dots in graphs represent differentially expressed genes. (b) Cross-species comparison of total number of significantly induced immune genes following experimental injection. Bars in grey, red and blue represent the solitary cockroach, B. orientalis, the subsocial cockroach, C. meridianus, and the social termite, N. castaneus, respectively. Gene families are categorized from left to right into immune effectors, receptors and signalling genes, respectively.
Figure 4.
Figure 4.
(a) A diagram of the social group experiment, indicating the design applied to the cockroach B. orientalis (upper panel) and the termite N. castaneus (lower panel). Individuals marked in grey represent focal individuals. FW, false workers; S, soldiers; R, reproductives. (b) MA plots of gene expression in B. orientalis conspecifics (upper panel) or each caste of N. castaneus nestmates following exposure to treated focal individuals. Red dots in graphs represent the differentially expressed genes. (c) Principal component analysis (PCA) of total immune gene expression across all three castes of N. castaneus from the social experiment, with points in red indicating social groups exposed to immune-challenged focal individuals. (d) A heatmap of differentially expressed immune genes following pairwise comparisons among castes. Expression levels of genes with up-pointing triangles are significantly higher than genes indicated in down-pointing triangles, whereas genes with triangles pointing in the same direction indicate non-significance. Genes marked with both an up- and down-pointing triangle are significantly differentially expressed compared with both other castes, whereas genes lacking a triangle are not significantly differentially expressed compared with both other castes.

References

    1. Pradeu T. 2011. The limits of the self: immunology and biological identity. Oxford, UK: Oxford University Press.
    1. Turnbull C, et al. 2011. Antimicrobial strength increases with group size: implications for social evolution. Biol. Lett. 7, 249-252. (10.1098/rsbl.2010.0719) - DOI - PMC - PubMed
    1. Hoggard SJ, Wilson PD, Beattie AJ, Stow AJ. 2011. Social complexity and nesting habits are factors in the evolution of antimicrobial defences in wasps. PLoS ONE 6, e21763. (10.1371/journal.pone.0021763) - DOI - PMC - PubMed
    1. Turnbull C, et al. 2012. Primordial enemies: fungal pathogens in thrips societies. PLoS ONE 7, e49737. (10.1371/journal.pone.0049737) - DOI - PMC - PubMed
    1. Barribeau SM, et al. 2015. A depauperate immune repertoire precedes evolution of sociality in bees. Genome Biol. 16, 83. (10.1186/s13059-015-0628-y) - DOI - PMC - PubMed

Publication types