Genome-wide analysis identifies critical DNA methylations within NTRKs genes in colorectal cancer
- PMID: 33593392
- PMCID: PMC7885252
- DOI: 10.1186/s12967-021-02740-6
Genome-wide analysis identifies critical DNA methylations within NTRKs genes in colorectal cancer
Abstract
Background: Neurotrophic tropomyosin receptor kinases (NTRKs) are a gene family function as oncogene or tumor suppressor gene in distinct cancers. We aimed to investigate the methylation and expression profiles and prognostic value of NTRKs gene in colorectal cancer (CRC).
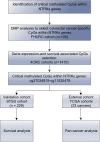
Methods: An analysis of DNA methylation and expression profiles in CRC patients was performed to explore the critical methylations within NTRKs genes. The methylation marker was validated in a retrospectively collected cohort of 229 CRC patients and tested in other tumor types from TCGA. DNA methylation status was determined by quantitative methylation-specific PCR (QMSP).
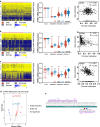
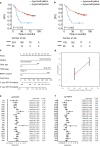
Results: The profiles in six CRC cohorts showed that NTRKs gene promoter was more frequently methylated in CRC compared to normal mucosa, which was associated with suppressed gene expression. We identified a specific methylated region within NTRK3 promoter targeted by cg27034819 and cg11525479 that best predicted survival outcome in CRC. NTRK3 promoter methylation showed independently predictive value for survival outcome in the validation cohort (P = 0.004, HR 2.688, 95% CI [1.355, 5.333]). Based on this, a nomogram predicting survival outcome was developed with a C-index of 0.705. Furthermore, the addition of NTRK3 promoter methylation improved the performance of currently-used prognostic model (AIC: 516.49 vs 513.91; LR: 39.06 vs 43.64, P = 0.032). Finally, NTRK3 promoter methylation also predicted survival in other tumors, including pancreatic cancer, glioblastoma and stomach adenocarcinoma.
Conclusions: This study highlights the essential value of NTRK3 methylation in prognostic evaluation and the potential to improve current prognostic models in CRC and other tumors.
Keywords: Colorectal cancer; Methylation; NTRK3; NTRKs; Prognosis.
Conflict of interest statement
The authors declared no potential conflicts of interest with respect to the research, authorship, and publication.
Figures


Similar articles
-
Methylation and expression patterns of tropomyosin-related kinase genes in different grades of glioma.Neuromolecular Med. 2014 Sep;16(3):529-39. doi: 10.1007/s12017-014-8303-0. Epub 2014 May 20. Neuromolecular Med. 2014. Retraction in: Neuromolecular Med. 2021 Dec;23(4):576. doi: 10.1007/s12017-021-08682-y. PMID: 24840578 Retracted.
-
NTRK3 is a potential tumor suppressor gene commonly inactivated by epigenetic mechanisms in colorectal cancer.PLoS Genet. 2013;9(7):e1003552. doi: 10.1371/journal.pgen.1003552. Epub 2013 Jul 11. PLoS Genet. 2013. PMID: 23874207 Free PMC article.
-
IGFBP3 gene promoter methylation analysis and its association with clinicopathological characteristics of colorectal carcinoma.Mol Biol Rep. 2020 Sep;47(9):6919-6927. doi: 10.1007/s11033-020-05747-2. Epub 2020 Sep 14. Mol Biol Rep. 2020. PMID: 32929656
-
Potential of RASSF1A promoter methylation as a biomarker for colorectal cancer: Meta-analysis and TCGA analysis.Pathol Res Pract. 2020 Aug;216(8):153009. doi: 10.1016/j.prp.2020.153009. Epub 2020 May 22. Pathol Res Pract. 2020. PMID: 32703486 Review.
-
A systematic review and quantitative assessment of methylation biomarkers in fecal DNA and colorectal cancer and its precursor, colorectal adenoma.Mutat Res Rev Mutat Res. 2019 Jan-Mar;779:45-57. doi: 10.1016/j.mrrev.2019.01.003. Epub 2019 Jan 16. Mutat Res Rev Mutat Res. 2019. PMID: 31097151
Cited by
-
Gene fusions and oncogenic mutations in MLH1 deficient and BRAFV600E wild-type colorectal cancers.Virchows Arch. 2022 Apr;480(4):807-817. doi: 10.1007/s00428-022-03302-x. Epub 2022 Mar 3. Virchows Arch. 2022. PMID: 35237889 Free PMC article.
-
Spatial deconvolution from bulk DNA methylation profiles determines intratumoral epigenetic heterogeneity.Cell Biosci. 2025 Jan 23;15(1):7. doi: 10.1186/s13578-024-01337-y. Cell Biosci. 2025. PMID: 39844296 Free PMC article.
-
Complexation of histone deacetylase inhibitor belinostat to Cu(II) prevents premature metabolic inactivation in vitro and demonstrates potent anti-cancer activity in vitro and ex vivo in colon cancer.Cell Oncol (Dordr). 2024 Apr;47(2):533-553. doi: 10.1007/s13402-023-00882-x. Epub 2023 Nov 7. Cell Oncol (Dordr). 2024. PMID: 37934338 Free PMC article.
-
NTRK fusion positive colorectal cancer is a unique subset of CRC with high TMB and microsatellite instability.Cancer Med. 2022 Jul;11(13):2541-2549. doi: 10.1002/cam4.4561. Epub 2022 May 4. Cancer Med. 2022. PMID: 35506567 Free PMC article.
-
Accelerated biological aging in COVID-19 patients.Nat Commun. 2022 Apr 19;13(1):2135. doi: 10.1038/s41467-022-29801-8. Nat Commun. 2022. PMID: 35440567 Free PMC article.
References
-
- Bray F, Ferlay J, Soerjomataram I, Siegel RL, Torre LA, Jemal A. Global Cancer Statistics 2018: GLOBOCAN estimates of incidence and mortality worldwide for 36 cancers in 185 countries. Cancer J Clin. 2018;68(6):394–424. - PubMed
-
- Torre LA, Bray F, Siegel RL, Ferlay J, Lortet-Tieulent J, Jemal A. Global cancer statistics, 2012. CA Cancer J Clin. 2015;65(2):87–108. - PubMed
-
- Abdel Ghafar MT, Gharib F, Abdel-Salam S, Elkhouly RA, Elshora A, Shalaby KH, et al. Role of serum Metadherin mRNA expression in the diagnosis and prediction of survival in patients with colorectal cancer. Mol Biol Rep. 2020;47(4):2509–2519. - PubMed
Publication types
MeSH terms
Substances
LinkOut - more resources
Full Text Sources
Other Literature Sources
Medical

