. 2021 Feb 16;25(1):65.
doi: 10.1186/s13054-021-03475-y.

The role of pro-opiomelanocortin in the ACTH-cortisol dissociation of sepsis

Affiliations

The role of pro-opiomelanocortin in the ACTH-cortisol dissociation of sepsis

Arno Téblick et al. Crit Care. .

Abstract

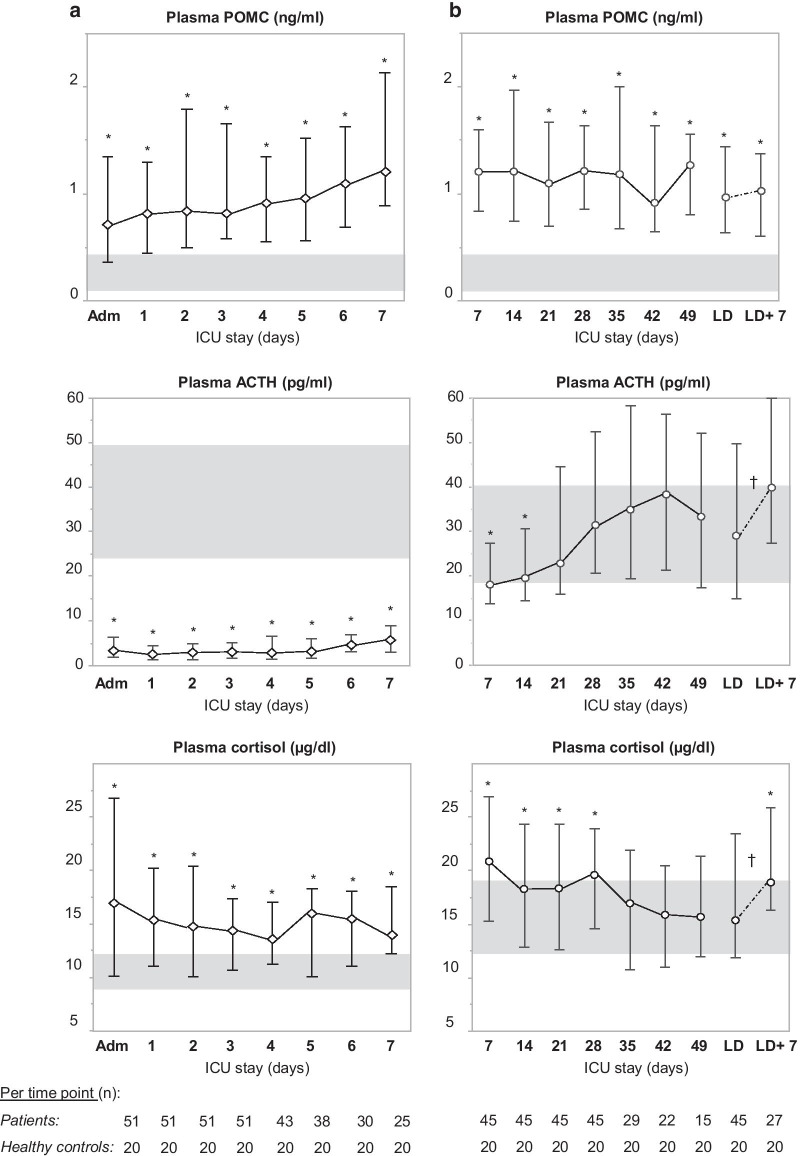
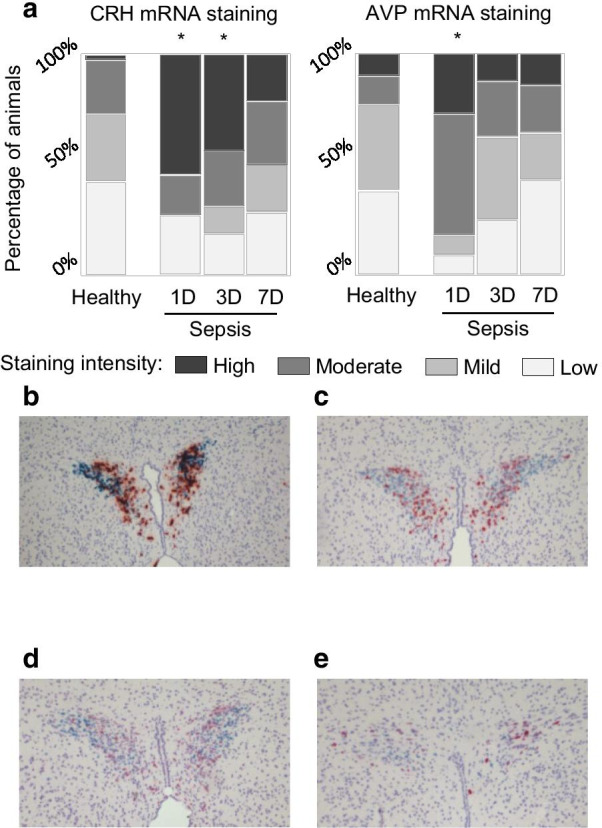
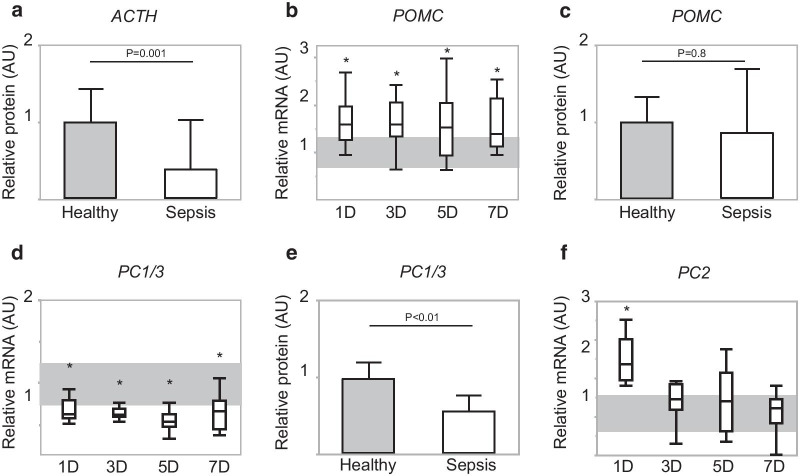
Background: Sepsis is typically hallmarked by high plasma (free) cortisol and suppressed cortisol breakdown, while plasma adrenocorticotropic hormone (ACTH) is not increased, referred to as 'ACTH-cortisol dissociation.' We hypothesized that sepsis acutely activates the hypothalamus to generate, via corticotropin-releasing hormone (CRH) and vasopressin (AVP), ACTH-induced hypercortisolemia. Thereafter, via increased availability of free cortisol, of which breakdown is reduced, feedback inhibition at the pituitary level interferes with normal processing of pro-opiomelanocortin (POMC) into ACTH, explaining the ACTH-cortisol dissociation. We further hypothesized that, in this constellation, POMC leaches into the circulation and can contribute to adrenocortical steroidogenesis.

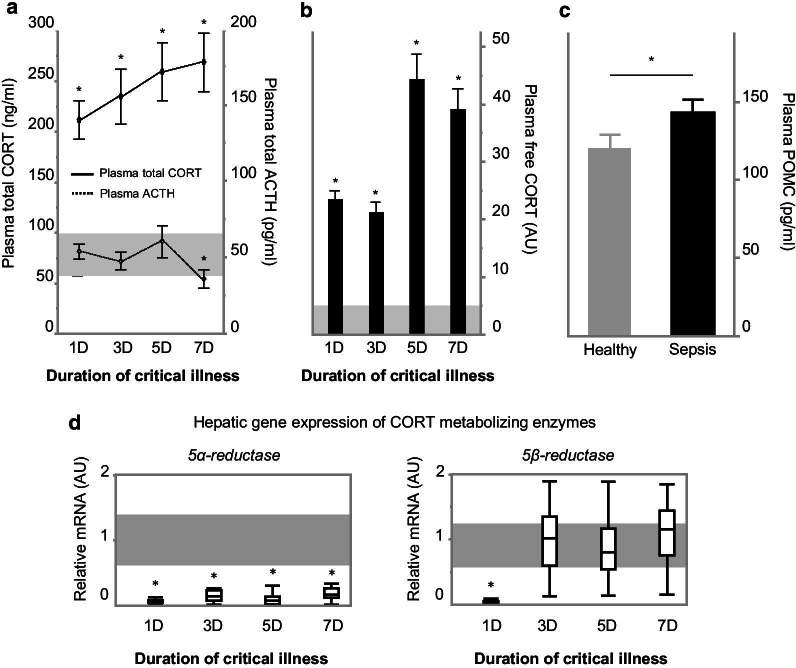
Methods: In two human studies of acute (ICU admission to day 7, N = 71) and prolonged (from ICU day 7 until recovery; N = 65) sepsis-induced critical illness, POMC plasma concentrations were quantified in relation to plasma ACTH and cortisol. In a mouse study of acute (1 day), subacute (3 and 5 days) and prolonged (7 days) fluid-resuscitated, antibiotic-treated sepsis (N = 123), we further documented alterations in hypothalamic CRH and AVP, plasma and pituitary POMC and its glucocorticoid-receptor-regulated processing into ACTH, as well as adrenal cortex integrity and steroidogenesis markers.

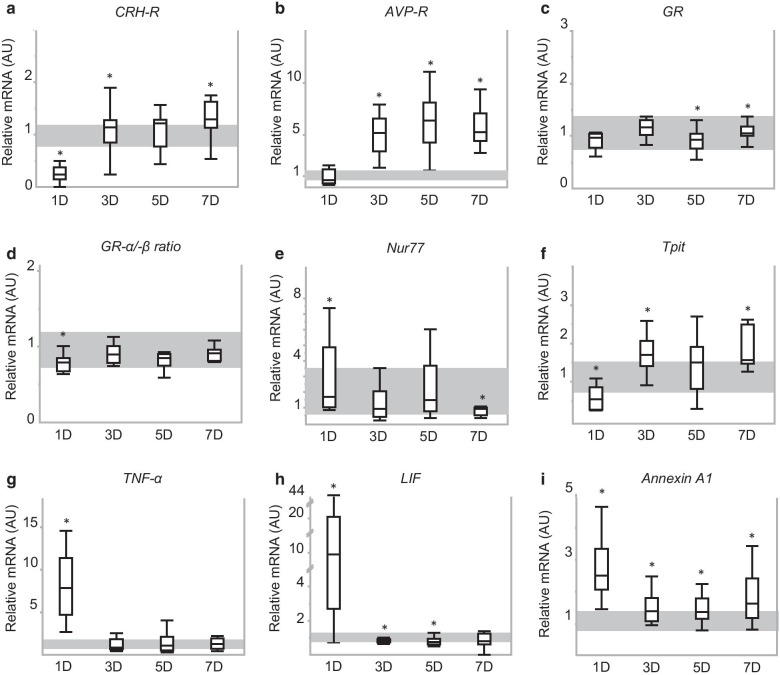
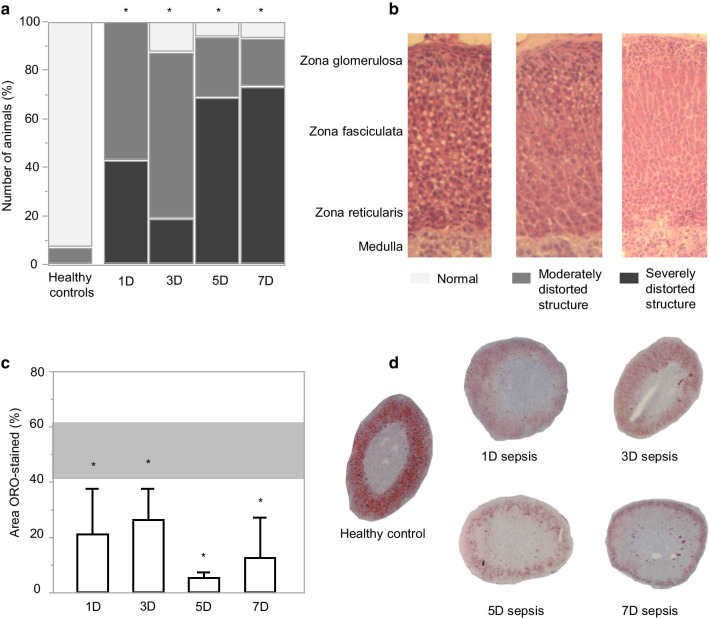
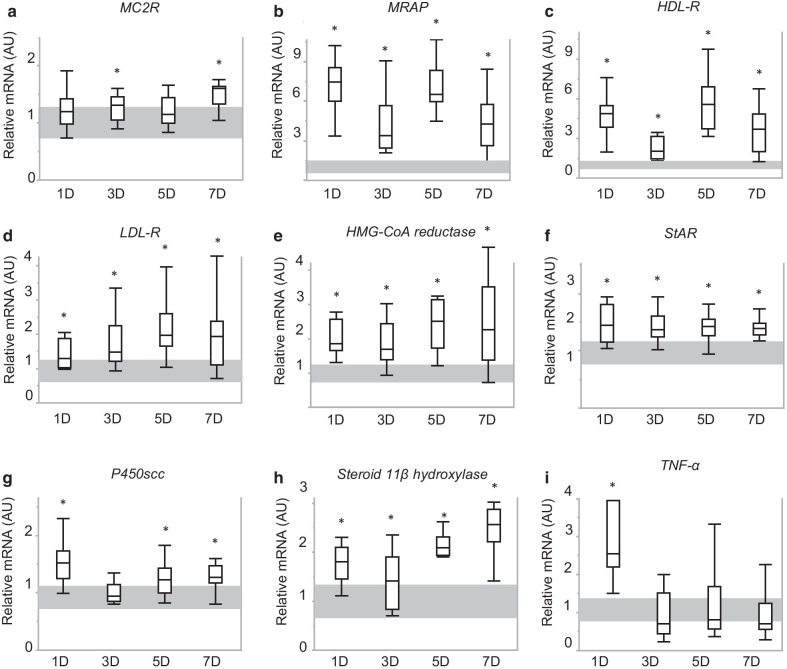
Results: The two human studies revealed several-fold elevated plasma concentrations of the ACTH precursor POMC from the acute to the prolonged phase of sepsis and upon recovery (all p < 0.0001), coinciding with the known ACTH-cortisol dissociation. Elevated plasma POMC and ACTH-corticosterone dissociation were confirmed in the mouse model. In mice, sepsis acutely increased hypothalamic mRNA of CRH (p = 0.04) and AVP (p = 0.03) which subsequently normalized. From 3 days onward, pituitary expression of CRH receptor and AVP receptor was increased. From acute throughout prolonged sepsis, pituitary POMC mRNA was always elevated (all p < 0.05). In contrast, markers of POMC processing into ACTH and of ACTH secretion, negatively regulated by glucocorticoid receptor ligand binding, were suppressed at all time points (all p ≤ 0.05). Distorted adrenocortical structure (p < 0.05) and lipid depletion (p < 0.05) were present, while most markers of adrenocortical steroidogenic activity were increased at all time points (all p < 0.05).

Conclusion: Together, these findings suggest that increased circulating POMC, through CRH/AVP-driven POMC expression and impaired processing into ACTH, could represent a new piece in the puzzling ACTH-cortisol dissociation.

Keywords: Adrenal; Adrenocorticotropic hormone; Glucocorticoid receptor; Pituitary; Pro-opiomelanocortin; Sepsis.


Conflict of interest statement

All authors declare that there is no conflict of interest to report.

Figures

Fig. 1
Fig. 1
Plasma cortisol, ACTH and POMC concentrations in critically ill patients. a During the first week of critical illness (human sepsis study 1). b Beyond the first week of critical illness (human sepsis study 2). Top panels display morning plasma POMC concentrations, middle panels morning plasma ACTH concentrations and lower panels morning plasma cortisol concentrations. Diamonds (study 1) and circles (study 2) and whiskers represent median and interquartile ranges of plasma POMC concentrations of critically ill patients per day. The solid line connects the medians of each day. The light gray area represents the interquartile range of morning values in healthy controls (n = 20). The dashed line represents the interval between the median concentration of cortisol, ACTH or POMC during the last ICU day and those of the sample taken seven days after ICU discharge. *p < 0.05 between critically ill patients and healthy controls. †p < 0.05 between LD and LD + 7 (within-subjects effect of time)
Fig. 2
Fig. 2
Plasma (free) CORT, ACTH and POMC concentrations and hepatic gene expression of A ring reductases. a Diamonds and whiskers represent plasma total corticosterone concentrations (full line, linear scale on the left Y-axis, ng/ml) and plasma ACTH concentrations (dashed line, linear scale on the right Y-axis, pg/ml). b Bars represent estimated free corticosterone levels (linear scale on the right Y-axis, AU: fold of healthy control). Shaded gray area represents healthy reference range (mean ± SEM of the healthy control groups over all days). c Bars represent plasma POMC concentrations (linear scale on the right Y-axis, pg/ml). All data are presented as mean ± SEM. d Gene expression of hepatic CORT-metabolizing enzymes 5α- and 5β-reductase. Box-and-whiskers represent median and interquartile ranges (AU: fold of healthy control).*p ≤ 0.05 between sepsis and healthy control mice. AU, arbitrary units; D, days
Fig. 3
Fig. 3
CRH and AVP mRNA expression in the hypothalamic paraventricular nucleus. a Semiquantitative scoring of CRH mRNA expression (left panel) and AVP mRNA expression (right panel). Data are represented as cumulative percentages of the respective group. *p < 0.05 as compared to healthy control mice. be Representative examples of in situ hybridization stained cross-hypothalamic sections scored high (b), moderate (c), mild (d) and low (e) with blue staining for CRH and red staining for AVP. D, days
Fig. 4
Fig. 4
Pituitary expression of POMC and ACTH and of the processing enzymes PC1/3 and PC2. a Relative pituitary protein expression of ACTH. b Relative pituitary gene expression of POMC. c Relative pituitary protein expression of POMC. d Relative pituitary gene expression of PC1/3. e Relative pituitary protein expression of PC1/3. f Relative pituitary gene expression of PC2. All bars and whiskers represent median and interquartile range. For panels a, c and e, healthy controls are represented as box-and-whisker plots. For panels b and d, shaded gray area represents average interquartile range of the healthy controls over all days. *p ≤ 0.05 compared to the healthy control mice. AU, arbitrary units; D, days
Fig. 5
Fig. 5
Expression of mediators of POMC or PC1/3 expression. ai Relative pituitary gene expression of receptors and transcription factors known to regulate POMC and PC1/3 expression: CRH-R (a), AVP-R (b), GR (c), GRα/β ratio (d), Nur77 (e), Tpit (f), TNF-α (g), LIF (h) and Annexin A1 (i). Bars and whiskers represent median and interquartile range. Shaded gray area represents interquartile range of the controls. *p ≤ 0.05 compared to the healthy control mice. AU, arbitrary units; D, days
Fig. 6
Fig. 6
Adrenocortical architecture and adrenal cholesterol ester storage. a Semiquantitative scoring of adrenal architecture. Data are represented as cumulative percentages of the respective group. b Representative examples of HE stained images for each score. c Adrenal cholesterol ester storage quantification. Bars and whiskers represent median and 75th quartile percentage of ORO-stained area relative to total adrenal area. Horizontal gray box represents the interquartile range of the healthy controls. d Representative examples of ORO-stained sections of the healthy groups, acute phase (1-day sepsis group), subacute phases (3- and 5-day sepsis group) and prolonged phase of critical illness (7-day sepsis group). *p < 0.05 as compared to the respective healthy control group. D, days
Fig. 7
Fig. 7
Expression of markers and regulators of adrenal steroidogenesis. ai Relative adrenal gene expression of markers and regulators of adrenal steroidogenesis: MC2R (a), MRAP (b), HDL-R (c), LDL-R (d), HMG-CoA reductase (e), StAR (f), P450scc (g), steroid 11β dehydrogenase (h) and TNF-α (i). Bars and whiskers represent median and interquartile range. Shaded gray area represents interquartile range of the controls. *p ≤ 0.05 compared to the healthy control group mice. AU, arbitrary units; D, days

Similar articles

Cited by

References

    1. Boonen E, Vervenne H, Meersseman P, Andrew R, Mortier L, Declercq PE, et al. Reduced cortisol metabolism during critical illness. N Engl J Med. 2013;368(16):1477–1488. doi: 10.1056/NEJMoa1214969. - DOI - PMC - PubMed
    1. Teblick A, Peeters B, Langouche L, Van den Berghe G. Adrenal function and dysfunction in critically ill patients. Nat Rev Endocrinol. 2019;15(7):417–427. doi: 10.1038/s41574-019-0185-7. - DOI - PubMed
    1. Russell G, Lightman S. The human stress response. Nat Rev Endocrinol. 2019;15(9):525–534. doi: 10.1038/s41574-019-0228-0. - DOI - PubMed
    1. Cain DW, Cidlowski JA. Immune regulation by glucocorticoids. Nat Rev Immunol. 2017;17(4):233–247. doi: 10.1038/nri.2017.1. - DOI - PMC - PubMed
    1. Yang S, Zhang L. Glucocorticoids and vascular reactivity. Curr Vasc Pharmacol. 2004;2(1):1–12. doi: 10.2174/1570161043476483. - DOI - PubMed

Publication types