. 2021 Apr 15;81(8):2086-2100.
doi: 10.1158/0008-5472.CAN-20-2218. Epub 2021 Feb 16.

Therapeutic Targeting of DGKA-Mediated Macropinocytosis Leads to Phospholipid Reprogramming in Tuberous Sclerosis Complex

Affiliations

Therapeutic Targeting of DGKA-Mediated Macropinocytosis Leads to Phospholipid Reprogramming in Tuberous Sclerosis Complex

Andrii Kovalenko et al. Cancer Res. .

Abstract

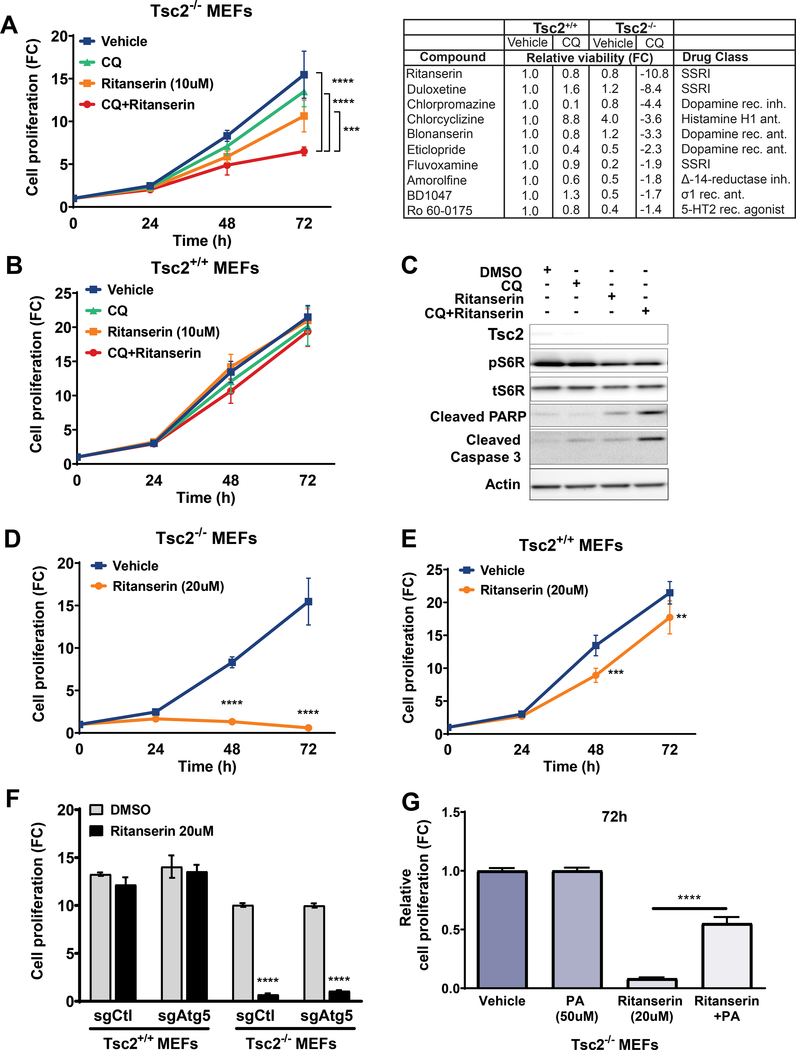
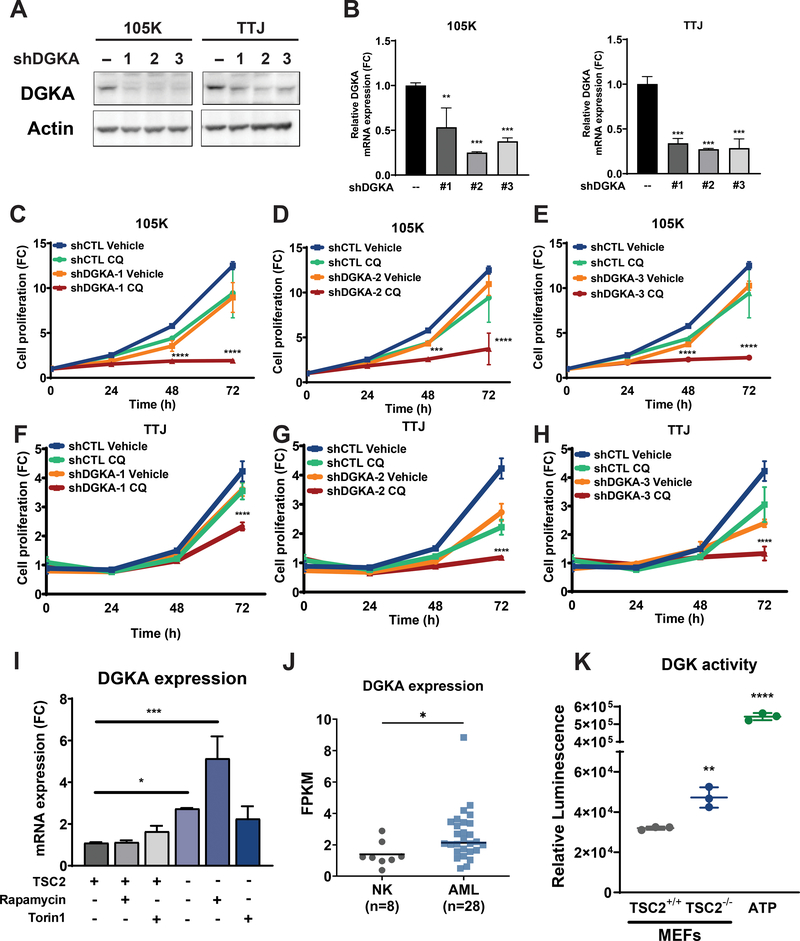
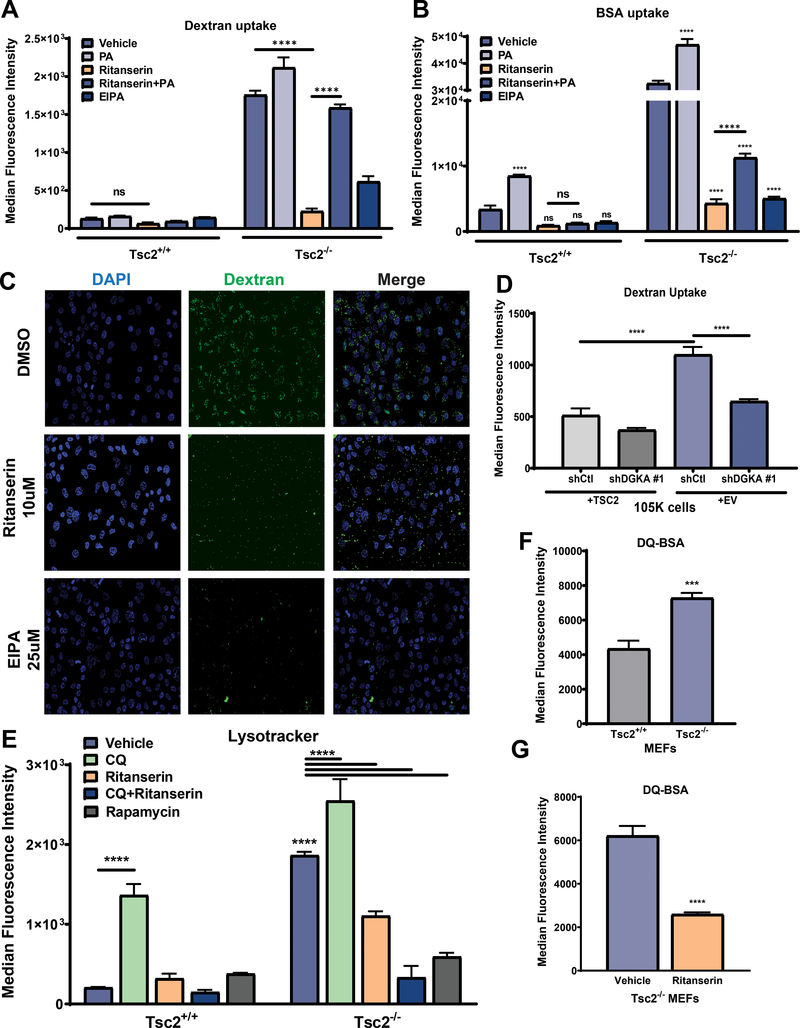
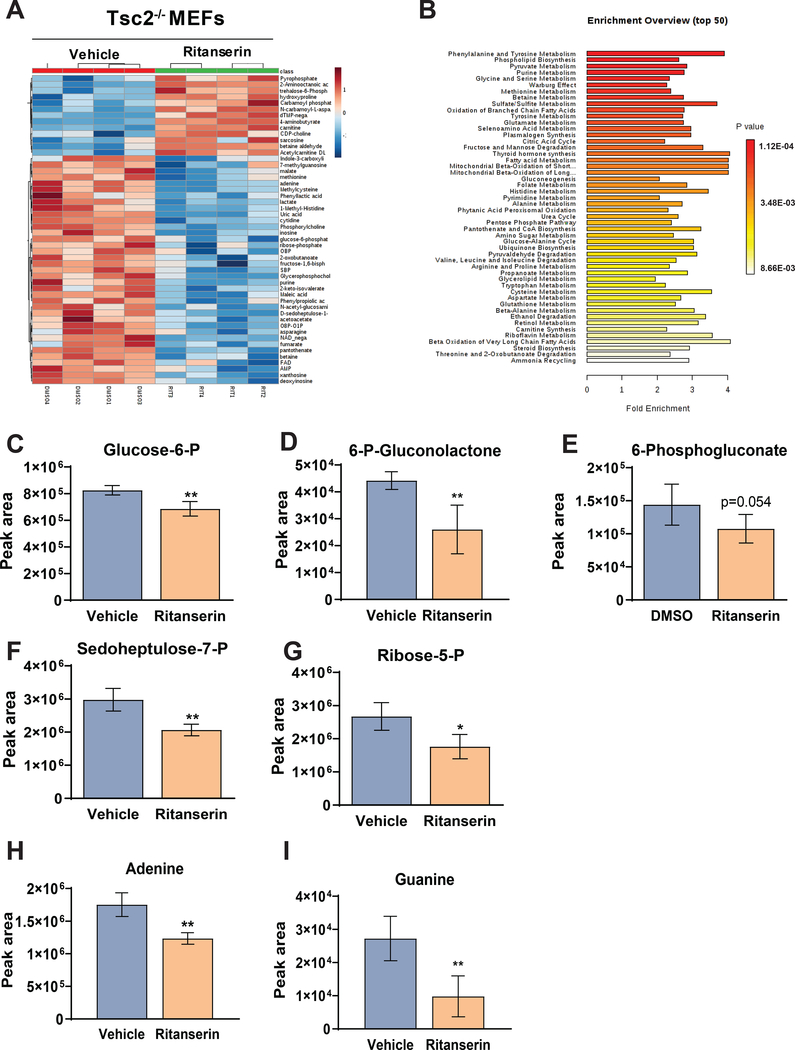
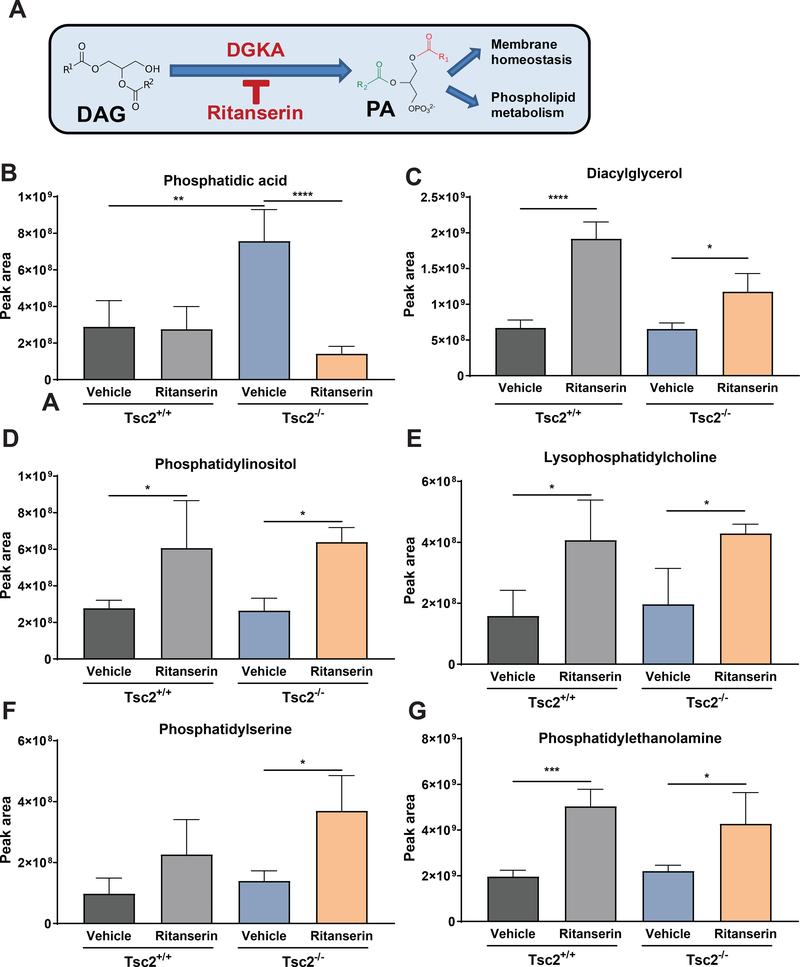
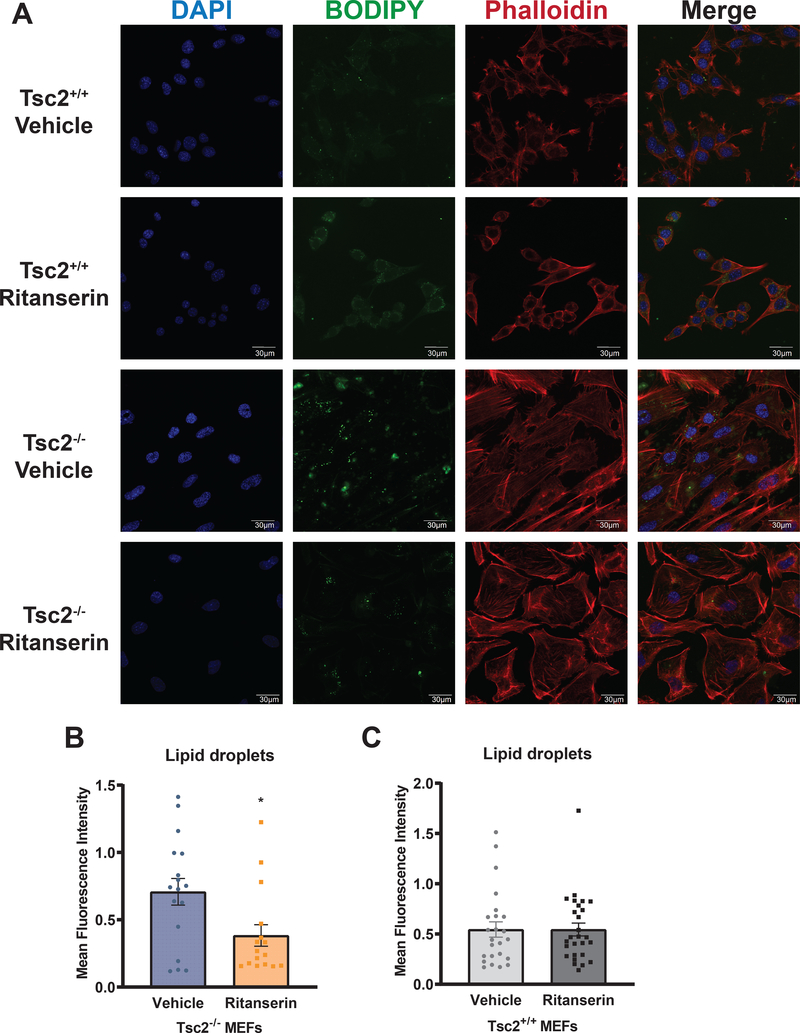
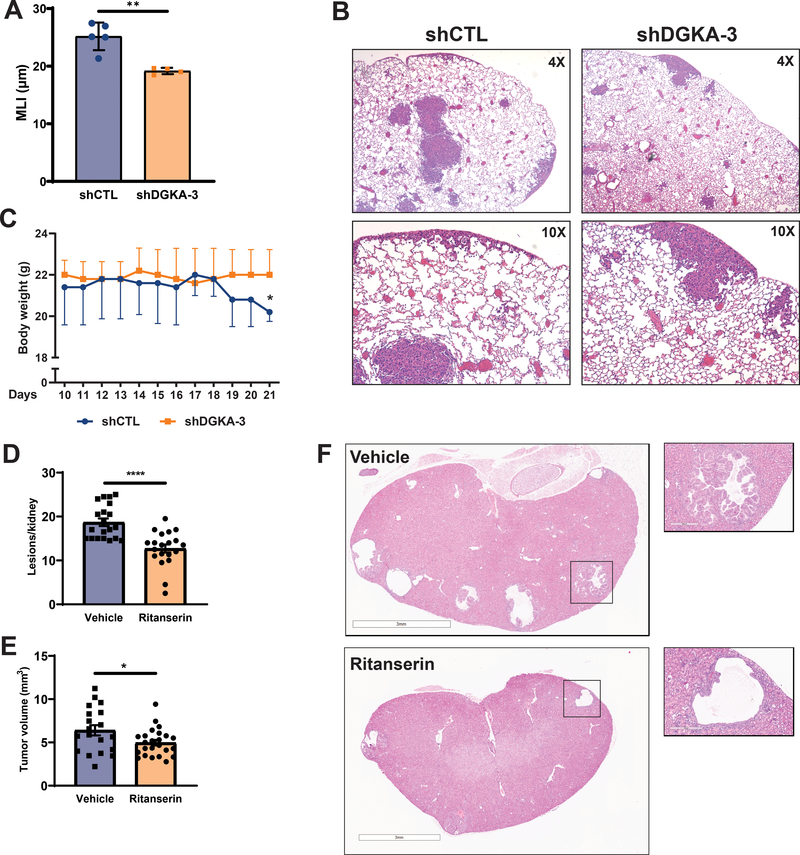
Lymphangioleiomyomatosis is a rare destructive lung disease affecting primarily women and is the primary lung manifestation of tuberous sclerosis complex (TSC). In lymphangioleiomyomatosis, biallelic loss of TSC1/2 leads to hyperactivation of mTORC1 and inhibition of autophagy. To determine how the metabolic vulnerabilities of TSC2-deficient cells can be targeted, we performed a high-throughput screen utilizing the "Repurposing" library at the Broad Institute of MIT and Harvard (Cambridge, MA), with or without the autophagy inhibitor chloroquine. Ritanserin, an inhibitor of diacylglycerol kinase alpha (DGKA), was identified as a selective inhibitor of proliferation of Tsc2-/- mouse embryonic fibroblasts (MEF), with no impact on Tsc2+/+ MEFs. DGKA is a lipid kinase that metabolizes diacylglycerol to phosphatidic acid, a key component of plasma membranes. Phosphatidic acid levels were increased 5-fold in Tsc2-/- MEFs compared with Tsc2+/+ MEFs, and treatment of Tsc2-/- MEFs with ritanserin led to depletion of phosphatidic acid as well as rewiring of phospholipid metabolism. Macropinocytosis is known to be upregulated in TSC2-deficient cells. Ritanserin decreased macropinocytic uptake of albumin, limited the number of lysosomes, and reduced lysosomal activity in Tsc2-/- MEFs. In a mouse model of TSC, ritanserin treatment decreased cyst frequency and volume, and in a mouse model of lymphangioleiomyomatosis, genetic downregulation of DGKA prevented alveolar destruction and airspace enlargement. Collectively, these data indicate that DGKA supports macropinocytosis in TSC2-deficient cells to maintain phospholipid homeostasis and promote proliferation. Targeting macropinocytosis with ritanserin may represent a novel therapeutic approach for the treatment of TSC and lymphangioleiomyomatosis. SIGNIFICANCE: This study identifies macropinocytosis and phospholipid metabolism as novel mechanisms of metabolic homeostasis in mTORC1-hyperactive cells and suggest ritanserin as a novel therapeutic strategy for use in mTORC1-hyperactive tumors, including pancreatic cancer. GRAPHICAL ABSTRACT: http://cancerres.aacrjournals.org/content/canres/81/8/2086/F1.large.jpg.


Conflict of interest statement

Conflict of Interest: The authors declare no potential conflicts of interest.

Figures

Figure 1.
Figure 1.. Chloroquine synergizes with ritanserin to selectively inhibit the proliferation of Tsc2-deficient cells.
(A) Combination treatment with CQ (5uM) and ritanserin (10uM) inhibits the proliferation of Tsc2−/− MEFs (left panel). Top ten compounds identified from the high-throughput drug screen (right panel). Ritanserin selectively decreased the proliferation of Tsc2−/− MEFs (~10-fold; compared to untreated Tsc2+/+ MEFs). (B) Ritanserin or combination treatments had no impact on Tsc2+/+ MEFs. (C) Immunoblotting shows that combination treatment with CQ (5uM) and ritanserin (10uM) induces apoptosis in Tsc2−/− MEFs (24 hours). (D-E) Ritanserin (20uM) blocks the proliferation of Tsc2−/− MEFs but not Tsc2+/+ MEFs. (F) Ritanserin inhibits the proliferation of Tsc2−/− MEFs regardless of their autophagic status. Values are shown as fold-change (FC) normalized to the day of seeding. (G) Ritanserin-mediated inhibition of proliferation is reversed by adding-back phosphatidic acid (100uM; 72 hours). Proliferation was quantified using crystal violet staining. Data represented as mean +/− standard deviation of six biological replicates. Statistical significance was assessed using two-way and one-way ANOVAs with Bonferroni correction with **p < 0.01, ***p < 0.001, ****p < 0.0001.
Figure 2.
Figure 2.. Genetic inhibition of DGKA sensitizes TSC2-deficient cells to chloroquine treatment.
(A) Immunoblots confirmed downregulation of DGKA in Tsc2-deficient 105K and TTJ cells. (B) Quantitative real-time PCR confirmed DGKA gene knockdown. (C-E) Genetic inhibition of DGKA sensitized Tsc2-deficient 105K cells to CQ (5uM). Three shRNA clones against DGKA were tested. (F-H) Genetic inhibition of DGKA sensitized Tsc2-deficient TTJ cells to CQ treatment (5uM). Proliferation was quantified using crystal violet staining. Values are shown as fold-change (FC) normalized to the day of seeding. (I) Quantitative real-time PCR shows increased expression of Dgka in Tsc2−/− MEFs compared to Tsc2+/+ MEFs. Rapamycin treatment (20nM) further increased Dgka expression, while Torin1 (250nM) had no effect. Rapamycin and Torin1 had no impact on the expression of Dgka in Tsc2+/+ MEFs. Data are from three biological replicates for each condition. (J) Dgka gene expression is elevated in renal angiomyolipoma tissues (n=28) compared to normal kidney tissues (n=8). Statistical significance was assessed using Mann-Whitney test (p=0.0191). (K) Diacylglycerol kinase activity is enhanced in Tsc2−/− MEFs compared to Tsc2+/+ MEFs. ATP was used as a positive control. Data are represented as mean +/− standard deviation. For two-group comparisons, unpaired t-test was used. Two-way ANOVA test with Bonferroni correction was applied for comparing multiple groups. Statistical significance was determined as *p<0.05, **p<0.01, ***p<0.001, ****p < 0.0001.
Figure 3.
Figure 3.. Enhanced macropinocytosis in Tsc2-deficient cells is mediated via DGKA.
(A) Macropinocytosis is enhanced (3-fold) in Tsc2−/− MEFs compared to Tsc2+/+ MEFs. Ritanserin (10uM; 16 hours) inhibited the macropinocytic uptake of dextran (0.5mg/ml, FITC-Dextran) selectively in Tsc2−/− MEFs. PA (100uM) restored macropinocytosis of ritanserin-treated Tsc2−/− MEFs to levels compared to that of untreated cells. (B) Exogenous protein uptake (0.5mg/ml, BSA-TMR) was increased in ritanserin (10uM; 16 hours) treated Tsc2−/− MEFs compared to Tsc2+/+ MEFs. PA (100uM) partially rescued macropinocytosis in Tsc2−/− MEFs. As expected, EIPA (25uM;16 hours) inhibited macropinocytic dextran and BSA uptake. (C) Confocal microscopy shows that ritanserin inhibits macropinocytic uptake of dextran (10uM; 16 hours). (D) Genetic downregulation of DGKA inhibits macropinocytic dextran uptake (0.5mg/ml, FITC-Dextran). (E) Lysotracker staining revealed that ritanserin (10uM; 16 hours) reduces lysosome numbers in Tsc2−/− MEFs but not in Tsc2+/+ MEFs. Combination treatment with CQ and ritanserin further inhibited lysosomal numbers. mTORC1 inhibitor rapamycin (20nM; 16 hours) strongly decreased lysosomes in Tsc2−/− MEFs but not in Tsc2+/+ MEFs. (F-G) Lysosomal activity is enhanced in Tsc2−/− MEFs compared to Tsc2+/+ MEFs. Ritanserin treatment (10uM; 16 hours) decreased lysosomal activity by 50% (0.2mg/ml; DQ-BSA). Data represented as mean +/− standard deviation from three biological replicates. Statistical significance was assessed using two-way ANOVA with Bonferroni correction with ***p<0.001, ****p < 0.0001.
Figure 4.
Figure 4.. Ritanserin treatment rewires purine metabolism in Tsc2-deficient cells.
(A) Hierarchical clustering and heat map showing the top 50 differential metabolites in ritanserin treated Tsc2−/− MEFs. (B) Metabolite Set Enrichment Analysis (MSEA) identified differentially regulated metabolic pathways with FDR q<0.05. (C-G) LC/MS reveals that pentose phosphate pathway intermediate metabolites are decreased upon ritanserin treatment (10uM; 16 hours). (H-I) Purines adenosine and guanine are decreased following ritanserin treatment. Data presented as mean ± SD of four biological replicates. Statistical significance was assessed using t-test with FDR correction (q<0.05) and *p<0.05, **p<0.01, ***p<0.001, ****p <0.0001.
Figure 5.
Figure 5.. Ritanserin induces phospholipid reprogramming in Tsc2-deficient cells.
(A) Schematic representation of diacylglycerol metabolism to phosphatidic acid via DGKA. (B) Phosphatidic acid levels are elevated in Tsc2−/− MEFs compared to Tsc2+/+ MEFs. Ritanserin treatment (10uM; 16 hours) decreases PA levels in Tsc2−/− MEFs but not in Tsc2+/+ MEFs. (C-G) DGKA inhibition by ritanserin leads to accumulation of diacylglycerol and phospholipids PI, PC, PS and PE similarly in Tsc2−/− MEFs and in Tsc2+/+ MEFs. Data presented as mean ± SD of the sum of each lipid species from three biological replicates. Statistical significance was assessed using t-test with FDR correction (q<0.05) and *p<0.05, **p<0.01, ***p<0.001, ****p <0.0001.
Figure 6.
Figure 6.. Lipid droplet formation in Tsc2-deficient cells is mediated via DGKA.
(A) Representative images from Tsc2+/+ and Tsc2−/− MEFs treated with vehicle control (DMSO) or ritanserin (10uM; 16 hours). Lipid droplet content (10uM BODIPY 493/500) was increased in Tsc2−/− MEFs compared to Tsc2+/+ MEFs. F-actin was visualized using Phalloidin 578/600 (10uM). (B-C) Quantification of lipid droplets in Tsc2−/− and Tsc2+/+ MEFs following ritanserin treatment using CellProfiler (Broad Institute). Fluorescence intensity is represented as mean +/− standard deviation from >20 cells per condition. Statistical significance was assessed using unpaired t-test with *p < 0.05.
Figure 7.
Figure 7.. Therapeutic targeting of DGKA decreases alveolar airspace enlargement in a preclinical model of LAM and prevents cyst formation in a model of TSC.
(A) Mean linear intercept quantification shows that DGKA downregulation decreases the alveolar airspace in lung sections from NCr mice injected with 3 million shDGKA (n=4 mice) or shCTL (n=5 mice) TTJ cells. (B) H&E stained lung sections from mice injected with shCTL or shDGKA TTJ cells. (C) Body weight of mice injected with shCTL TTJ cells decreased by 20% 19 days after injection. (D, E) Ritanserin (20mg/kg/daily) reduced the number of lesions and overall tumor burden of Tsc2+/− A/J mice after 30 days of treatment. (F) H&E stained kidney sections from mice treated with vehicle (upper panels) and ritanserin (lower panels). Data are represented as mean +/− standard deviation and statistical significance was assessed using unpaired t-test with *p<0.05.

References

    1. Henske EP, Jozwiak S, Kingswood JC, Sampson JR & Thiele EA Tuberous sclerosis complex. Nat Rev Dis Primers 2, 16035, doi:10.1038/nrdp.2016.35 (2016). - DOI - PubMed
    1. Johnson SR, Taveira-DaSilva AM & Moss J Lymphangioleiomyomatosis. Clin Chest Med 37, 389–403, doi:10.1016/j.ccm.2016.04.002 (2016). - DOI - PubMed
    1. Meraj R, Wikenheiser-Brokamp KA, Young LR & McCormack FX Lymphangioleiomyomatosis: new concepts in pathogenesis, diagnosis, and treatment. Semin Respir Crit Care Med 33, 486–497, doi:10.1055/s-0032-1325159 (2012). - DOI - PubMed
    1. Taveira-DaSilva AM & Moss J Clinical features, epidemiology, and therapy of lymphangioleiomyomatosis. Clin Epidemiol 7, 249–257, doi:10.2147/CLEP.S50780 (2015). - DOI - PMC - PubMed
    1. McCormack FX, Inoue Y, Moss J, Singer LG, Strange C, Nakata K et al. Efficacy and safety of sirolimus in lymphangioleiomyomatosis. N Engl J Med 364, 1595–1606, doi:10.1056/NEJMoa1100391 (2011). - DOI - PMC - PubMed

Publication types

MeSH terms