. 2021 Apr 7;41(14):3120-3141.
doi: 10.1523/JNEUROSCI.1848-20.2021. Epub 2021 Feb 16.

Adult trkB Signaling in Parvalbumin Interneurons is Essential to Prefrontal Network Dynamics

Affiliations

Adult trkB Signaling in Parvalbumin Interneurons is Essential to Prefrontal Network Dynamics

Nicolas Guyon et al. J Neurosci. .

Abstract

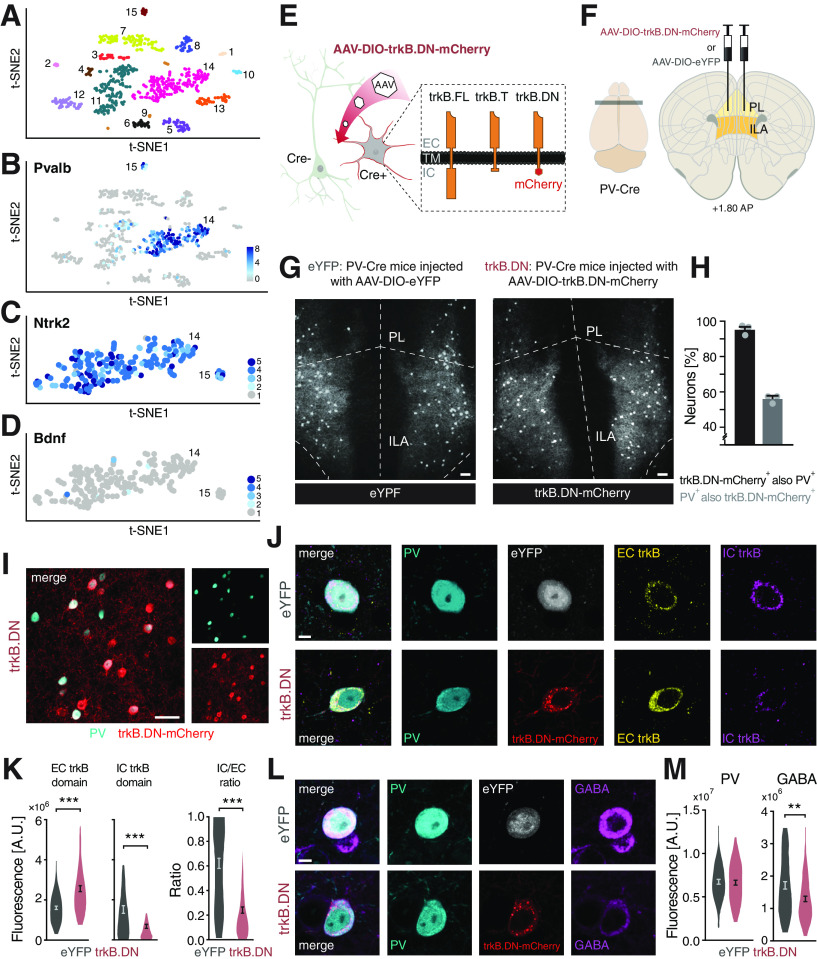
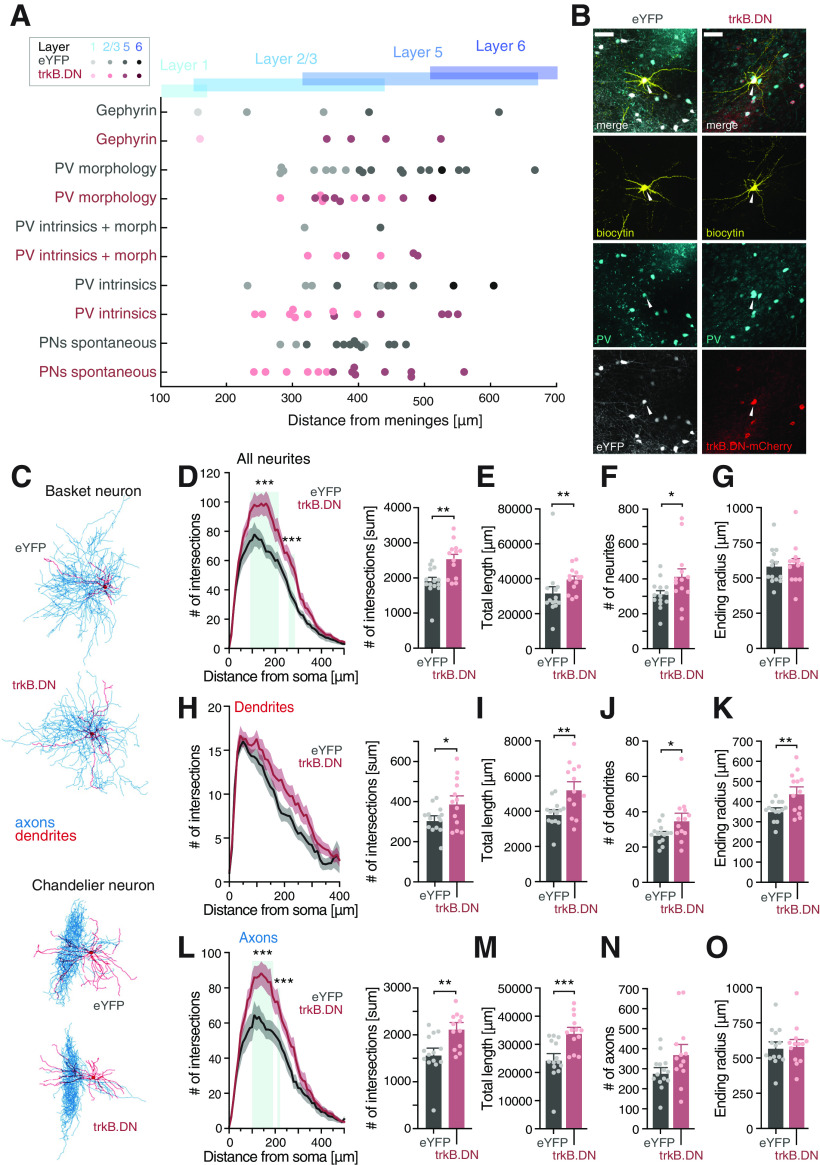
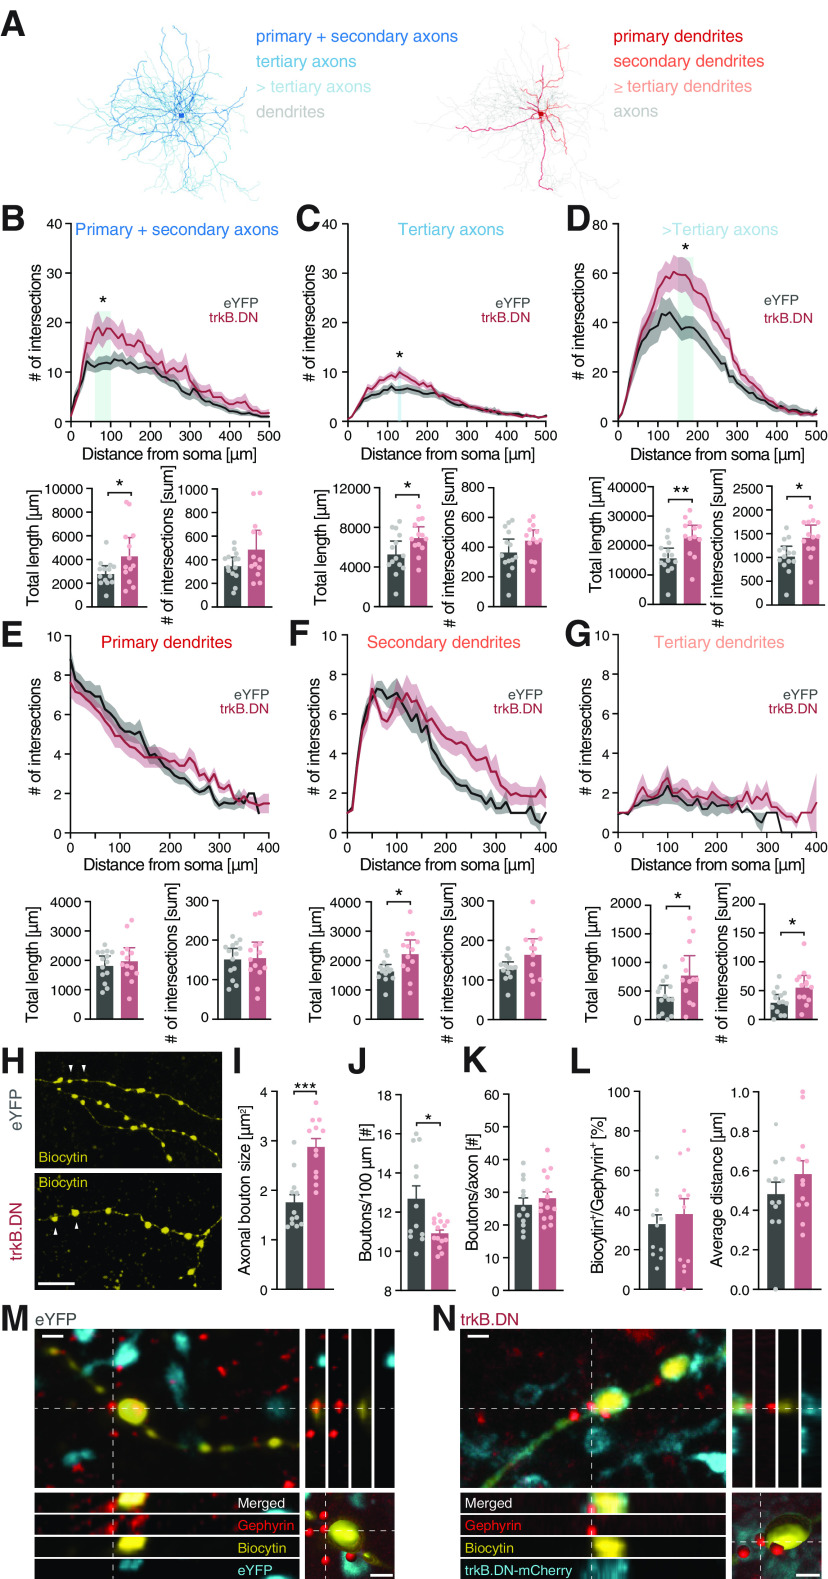
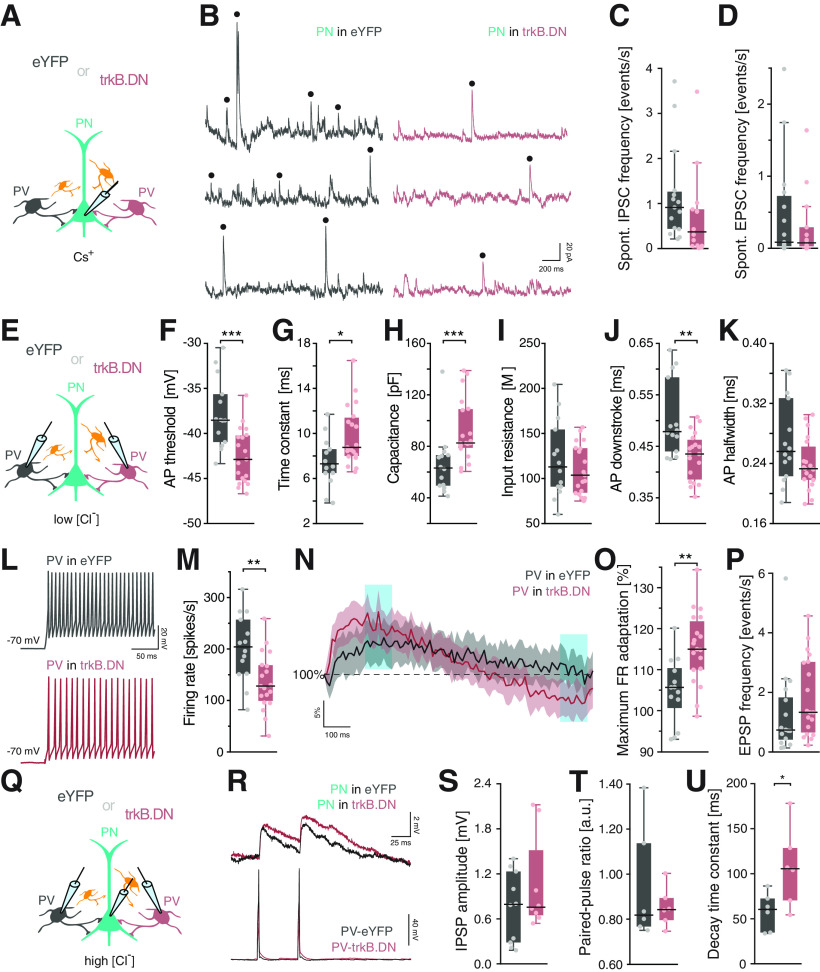
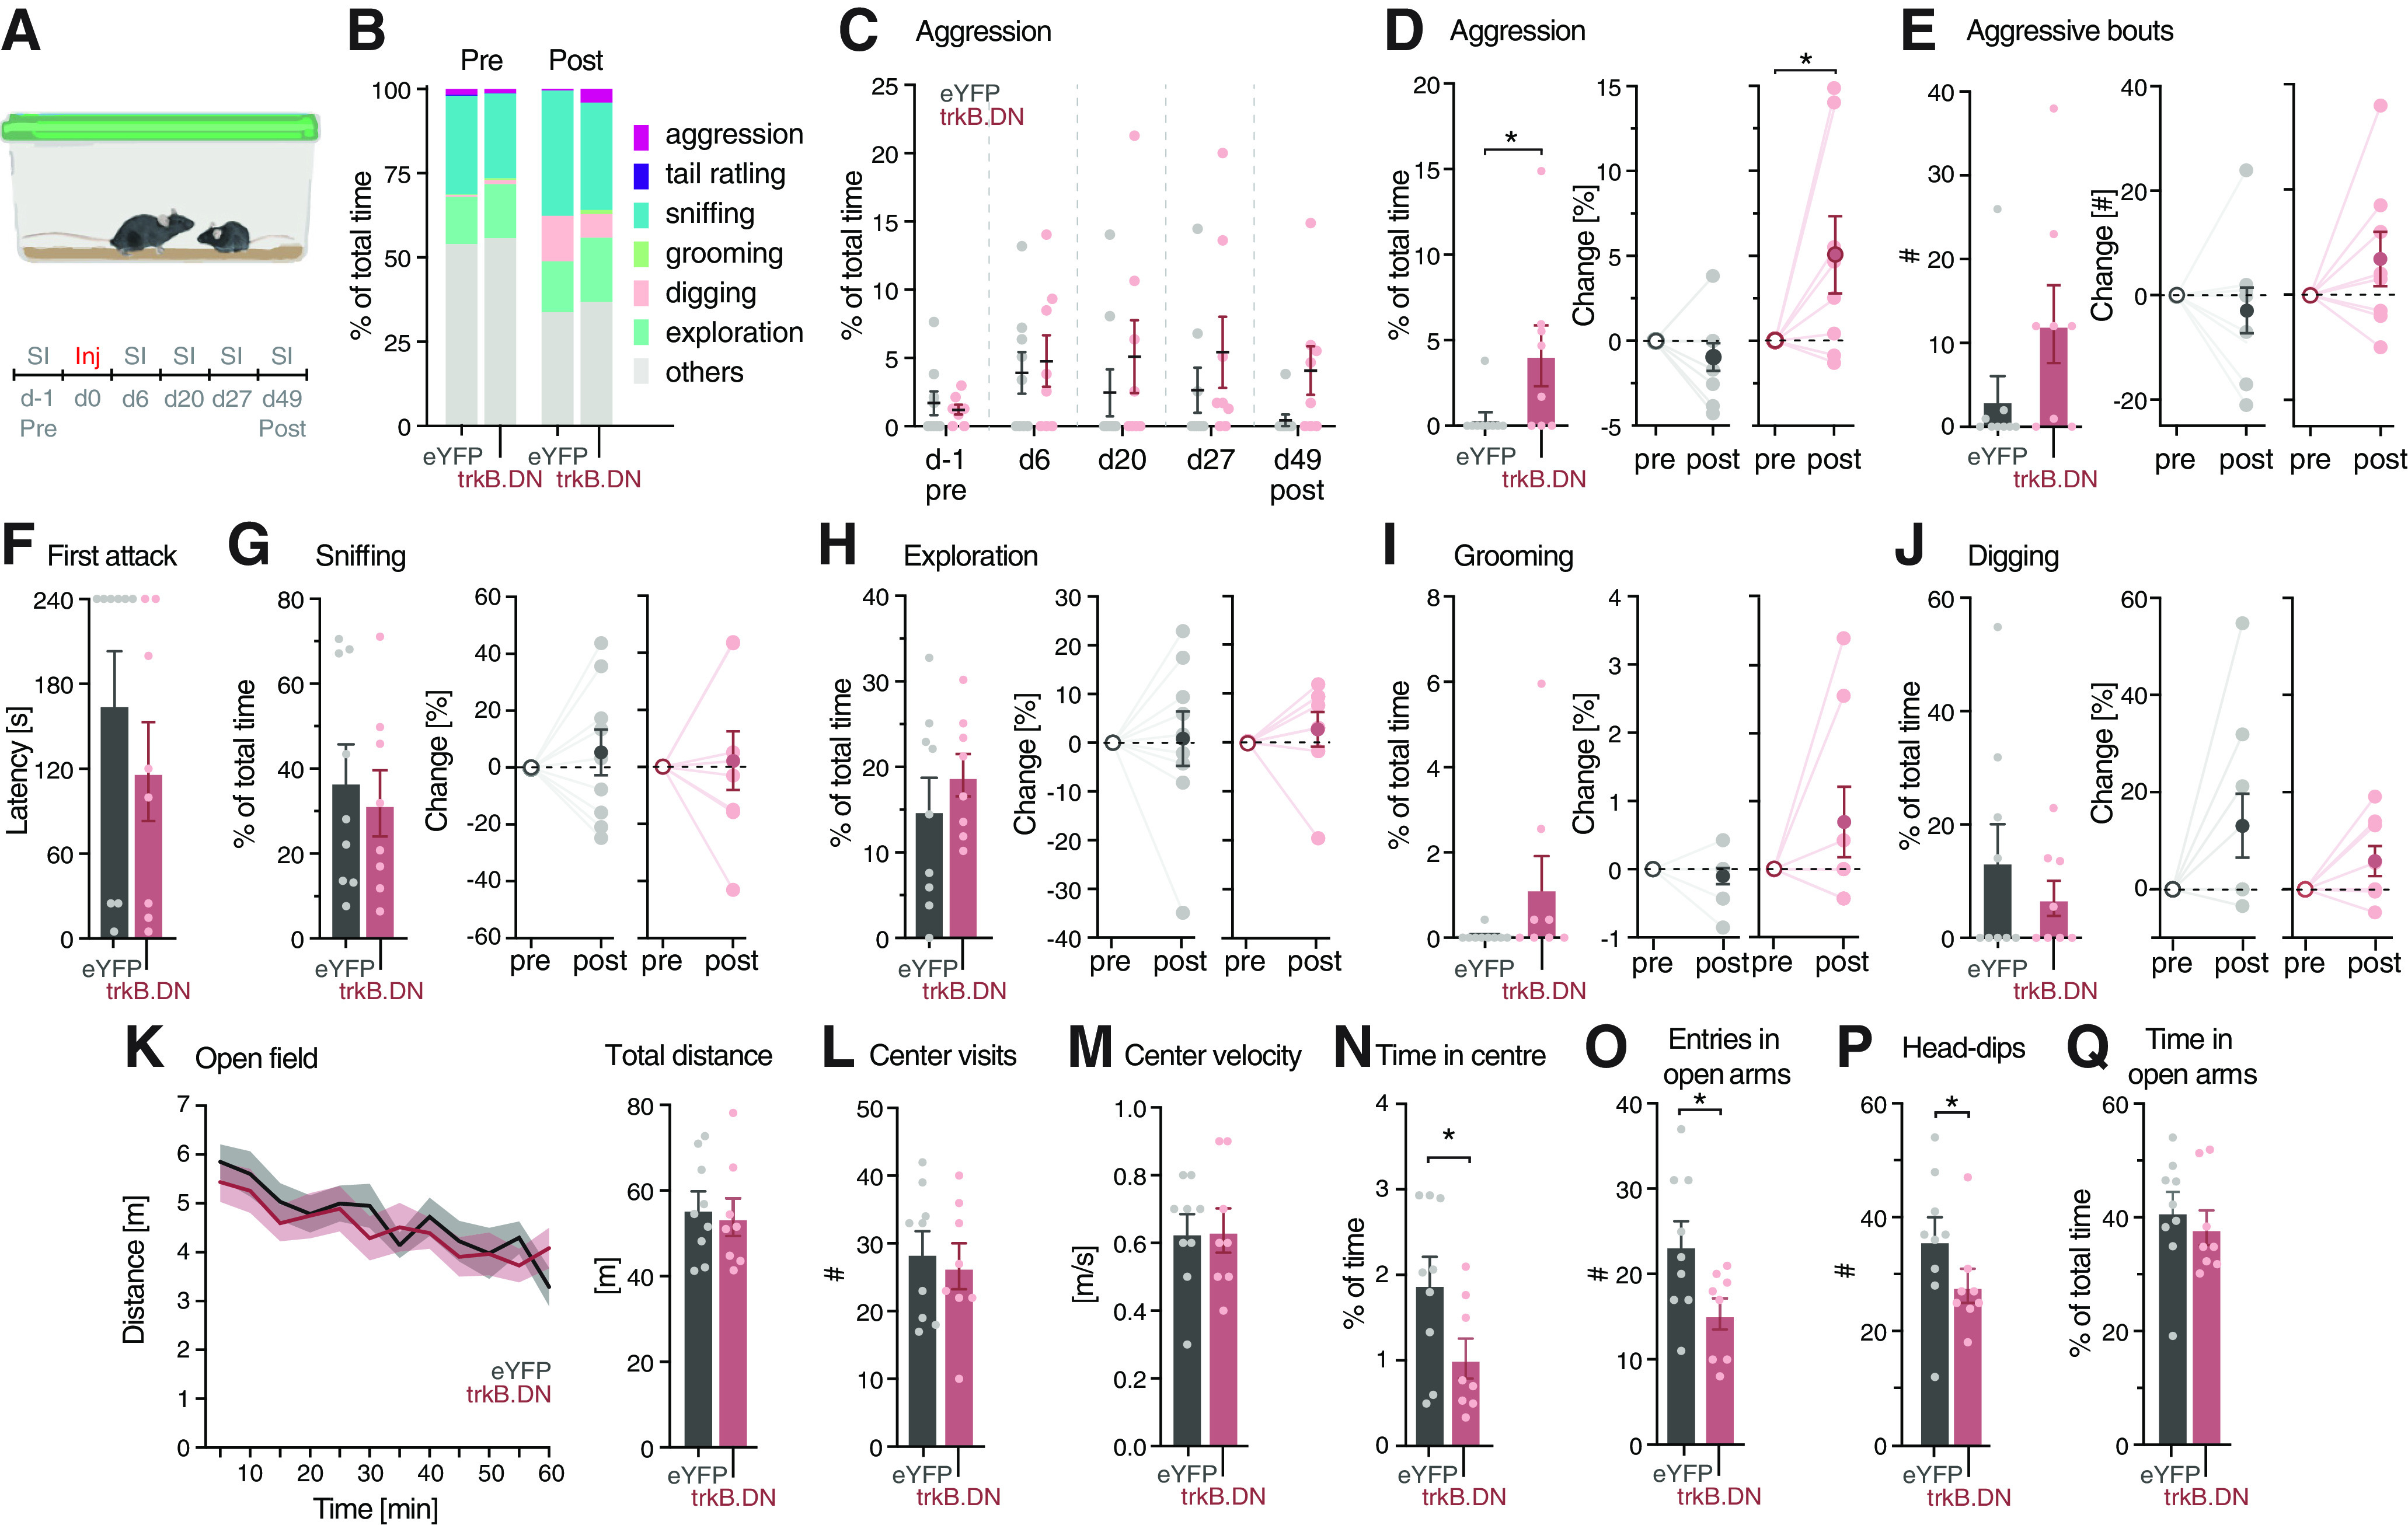
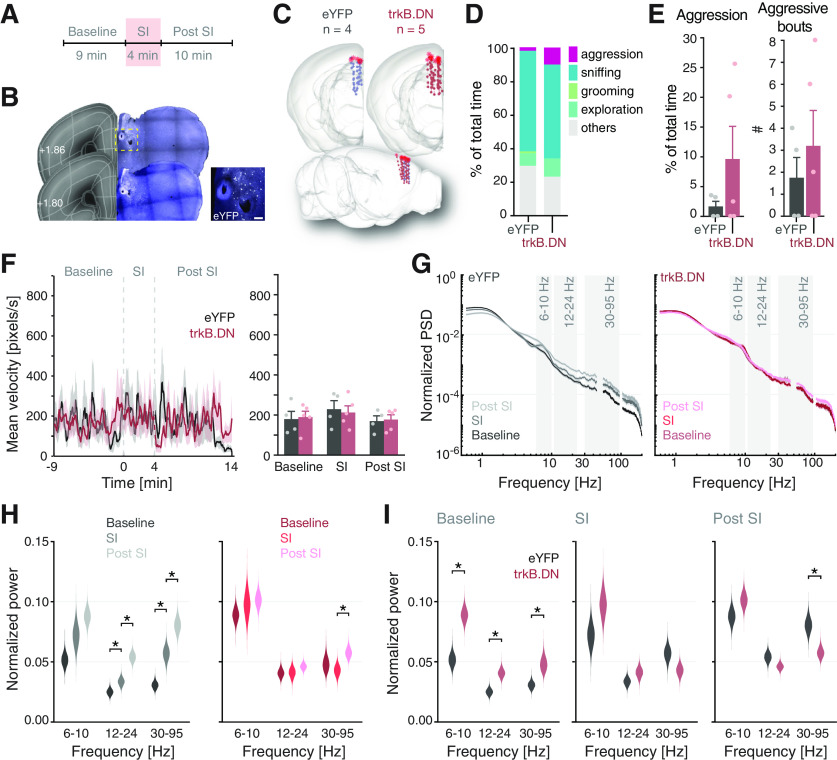
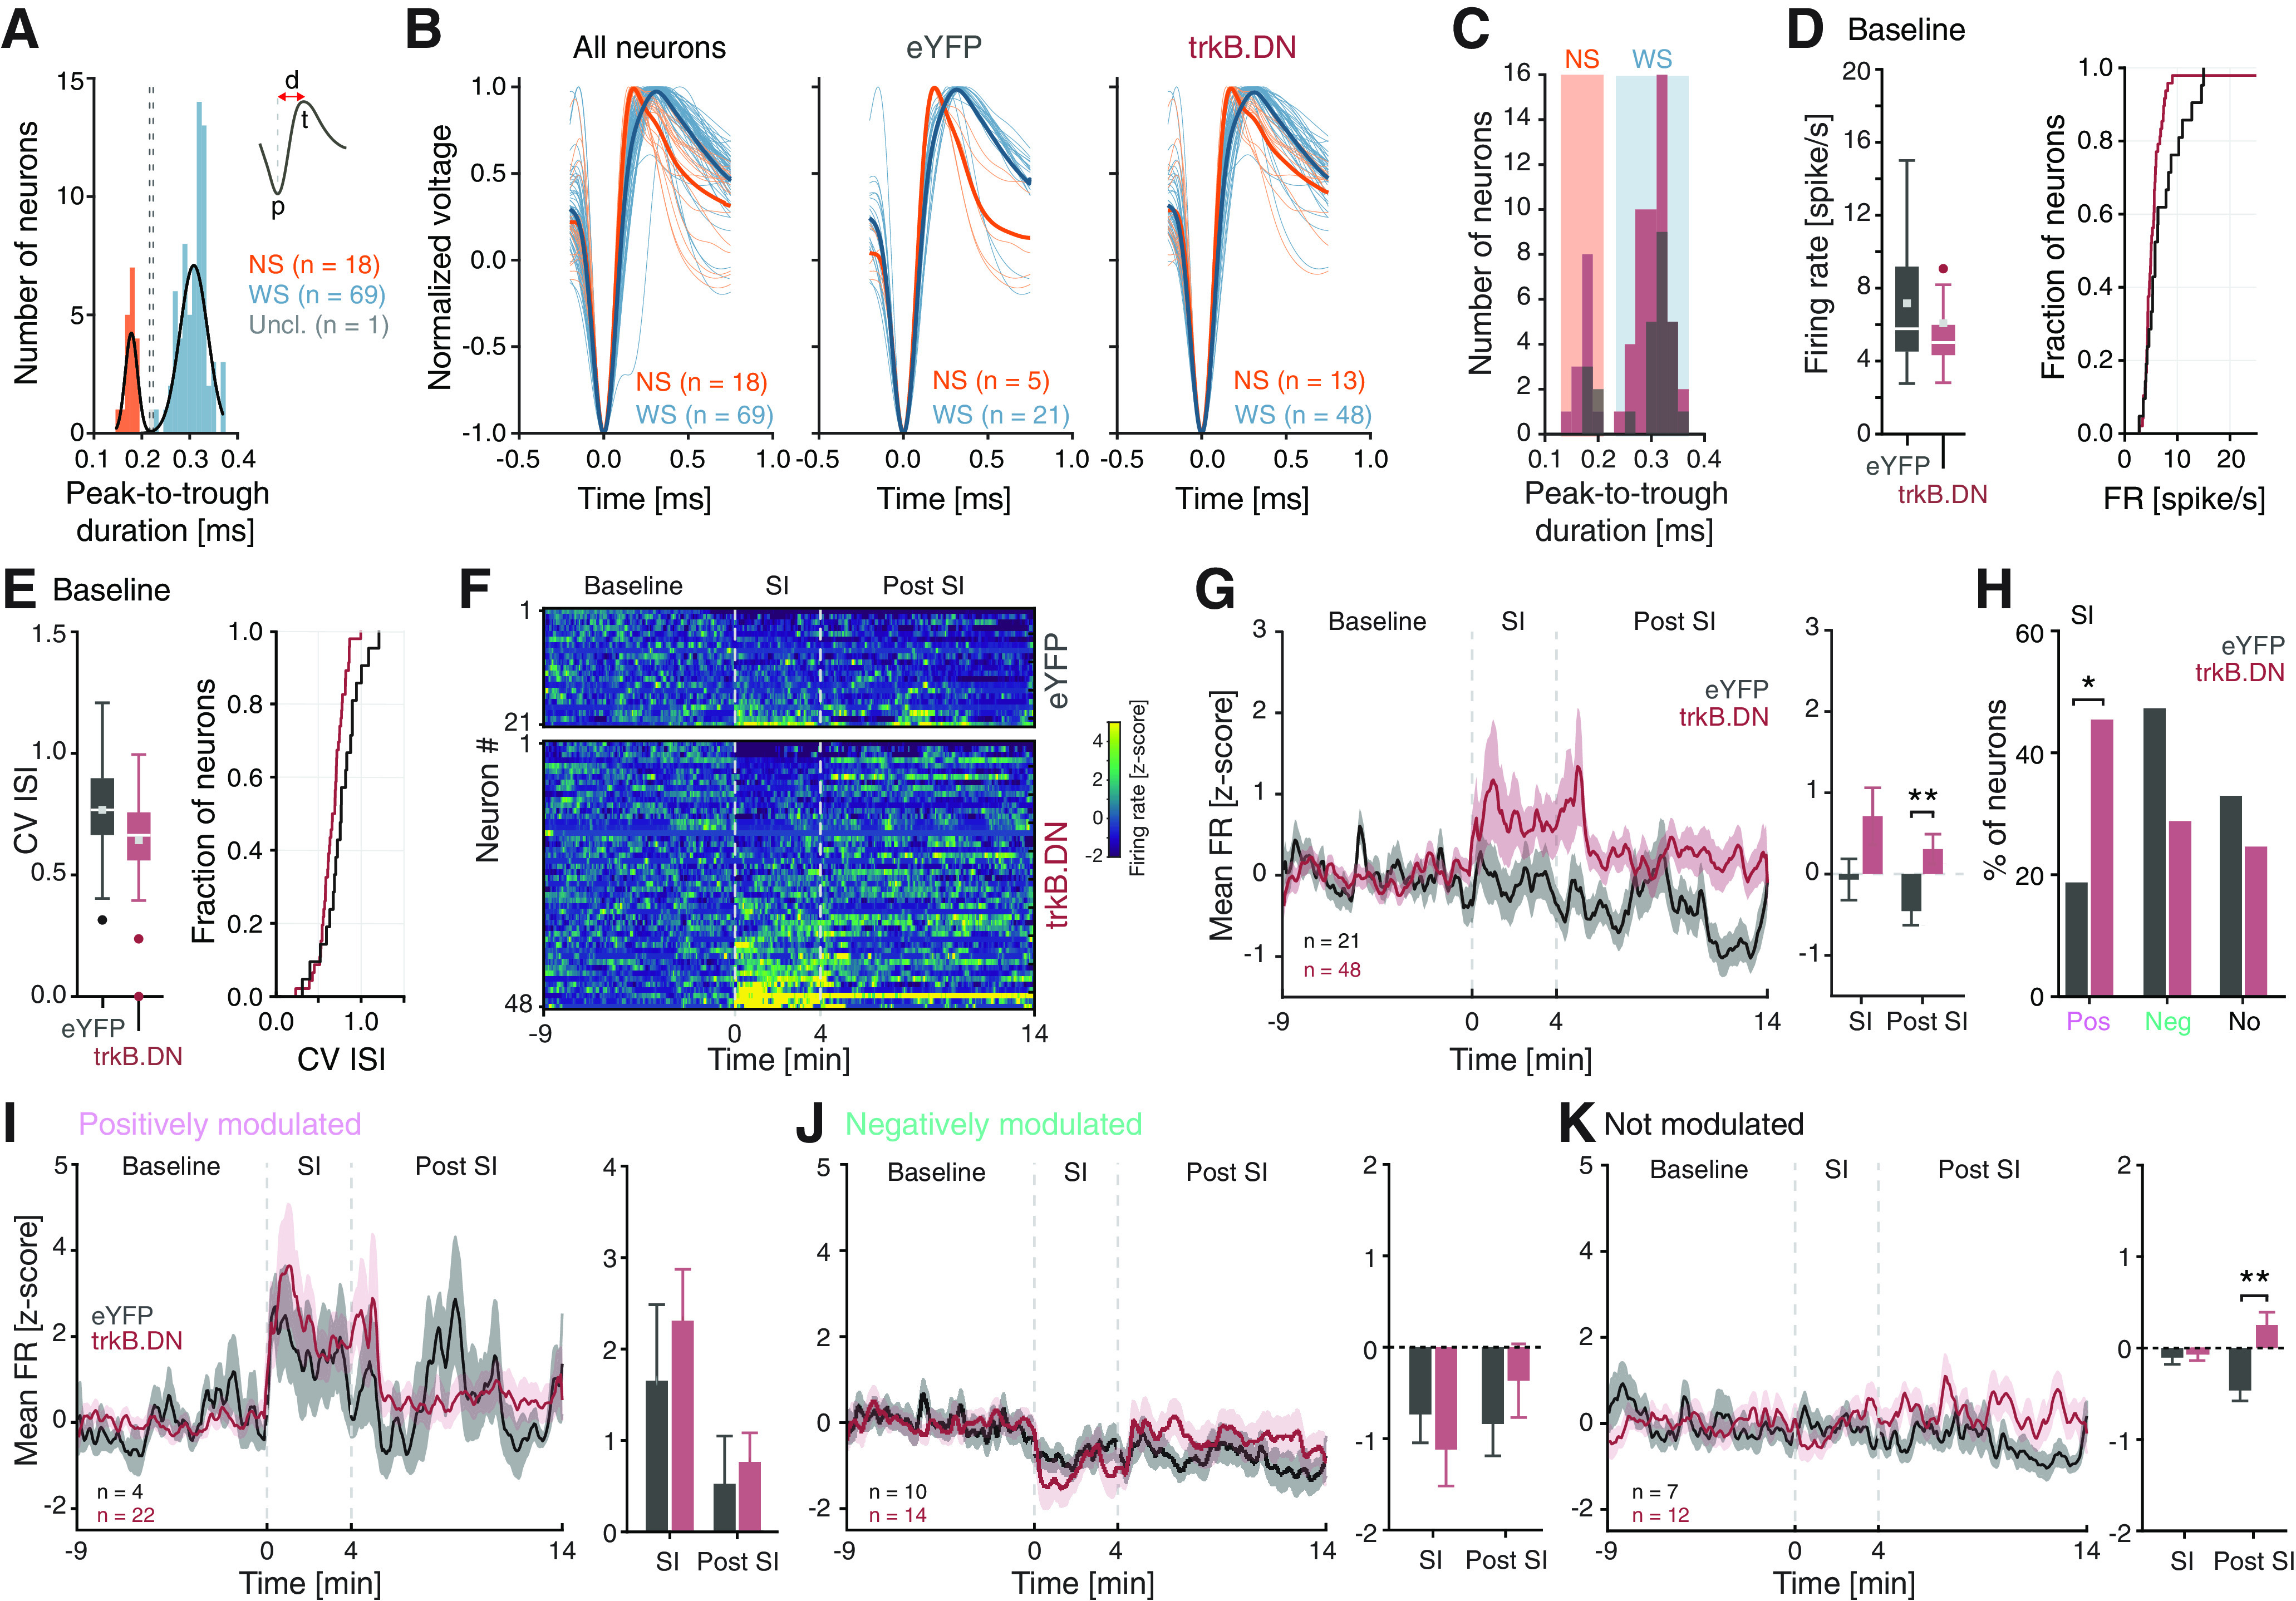
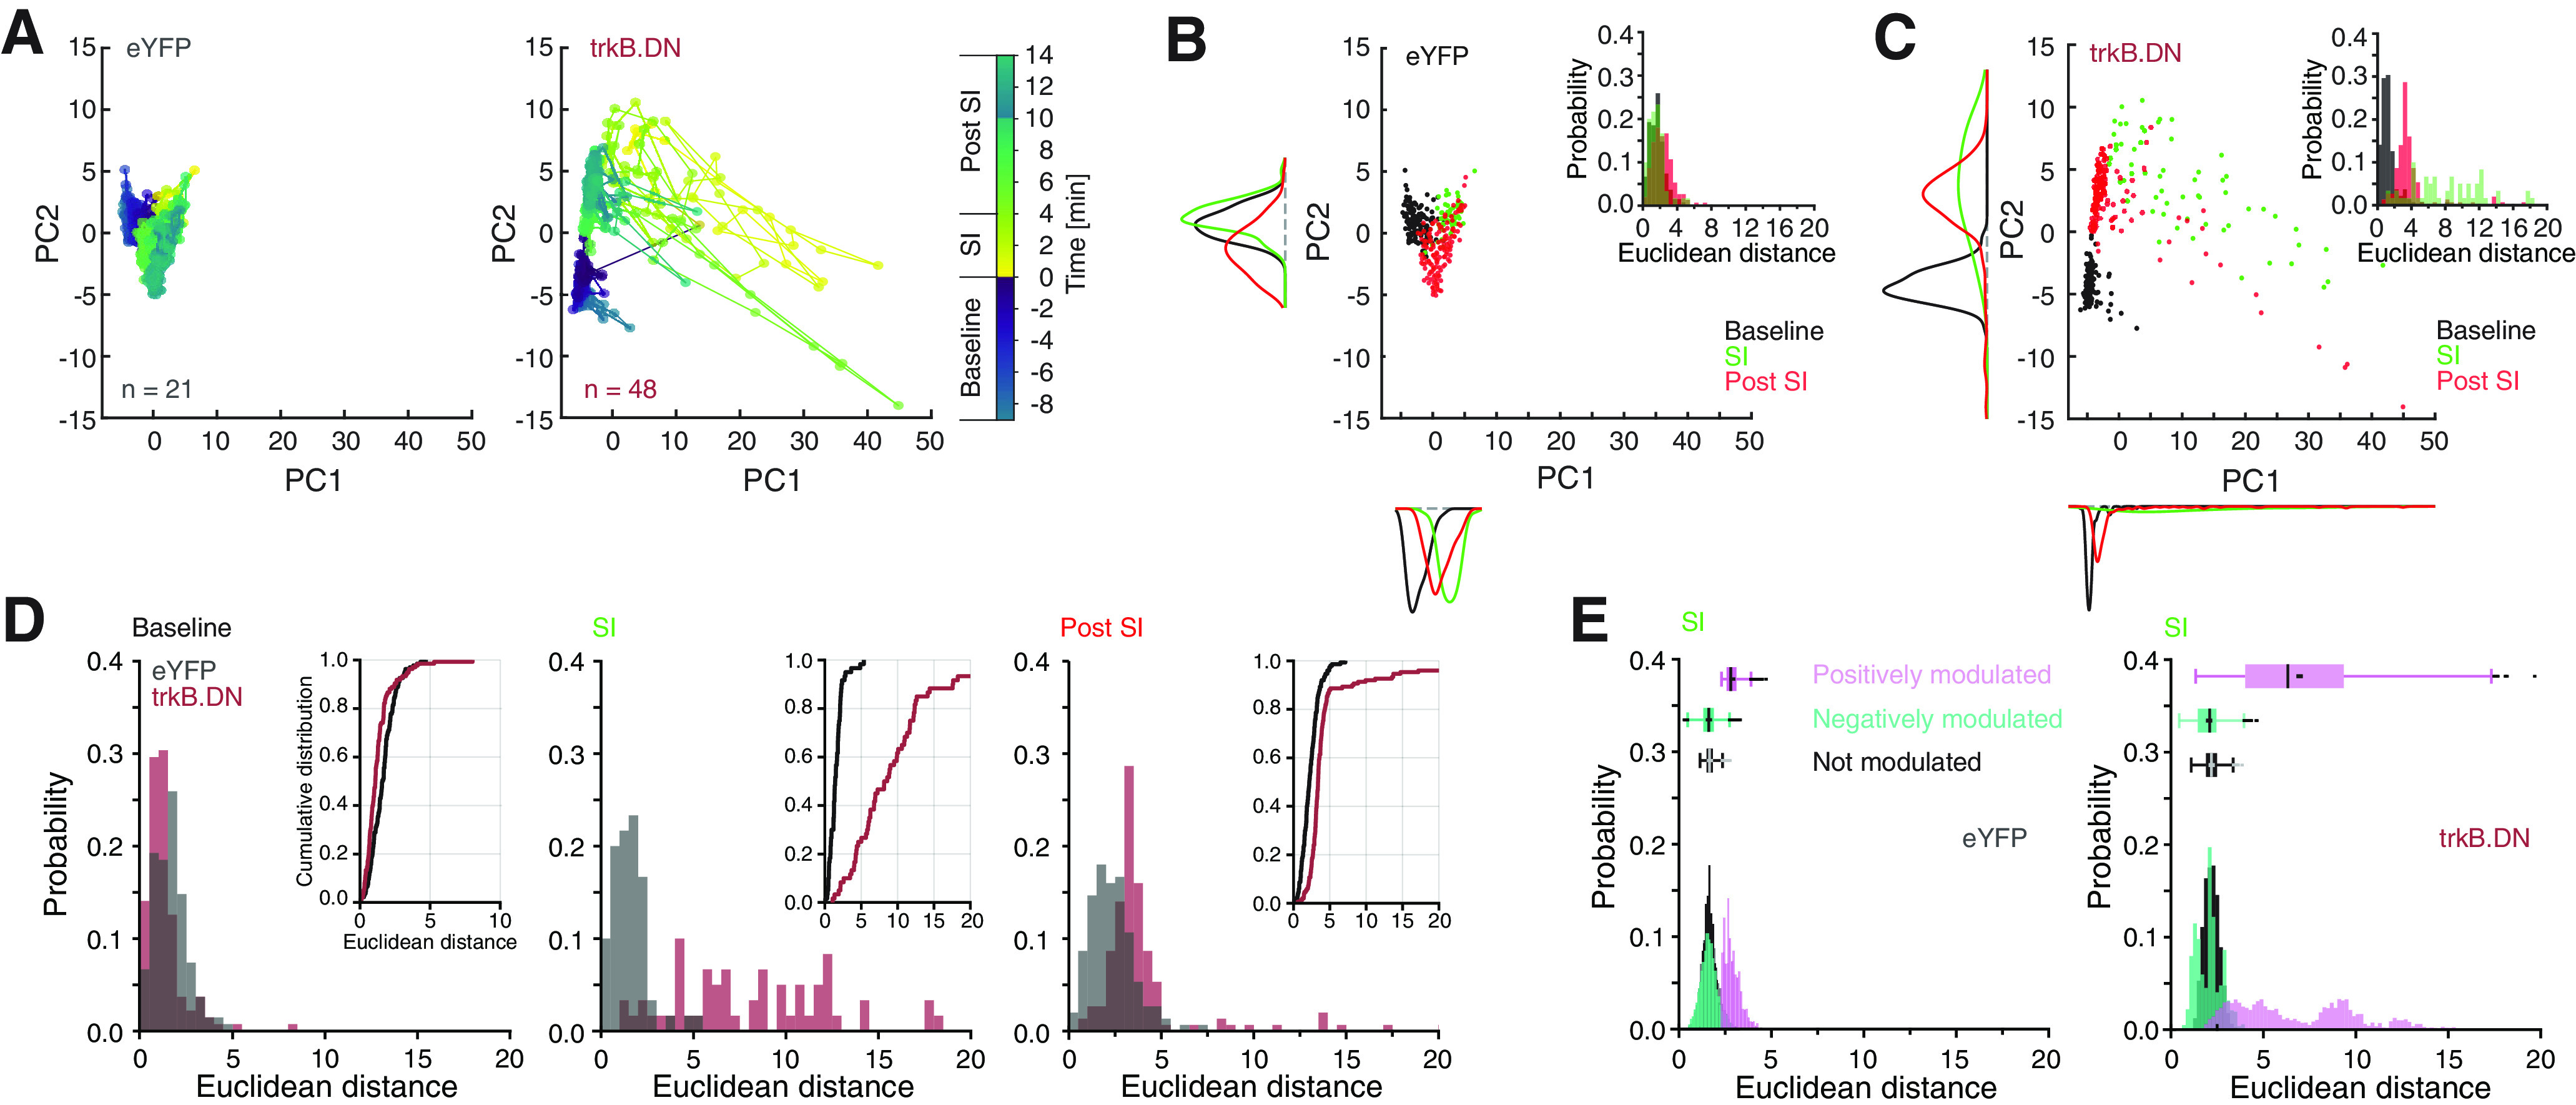
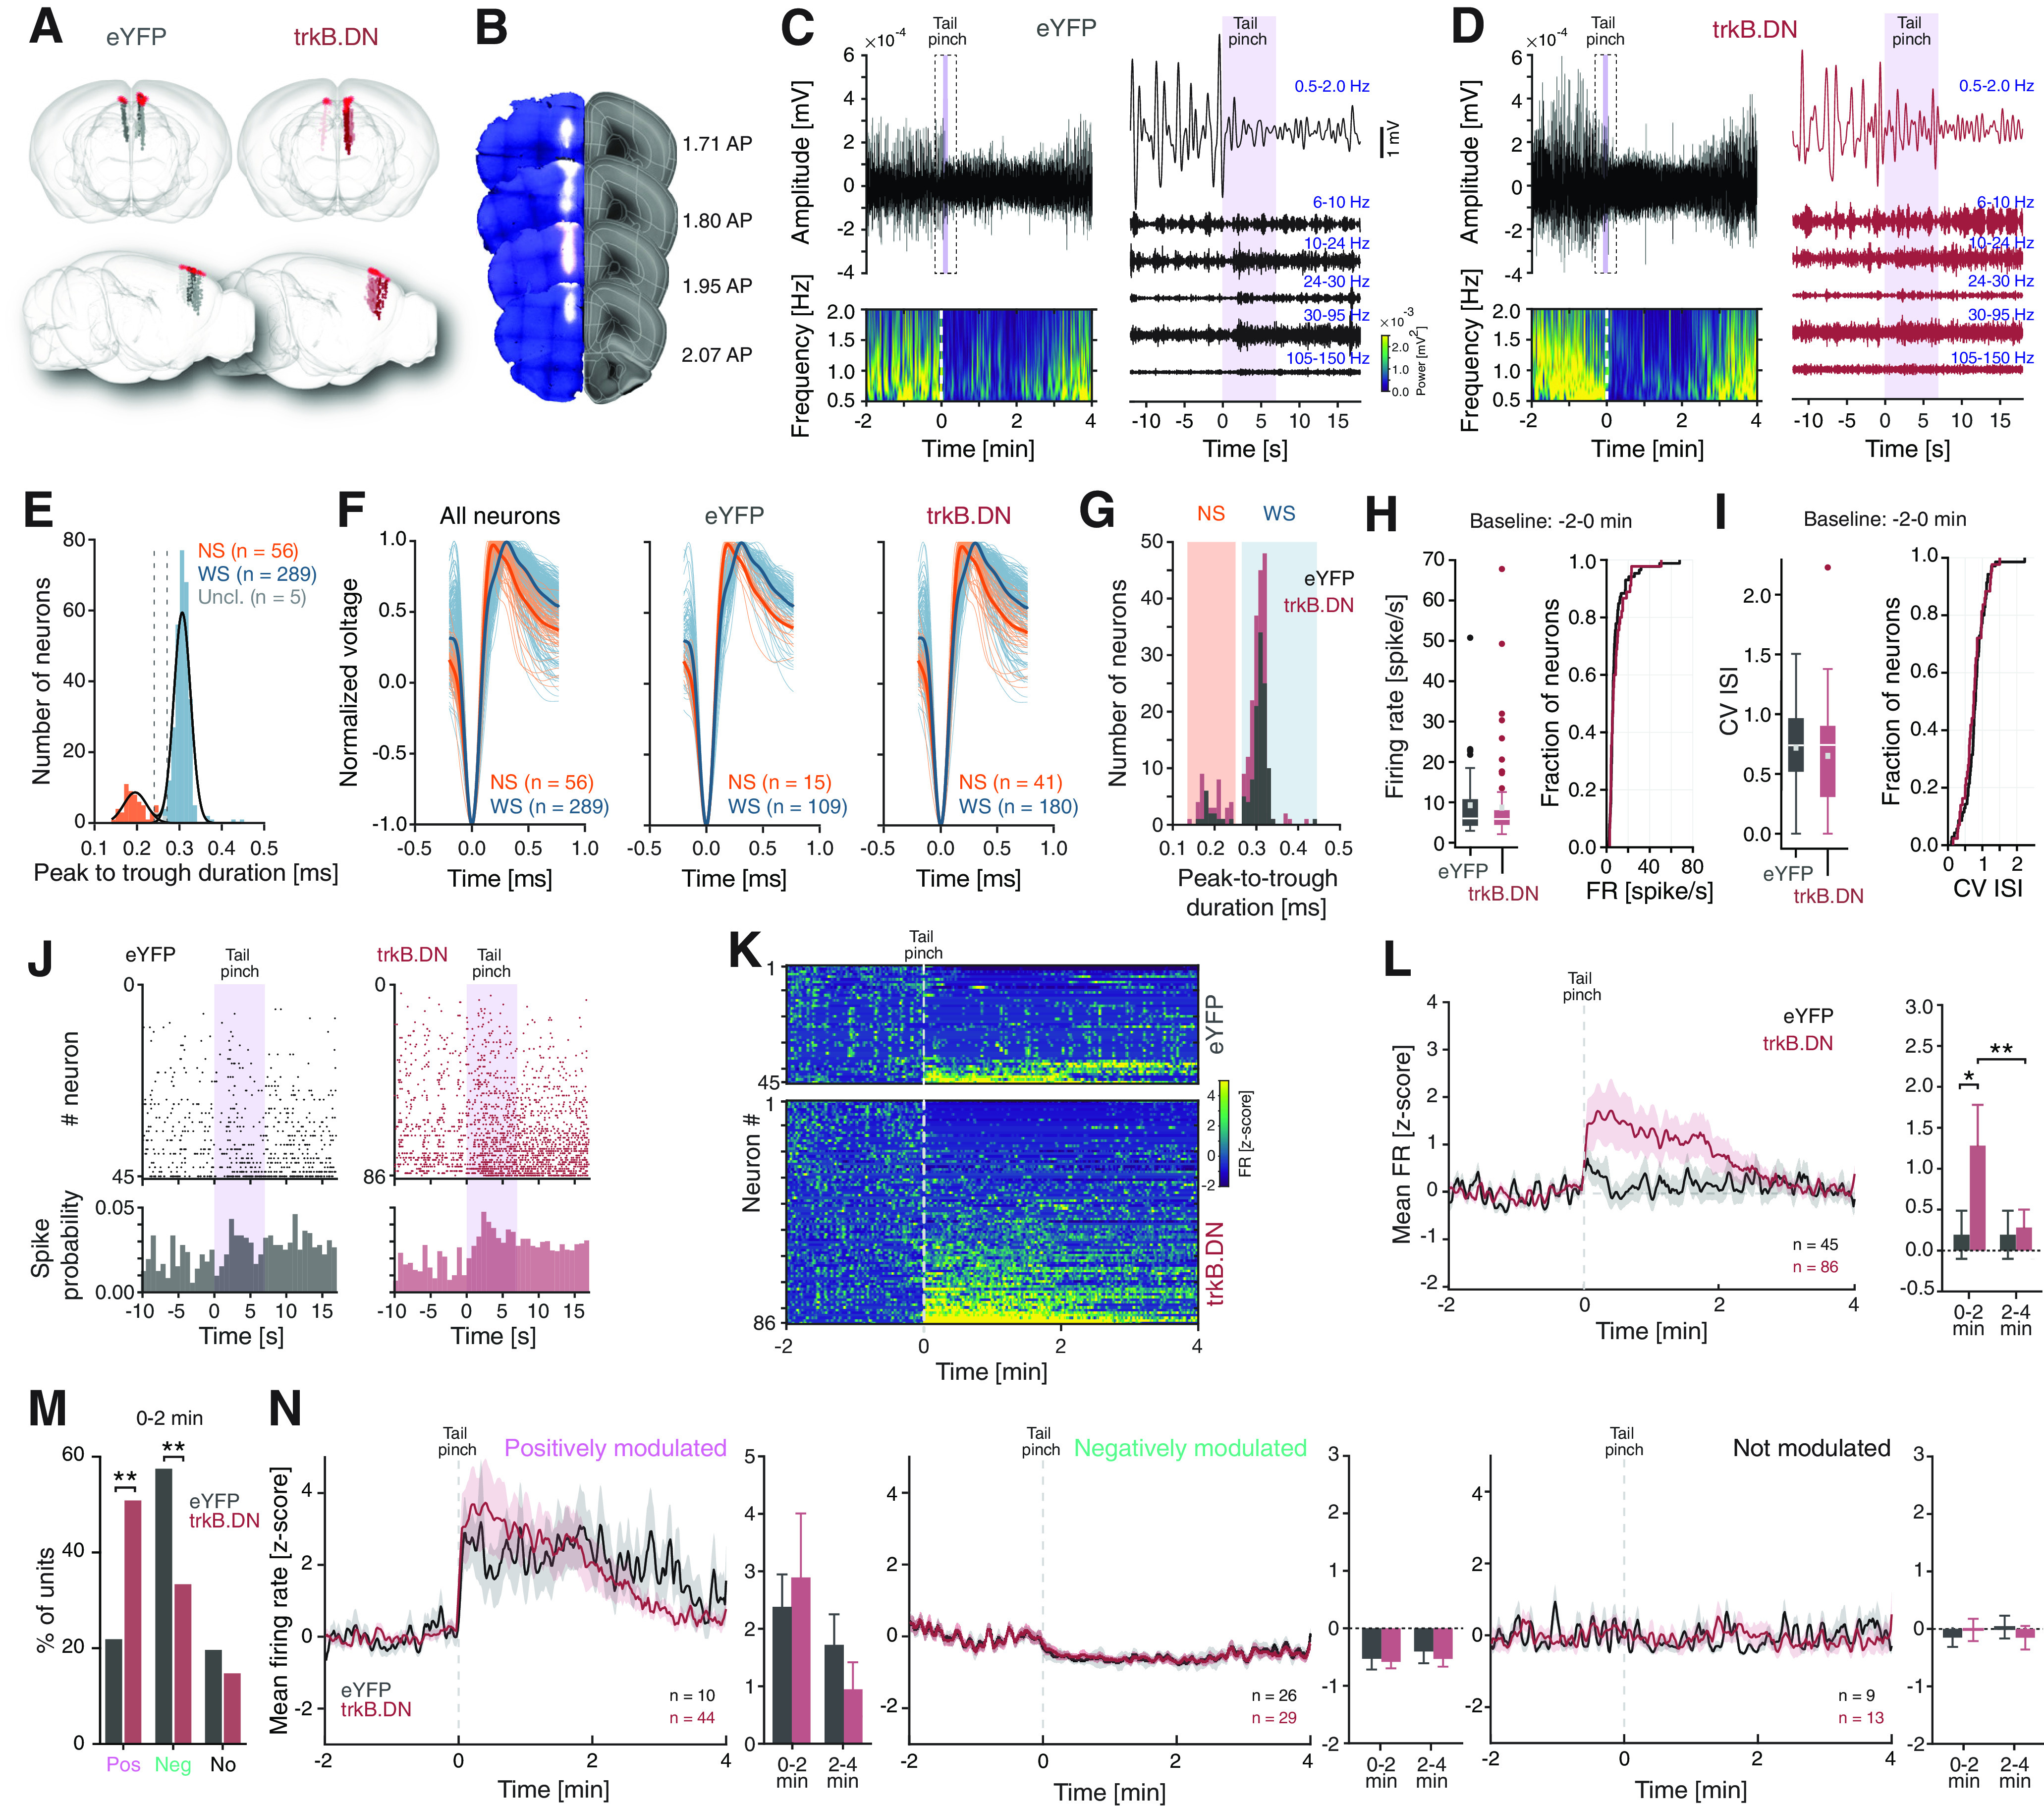
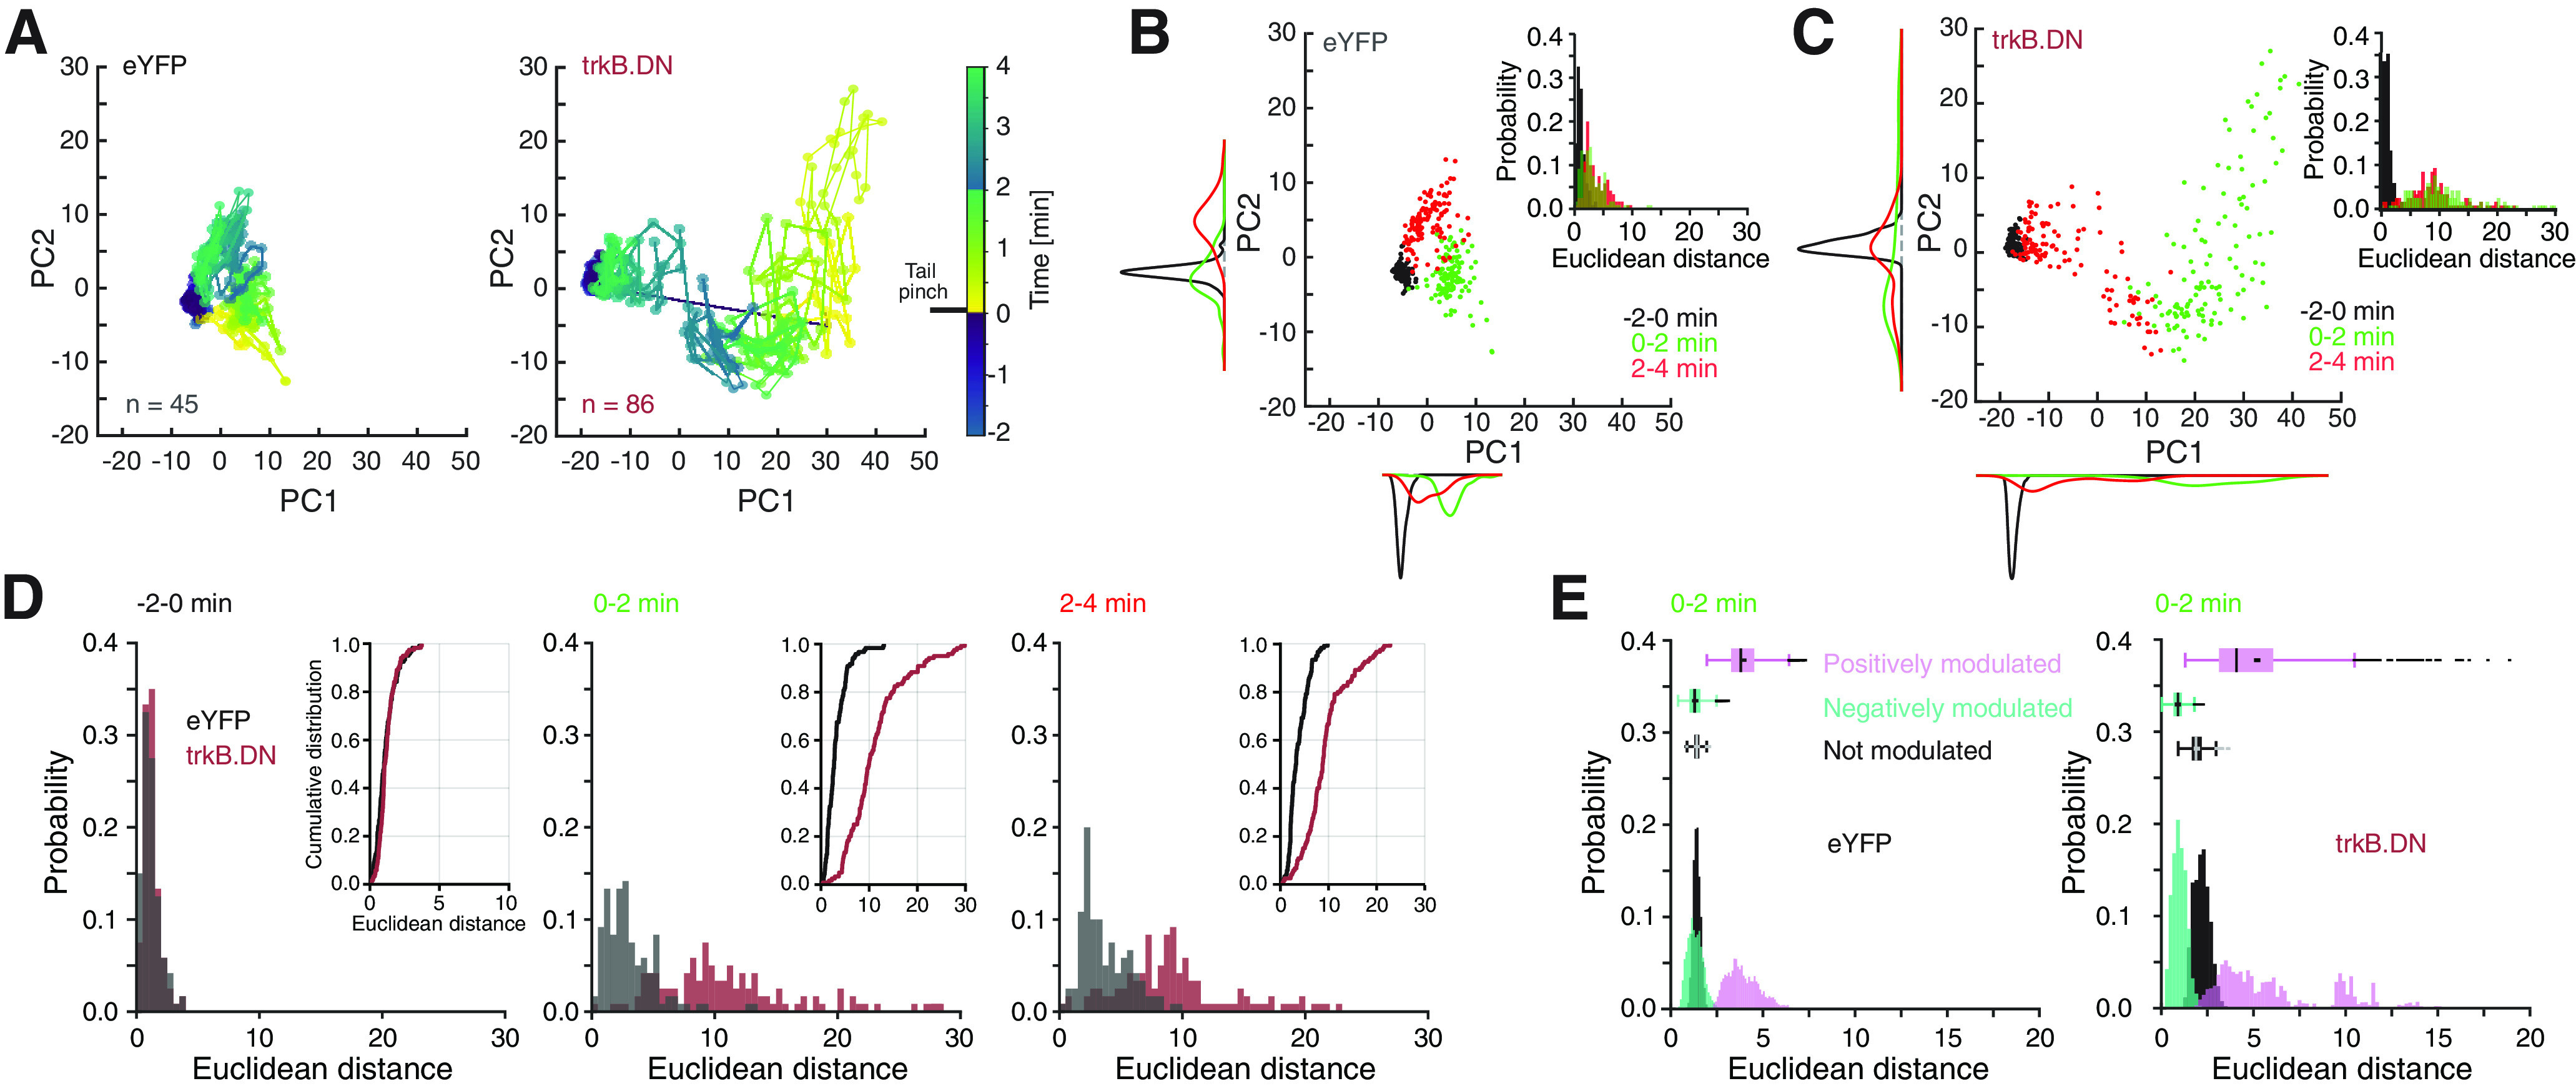
Inhibitory interneurons expressing parvalbumin (PV) are central to cortical network dynamics, generation of γ oscillations, and cognition. Dysfunction of PV interneurons disrupts cortical information processing and cognitive behavior. Brain-derived neurotrophic factor (BDNF)/tyrosine receptor kinase B (trkB) signaling regulates the maturation of cortical PV interneurons but is also implicated in their adult multidimensional functions. Using a novel viral strategy for cell-type-specific and spatially restricted expression of a dominant-negative trkB (trkB.DN), we show that BDNF/trkB signaling is essential to the integrity and maintenance of prefrontal PV interneurons in adult male and female mice. Reduced BDNF/trkB signaling in PV interneurons in the medial prefrontal cortex (mPFC) resulted in deficient PV inhibition and increased baseline local field potential (LFP) activity in a broad frequency band. The altered network activity was particularly pronounced during increased activation of the prefrontal network and was associated with changed dynamics of local excitatory neurons, as well as decreased modulation of the LFP, abnormalities that appeared to generalize across stimuli and brain states. In addition, our findings link reduced BDNF/trkB signaling in prefrontal PV interneurons to increased aggression. Together our investigations demonstrate that BDNF/trkB signaling in PV interneurons in the adult mPFC is essential to local network dynamics and cognitive behavior. Our data provide direct support for the suggested association between decreased trkB signaling, deficient PV inhibition, and altered prefrontal circuitry.SIGNIFICANCE STATEMENT Brain-derived neurotrophic factor (BDNF)/tyrosine receptor kinase B (trkB) signaling promotes the maturation of inhibitory parvalbumin (PV) interneurons, neurons central to local cortical dynamics, γ rhythms, and cognition. Here, we used a novel viral approach for reduced BDNF/trkB signaling in PV interneurons in the medial prefrontal cortex (mPFC) to establish the role of BDNF/trkB signaling in adult prefrontal network activities. Reduced BDNF/trkB signaling caused pronounced morphologic alterations, reduced PV inhibition, and deficient prefrontal network dynamics. The altered network activity appeared to manifest across stimuli and brain states and was associated with aberrant local field potential (LFP) activities and increased aggression. The results demonstrate that adult BDNF/trkB signaling is essential to PV inhibition and prefrontal circuit function and directly links BDNF/trkB signaling to network integrity in the adult brain.

Keywords: cortical inhibition; dominant-negative receptor; medial prefrontal cortex; neurotrophins; social behavior; γ oscillations.


Figures

Figure 1.
Figure 1.
Targeting of trkB.DN to mPFC PV interneurons in adult mice. A, Visualization of the molecular diversity of mPFC GABAergic (Vgat-expressing) neurons in a t-SNE plot. Each dot represents an individual GABAergic neuron nucleus (n = 648 nuclei). B, Mapping of the distribution of the expression of Pvalb identified two clusters, cluster 14 (n = 175 nuclei) and 15 (n = 12 nuclei), expressing high levels of Pvalb. C, Distribution of the expression of Ntrk2 in the Pvalb-expressing clusters 14 and 15; 98.9% (173/175) of the nuclei in clusters 14, and 100% (12/12) of the nuclei in cluster 15, express Ntrk2. D, Distribution of the expression Bdnf in the Pvalb-expressing clusters 14 and 15; 2.9% (5/175) of the nuclei in cluster 14, and 0% (0/12) of the nuclei in cluster 15, express Bdnf. E, Cre-expressing neurons transduced by AAV-DIO-trkB.DN-mCherry express the virally expressed trkB.DN-mCherry, and the endogenous full-length (trkB.FL) and truncated (trkB.T) trkB receptors. F, AAV-DIO-trkB.DN-mCherry or AAV-DIO-eYFP was injected into the mPFC in adult (8- to 12-week-old) PV-Cre mice, with the injection center targeted to the prelimbic area (PL). G, Bilateral eYFP (left), and trkB.DN-mCherry (right), expression in mPFC neurons in PV-Cre mice four weeks after viral injections. H, Specificity and efficiency of targeting of trkB.DN to mPFC PV interneurons at the injection site (n = 3 trkB.DN mice). Black bar: percent trkB.DN-mCherry expressing neurons also expressing PV (95.7 ± 3.1%, 1849/1940 neurons); gray bar: percent mPFC PV expressing neurons also expressing trkB.DN-mCherry (56.8 ± 4.1%, 1849/3246 neurons). I, Representative immunohistochemical detection of co-expression of PV (green) and trkB.DN-mCherry (red) in the mPFC of a PV-Cre mouse injected with AAV-DIO-trkB.DN-mCherry. J, Representative immunohistochemical detection of PV (cyan), extracellular (EC) trkB domain (yellow), intracellular (IC) trkB domain (pink), and eYFP (white), or trkB.DN-mCherry (red) in a mPFC PV interneuron in an eYFP mouse (top row) or a trkB.DN mouse (bottom row). K, Levels of the EC trkB domain (left), the IC domain (middle), and the IC/EC ratio in mPFC PV interneurons expressing trkB.DN-mCherry (red; n = 99 neurons in 5 trkB.DN mice) or eYFP (gray; n = 74 neurons in 4 eYFP mice), respectively. EC domain: eYFP: 1,613,709 ± 85,857 a.u.; trkB.DN-mCherry: 2,571,727 ± 145,054 a.u.; U = 1971, p < 0.0001. IC domain: eYFP: 1,522,892 ± 191,982 a.u.; trkB.DN-mcherry 675,638 ± 103,170 a.u.; U = 2268, p < 0.0001. IC/EC ratio: eYFP: 0.62 ± 0.04; trkB.DN-mcherry 0.25 ± 0.03; U = 1455, p < 0.0001. L, Representative immunohistochemical detection of PV (cyan), GABA (pink), and eYFP (white) or trkB.DN-mCherry (red), in a mPFC PV interneuron in an eYFP mouse (top row), and a trkB.DN mouse (bottom row). M, left, The levels of PV protein in the cell body of mPFC PV interneurons expressing eYFP (gray; 6,757,864 ± 276,743 a.u.; n = 62 neurons from 3 eYFP mice) or trkB.DN-mCherry (red; 6,641,059 ± 284,145 a.u.; n = 68 neurons from 3 trkB.DN mice), t = 0.2935, p = 0.7696. Right, The levels of GABA in mPFC PV interneurons expressing eYFP (gray; 1,722,901 ± 116,046 a.u.) and trkB.DN-mCherry (red; 1,298,824 ± 85,478 a.u.), U = 1539, p = 0.0077. For A–D, normalized log2-expression. For H, K, M, data shown as mean ± SEM. Unpaired test, Two-tailed was used to assess significance if data passed the D'Agostino and Pearson normality test, if not, the Wilcoxon rank-sum test was used. Statistics and source data can be found in Extended Data Figures 1-1, 1-2, respectively; **p < 0.01, ***p < 0.001. Scale bars: 75 µm (G), 100 µm (I), 10 µm (J), 10 µm (L).
Figure 2.
Figure 2.
Morphologic alterations in mPFC PV interneurons expressing trkB.DN. A, Anatomical location of the investigated mPFC neurons. Neurons (dots; eYFP mice: gray shades; trkB.DN mice: red shades) were sampled in different layers across the mPFC (+2.2–0.8 mm AP relative to bregma). The layers vary in thickness across the AP extent, and the horizontal bars in blue shades outline the layers' ML extent. Gephyrin: PV interneurons: n = 4, in 2 eYFP mice; n = 5, in 3 trkB.DN mice. PV morphology: biocytin-filled PV basket neurons used for Sholl analysis: n = 14, in 8 eYFP mice; n = 13, in 6 trkB.DN mice. PV intrinsics + morph: biocytin-filled PV basket neurons subjected to Sholl analysis and electrophysiology: n = 2, in 2 eYFP mice; n = 6, in 3 trkB.DN mice. PV intrinsics: PV interneurons subjected to electrophysiology: n = 38, in 17 eYFP mice; n = 36, in 14 trkB.DN mice. PNs spontaneous: PNs subjected to electrophysiology: n = 15, in 3 eYFP mice; n = 14, in 3 trkB.DN mice. B, Representative biocytin-filled mPFC PV basket neurons stained for biocytin (yellow), PV (cyan), and eYFP (white) or mCherry (red) in an eYFP mouse (left column) and a trkB.DN mouse (right column). C, Representative reconstructions of biocytin-filled mPFC PV basket neurons (top) and chandelier neurons (bottom), with color-coding of the traced dendrites (red) and axons (blue), in an eYFP mouse and a trkB.DN mouse. D–O, Data based on Sholl analysis of the biocytin-filled mPFC PV basket neurons (eYFP mice: n = 14; trkB.DN mice: n = 13). D, The neurites (dendrites + axons) of PV basket neurons expressing trkB.DN (red) display increased complexity compared with PV basket neurons expressing eYFP (gray), with a significantly increased number of intersections, particularly 100–200 µm from the soma, and a significantly increased total number of intersections. eYFP: 1908 ± 109.9; trkB.DN: 2536 ± 140.8; U = 26, p = 0.001. Blue shading: significant difference between trkB.DN and eYFP mice. E, PV basket neurons expressing trkB.DN have significantly increased total neurite length compared with PV basket neurons expressing eYFP. eYFP: 31,554 ± 3922 µm; trkB.DN: 39,614 ± 2002 µm; U = 27, p = 0.0013. F, PV basket neurons expressing trkB.DN have significantly increased number of neurites compared with PV basket neurons expressing eYFP. eYFP mice: 310.9 ± 21.58 paths; trkB.DN mice: 413.5 ± 45.49 paths; t = 2.085, p = 0.0474. G, The ending radius of the neurites does not differ between PV basket neurons expressing trkB.DN and PV basket neurons expressing eYFP. eYFP mice: 582.1 ± 33.53 μm; trkB.DN mice: 598.5 ± 40.19 µm; U = 83.5, p = 0.7281 for all neurites combined. H, The dendrites of PV basket neurons expressing trkB.DN display increased complexity compared with PV basket neurons expressing eYFP, as observed by an increased number of intersections at most distances from the soma and a significantly increased total number of intersections. eYFP: 312.1 ± 17.15; trkB.DN: 395.8 ± 33.4; t = 2.278, p = 0.0316. I–K, Comparison of the total dendritic length (I; eYFP mice: 3896 ± 199.8 μm; trkB.DN mice: 5290 ± 405 µm; t = 3.156, p = 0.0041), number of dendrites (J; eYFP mice: 27.43 ± 1.41 dendrites; trkB.DN mice: 35.69 ± 3.54 dendrites; U = 45 p = 0.0236), and ending radius of the dendrites (K; eYFP mice: 357.1 ± 12.69 μm; trkB.DN mice: 446.2 ± 27.65 µm; t = 2.998, p = 0.0061). L, The axons of PV basket neurons expressing trkB.DN display increased complexity compared with PV basket neurons expressing eYFP, with a significantly increased number of intersections, particularly 100–200 µm from the soma, and a significantly increased total number of intersections. eYFP: 1601 ± 118.8; trkB.DN: 2153 ± 114.2; U = 27, p = 0.0013. Blue shading: significant difference between trkB.DN and eYFP mice. M–O, Comparison of the total axonal length (M; eYFP mice: 24,863 ± 1932 μm; trkB.DN mice: 34,337 ± 1705 µm; U = 20, p = 0.0002), number of axons (N, eYFP mice: 283.5 ± 22.2 axons; trkB.DN mice: 377.8 ± 43.95 axons; t = 1.958, p = 0.0614), and ending radius of the axons (O; eYFP mice: 578.6 ± 36.02 μm; trkB.DN mice: 591.5 ± 40.22 µm; U = 89, p = 0.9334). Data shown as mean ± SEM. Unpaired t test, Two-tailed was used to assess significance if data passed the D'Agostino and Pearson normality test, if not, the Wilcoxon rank-sum test was used. For Sholl analysis plot (D, H, L), significance was tested with Multiple t tests with the Holm–Sidak method. Source data can be found in Extended Data Figure 2-1. Scale bar: 50 µm (B); *p < 0.05, **p < 0.01, ***p < 0.001.
Figure 3.
Figure 3.
Detailed morphologic analysis of mPFC PV interneurons expressing trkB.DN. A, Reconstructed biocytin-filled mPFC PV basket neuron with color coding of the axonal (left) and dendritic (right) hierarchical branching. Primary neurites (axons and dendrites): extending from the cell body; secondary neurites: extending from primary neurites; tertiary neurites: extending from secondary neurites, and so on. B–G, Data based on Sholl analysis of biocytin-filled mPFC PV basket neurons. eYFP: n = 14 neurons in 8 mice; trkB.DN: n = 13 neurons in 6 mice. B–D, Sholl profile, the total length, and total number of intersections for the axons. Blue shading: significant difference between trkB.DN and eYFP mice. B, Primary and secondary axons: total length (eYFP: 2878 ± 284.7 μm; trkB.DN: 4377 ± 675.6 μm; t = 2.099, p = 0.0461) and total number of intersections (eYFP: 354 ± 32.17; trkB.DN: 494.8 ± 72.16; t = 1.828, p = 0.0795). C, Tertiary axons: total length (eYFP: 5421 ± 554.3 μm; trkB.DN: 7042 ± 479.3 μm; t = 2.197, p = 0.0375) and total number of intersections (eYFP: 371.0 ± 38.7; trkB.DN: 450.4 ± 30.6; t = 1.591, p = 0.1241). D, > Tertiary axons: total length (eYFP: 16,030 ± 1450 μm; trkB.DN: 23,184 ± 1745 μm; t = 3.171, p = 0.0040) and total number of intersections (eYFP: 1041 ± 91.4; trkB.DN: 1436 ± 114.2; t = 2.715, p = 0.0118). E–G, Sholl profile, the total length, and total number of intersections for the dendrites. E, Primary dendrites: total length (left; eYFP: 1851 ± 139.6 µm; trkB.DN: 2003 ± 200.5 μm; t = 0.6321, p = 0.5331) and total number of intersections (right; eYFP: 153.9 ± 11.8; trkB.DN: 157.6 ± 17.5; t = 0.1768, p = 0.8611). F, Secondary dendrites: total length (eYFP: 1663 ± 95.9 µm; trkB.DN: 2252 ± 206.5 μm; t = 2.648, p = 0.0138) and total number of intersections (eYFP: 130.1 ± 7.5; trkB.DN: 166.7 ± 17.5; t = 1.972, p = 0.0598). G, Tertiary dendrites: total length (eYFP: 407.6 ± 75.0 µm; trkB.DN: 811.2 ± 141.8 μm; t = 2.569, p = 0.0166) and total number of intersections (eYFP: 31.6 ± 5.6; trkB.DN: 58.1 ± 8.6; t = 2.620, p = 0.0147). H, Representative images of axonal boutons (arrowheads) in biocytin-filled mPFC PV basket neurons expressing eYFP (top) or trkB.DN (bottom). I, Expression of trkB.DN results in significantly increased mean bouton size. eYFP: 1.76 ± 0.16 µm2, n = 12 axonal paths from 4 mice; trkB.DN: 2.88 ± 0.17 µm2, n = 12 axonal paths from 4 mice; t = 4.806, p < 0.0001. J, K, Quantification of axonal boutons in biocytin-filled mPFC PV basket neurons expressing trkB.DN (n = 14 neurons in 6 trkB.DN mice) or eYFP (n = 12 neurons in 8 eYFP mice). J, Expression of trkB.DN results in significantly decreased number of boutons/100 µm. eYFP: 12.69 ± 0.66 boutons/100 µm; trkB.DN: 10.92 ± 0.18 boutons/100 µm; t = 2.782, p = 0.0104. K, The total number of boutons along the entire axonal path does not differ between biocytin-filled mPFC PV basket neurons expressing trkB.DN or eYFP. eYFP: 26.19 ± 2.1 boutons/axon, trkB.DN: 28.26 ± 1.93 boutons/axon; t = 0.7255, p = 0.4752. L, Quantification of gephyrin labeled postsynaptic structures in the immediate vicinity of biocytin labeled boutons in biocytin-filled mPFC PV basket neurons expressing trkB.DN (n = 12 axonal paths, in 3 trkB.DN mice) or eYFP (n = 12 axonal paths, in 2 eYFP mice). Left, Percentage of biocytin labeled boutons with gephyrin spots in the immediate vicinity. eYFP mice: 32.9 ± 4.8%; trkB.DN mice: 38.0 ± 7.9%; t = 0.5456, p = 0.5908. Right, Mean center-to-center distances between neighboring gephyrin spots and biocytin labeled boutons. eYFP: 0.48 ± 0.06 µm; trkB.DN: 0.58 ± 0.06 µm; t = 1.140, p = 0.2667. M, N, Representative immunohistochemical detection of gephyrin (red), biocytin (yellow) in mPFC PV interneurons expressing eYFP (M; cyan) or trkB.DN (N; cyan), with orthogonal views in the z-plane. Crosshairs highlight examples of gephyrin spots in the vicinity of a biocytin-filled axonal bouton. 3D examples of gephyrin labeling detected as spots near reconstructed biocytin-filled axonal for both mPFC PV interneurons expressing eYFP (M; bottom-right) or trkB.DN (N; bottom-right). Data shown as mean ± SEM. For Sholl analysis plot (B–G), significance was tested with multiple t tests with the Holm–Sidak method. For bar plots, unpaired t test, two-tailed was used to assess significance if data passed the D'Agostino and Pearson normality test, if not, Wilcoxon rank-sum test was used. Source data can be found in Extended Data Figure 3-1. Scale bars: 10 μm (H) and 1 µm (M, N); *p < 0.05, **p < 0.01, ***p < 0.001.
Figure 4.
Figure 4.
Alterations in intrinsic properties and synaptic connectivity of mPFC PV interneurons expressing trkB.DN. A–E, Voltage clamp recordings of spontaneous events in mPFC PNs in eYFP (gray) and trkB.DN mice (red). A, Schematic of PN recordings. Cs+: cesium. B, Representative traces of IPSCs (black dots) in PNs recorded at 0 mV holding potential. C, D, Synaptic events in PNs in eYFP (gray; n = 15 PNs, in 3 mice) and trkB.DN mice (red; n = 14 PNs, in 3 mice), respectively. C, The frequency of IPSCs was considerably reduced in PNs in trkB.DN mice compared with in eYFP mice. eYFP: 0.91 events/s; trkB.DN: 0.37 events/s; U = 157.5, p = 0.0521. D, The frequency of EPSCs (recorded at −70 mV) in PNs was very low and did not differ between eYFP and trkB.DN mice. eYFP: 0.08 events/s; trkB.DN: 0.08 events/s; U = 124.5, p = 0.6153. E–P, Current clamp recordings of mPFC PV interneurons expressing eYFP (eYFP mice; gray) or trkB.DN (trkB.DN mice; red). E, Schematic of PV recordings. Cl: chloride. F–K, Intrinsic properties of mPFC PV interneurons expressing eYFP (n = 14, in 10 mice) or trkB.DN (n = 19, in 6 mice). F, The AP threshold was significantly reduced in PV interneurons in trkB.DN mice compared with in eYPF mice. eYFP: −38.53 mV; trkB.DN: −42.88 mV; t = 3.9113, p = 0.0005. G, The membrane time constant was significantly increased in PV interneurons in trkB.DN mice compared with in eYPF mice. eYFP: 7.30 ms; trkB.DN: 8.76 ms; t = −2.6968, p = 0.01. H, The membrane capacitance was significantly increased in PV interneurons in trkB.DN mice compared with in eYPF mice. eYFP: 82.6 pF; trkB.DN: 63.1 pF; U = 41, p = 0.0009. I, The input resistance in PV interneurons did not differ between eYFP and trkB.DN mice. eYFP: 112.81 MΩ; trkB.DN: 103.68 MΩ; t = 0.8877, p = 0.4. J, The AP downstroke duration was significantly reduced in PV interneurons in trkB.DN mice compared with in eYPF mice. eYFP: 0.4785 ms; trkB.DN: 0.4350 ms; t = 3.3914, p = 0.0019. K, The AP halfwidth (width at half maximum) in PV interneurons did not differ between eYFP and trkB.DN mice. eYFP: 0.2560 ms; trkB.DN: 0.2330 ms; t = 1.9006, p = 0.07. L, Representative AP traces at twice the rheobase current. M, The firing rate during 1 s at twice the rheobase current injection was significantly reduced in PV interneurons in trkB.DN mice compared with in eYPF mice. eYFP: 204 spikes/s (n = 14, in 10 mice); trkB.DN: 128 spikes/s (n = 19, in 6 mice); t = 3.1393, p = 0.004. N, Firing rate adaptation over 1 s current pulse at twice the rheobase current (eYFP: n = 13 PV, in 10 mice; trkB.DN: n = 19 PV, in 6 mice). Blue shading: the maximal and minimal immediate firing rate +/− 55 ms (for details, see Materials and Methods). O, The maximum firing rate adaptation (the ratio between the maximal and minimal immediate firing rate; blue shading in N), was significantly increased in PV interneurons in trkB.DN mice compared with in eYPF mice. eYFP: 105.7%; trkB.DN: 115.0%; t = −3.3788, p = 0.002. P, The frequency of EPSPs (recorded at −70 mV) was slightly increased in PV interneurons in trkB.DN mice compared with in eYPF mice. eYFP: 0.74 events/s (n = 17, in 11 mice); trkB.DN: 1.33 events/s (n = 19, in 6 mice); U = 91, p = 0.0931. Q–U, Paired recordings of mPFC presynaptic PV interneurons and postsynaptic PNs (PV-PN pairs) in eYFP (gray) and trkB.DN mice (red). Q, Schematic of the paired recordings. R, Representative traces of evoked APs in PV interneurons (bottom) and the corresponding IPSPs in PNs (top). S, The amplitude of the first IPSP in the PNs did not differ between eYFP and trkB.DN mice. eYFP: 0.79 pA (10 pairs, in 8 mice); trkB.DN: 0.76 pA, (8 pairs, in 7 mice); t = −1.1709, p = 0.2588. T, The paired-pulse ratio of the PV-PN pairs did not differ between eYFP and trkB.DN mice. eYFP: 0.78 (n = 6 pairs, in 5 mice); trkB.DN: 0.81 (n = 6 pairs, in 6 mice); t = 0.8238, p = 0.4293. U, The decay time constant of the first IPSP in PNs was significantly increased in trkB.DN mice compared with in eYPF mice. eYFP: 60.36 ms (n = 6 pairs, in 5 mice); trkB.DN: 105.58 ms (n = 6 pairs, in 6 mice); t = −2.4738, p = 0.0329. For boxplots (C, D, F–K, M, O, P, S–U), data shown as median, box (25th and 75th percentiles), and whiskers (data points that are not outliers). Reported values represent median. For N, data shown as mean and confidence interval. Unpaired t test, two-tailed was used to assess significance if data passed the D'Agostino and Pearson normality test, if not, the Wilcoxon rank-sum test was used. Source data can be found in Extended Data Figure 4-1; *p < 0.05, **p < 0.01, ***p < 0.001.
Figure 5.
Figure 5.
Behavioral alterations in trkB.DN mice. A–J, SI investigated by the resident-intruder procedure. trkB.DN mice (n = 8 males), eYFP mice (n = 9 males). A, The resident-intruder procedure was conducted 1 d before viral injection and four times after injection. Pre = before viral injection, post = 49 d after injection. On all occasions, the SI lasted 4 min. B, Percentage of total time spent in non-social (grooming, digging, cage exploration) and social (aggression, tail rattling, sniffing) behaviors for trkB.DN and eYFP mice during SI, preinjection (d-1), and postinjection (d49). No behavioral differences were observed between trkB.DN and eYFP mice before the viral injections (d-1; pre): aggression (eYFP: 1.70 ± 0.87%; trkB.DN: 1.22 ± 0.35%; t = 0.4857, p = 0.6342), tail rattling (eYFP: 0.33 ± 0.33%; trkB.DN: 0.16 ± 0.16%; t = 0.4477, p = 0.6608), sniffing (eYFP: 29.27 ± 5.64%; trkB.DN: 25.11 ± 4.71%; t = 0.5583, p = 0.5849), grooming (eYFP: 0.14 ± 0.10%; trkB.DN: 0.48 ± 0.32%; t = 1.068, p = 0.3022), digging (eYFP: 0.47 ± 0.38%; trkB.DN: 1.17 ± 0.68%; t = 0.9228, p = 0.3707), exploration (eYFP: 14.09 ± 4.74%; trkB.DN: 16.17 ± 2.99%; t = 0.3603, p = 0.7236), and others (eYFP: 53.99 ± 6.91%; trkB.DN: 55.69 ± 6.06%; t = 0.1832, p = 0.8578). C–F, Expression of trkB.DN in mPFC PV interneurons in adult mice results in increased aggression. C, Percentage of time in aggression in the resident intruder procedure 1 d before viral injection (d-1; pre), and 6, 20, 27, and 49 (d49, post) days after injection for trkB.DN and eYFP mice. D, left, Percent time in aggression d49 (post): eYFP: 0.4 ± 0.4%; trkB.DN: 4.1 ± 1.7%; U = 16, p = 0.0226. Right, Change (percent of time) in aggression (pre to post): eYFP: −0.9 ± 0.8%; W = −8, p = 0.1875; trkB.DN: 5 ± 2.2%; W = 26, p = 0.0391. E, left, Number of aggressive bouts d49 (post): eYFP: 3.2 ± 2.9 bouts; trkB.DN: 12.25 ± 4.6 bouts; U = 18.5, p = 0.0771. Right, Change (number) of aggressive bouts (pre to post): eYFP: −3.0 ± 4.3 bouts; W = −8, p = 0.2891; trkB.DN: 6.9 ± 5.2 bouts; W = 16, p = 0.1523. F, Latency to first attack d49 (post): eYFP: 166 ± 37 s; trkB.DN: 118 ± 35 s; t = 0.9349, p = 0.2594. G–J, Non-aggressive behaviors scored in the resident intruder procedure. (No differences were found between trkB.DN and eYFP mice except for measures of aggression). Left, d49 (post). Right, Change between timepoints pre (d1) and post (d49). G, left, Percent time in sniffing d49 (post): eYFP: 37.1 ± 8.6%; trkB.DN: 31.9 ± 7.8%; t = 0.4471, p = 0.6612). Right, Change (percent of time) in sniffing (pre to post): eYFP: 5.0 ± 8.2%; W = 7, p = 0.3672; trkB.DN: 2.2 ± 10.5%; W = 2, p = 0.4727. H, left, Percent time in exploration d49 (post): eYFP: 15 ± 3.8%; trkB.DN: 19 ± 2.5%; t = 0.8738, p = 0.3960. Right, Change (percent of time) in exploration (pre to post): eYFP: 0.9 ± 5.6%, W = 7, p = 0.3672; trkB.DN: 2.9 ± 3.6%; W = 18, p = 0.1172. I, left, Percent time in grooming d49 (post): eYFP: 0.05 ± 0.05%; trkB.DN: 1.17 ± 0.749%; U = 21, p = 0.0905). Right, Change (percent of time) in grooming (pre to post): eYFP: −0.09 ± 0.12%; W = −3, p = 0.375), trkB.DN: 0.69 ± 0.51; W = 6, p = 0.2500. J, Left, Percent time in digging d49 (post): eYFP: 13.6 ± 6.5%; trkB.DN: 7 ± 3.1%; t = 0.8734, p = 0.3962. Right, Change (percent of time) in digging (pre to post): eYFP: 13.10 ± 6.59%, W = 13, p = 0.0625; trkB.DN: 5.851 ± 3.038%; W = 15, p = 0.0781. (K–N) Open field test. Same mice as in A–J, performed d68. K, No difference was found in locomotion between trkB.DN mice and eYFP mice. Locomotion during 60 min: eYFP: 55.94 ± 3.87; trkB.DN: 53.83 ± 4.39 meters; t = 0.3613, p = 0.7229. Bin size: 5 min. L, No difference was found in the number of center visits the first 3 min in the open field test between trkB.DN and eYFP mice: eYFP: 28.7 ± 3.2; trkB.DN: 26.6 ± 3.4 center visits; t = 0.4403, p = 0.666. M, No difference was found in the velocity in the center of the open field box for the first 3 min of the test: eYFP: 0.63 ± 0.05; trkB.DN: 0.64 ± 0.07 m/s; t = 0.0501, p = 0.9607. N, TrkB.DN mice spent significantly less time in the center of the open field box during the first 3 min than eYFP mice: eYFP: 1.90 ± 0.31%; trkB.DN: 1.03 ± 0.23% of time; t = 2.177, p = 0.0458. O–Q, Elevated plus-maze. Same mice as in A–J, performed d71. O, TrkB.DN mice entered the open arms significantly fewer times than eYFP mice: eYFP: 23.44 ± 2.77 entries; trkB.DN: 15.38 ± 1.83 entries; t = 2.364, p = 0.0320. P, TrkB.DN mice made significantly fewer head-dips toward the open arms than eYFP mice: eYFP: 36 ± 4 head-dips; trkB.DN: 28 ± 3 head-dips; U = 15.5, p = 0.0490. Q, No difference was found in the time spent in the open arms between trkB.DN and eYFP mice: eYFP: 41.10 ± 3.37%; trkB.DN: 38.19 ± 3.06% time spent in the open arms; t = 0.6334, p = 0.5360. Data shown as mean ± SEM. For bar plots, unpaired t test, two-tailed was used to assess significance if data passed the D'Agostino and Pearson normality test, if not, Wilcoxon rank-sum test was used. For K, two-way ANOVA, Sidak's multiple comparisons test was used. For paired data, a Wilcoxon matched pairs test was used. Source data can be found in Extended Data Figure 5-1; *p < 0.05.
Figure 6.
Figure 6.
Alterations in LFP activities in trkB.DN mice during SI. A–I, Electrophysiological tetrode recording during the resident-intruder procedure. The experiment was performed once per animal, 50–60 d after viral injection. eYFP mice (gray): n = 4 males, trkB.DN mice (red): n = 5 males. A, Experimental timeline. Baseline: −9–0 min before introduction of the intruder; SI 0–4 min; post-SI 4–14 min after removal of the intruder. B, Example brain sections from an eYFP mouse with electrolytic lesions used to reconstruct the tetrodes positions. C, 3D illustrations of the reconstructed tetrodes positions. Top, View from the front. Bottom, View from the right side. D, Percentage of total time spent in non-social (grooming, digging, cage exploration) and social (aggression, tail rattling, sniffing) behaviors for trkB.DN and eYFP mice during SI (4 min). Sniffing: eYFP: 60.3 ± 6.4%; trkB.DN: 56.1 ± 8.2%; t = 0.38, p = 0.7125; grooming: eYFP: 0.8 ± 0.5%; trkB.DN: 0.0%; t = 1.73, p = 0.1279; exploration: eYFP: 7.6 ± 2.1%; trkB.DN: 11.0 ± 5.6%; t = −0.51, p = 0.6242; others: eYFP: 29.6 ± 4.7%; trkB.DN: 23.1 ± 5.1%; t = 0.91, p = 0.3907. No digging or tail rattling was observed. E, left, Percentage time in aggression: eYFP: 1.7 ± 1.0%; trkB.DN: 9.8 ± 5.5% of time; t = −1.27, p = 0.2452. Right, Number of aggressive bouts: eYFP: 1.8 ± 0.5; trkB.DN: 3.2 ± 0.7 bouts; t = 0.71, p = 0.503. F, There was no difference in the mean velocity of locomotion between implanted eYFP mice and trkB.DN mice during baseline, SI, or post-SI: baseline: eYFP: 179.8 ± 38.5; trkB.DN: 189.8 ± 29.1 pixels/s; t = 0.21, p = 0.839, SI: eYFP: 229.3 ± 42.5; trkB.DN: 212.8 ± 32.9 pixels/s; t = −0.31, p = 0.764, post-SI: eYFP: 169.5 ± 26.5; trkB.DN: 177.3 ± 24.1 pixels/s; t = 0.22, p = 0.834. G–I, LFP activities during SI. G, Bootstrapped normalized PSD of the LFP for baseline, SI, and post-SI for eYFP (left) and trkB.DN mice (right). Gray shading: the θ (6–10 Hz), β (12–24 Hz), and γ (30–95 Hz) band, respectively. Left, SI increases the power across many frequencies in eYFP mice, with further increases post-SI. Right, SI induces limited power changes in trkB.DN mice. H, I, The distribution of the PSD in specific frequency bands (θ, β, and γ, respectively) during baseline, SI, and post-SI for eYFP (grays) and trkB.DN (reds) mice. H, Comparison of the PSDs in the three frequency bands during baseline, SI, and post-SI for eYFP mice (left) and trkB.DN mice (right), respectively. SI significantly increased the power in the β and γ bands in the eYFP mice. The only significant change in the trkB.DN mice was an increase in γ power after SI. I, Direct comparison of the PSDs in the three frequency bands between eYFP mice (gray) and trkB.DN mice (red) during baseline, SI, and post-SI. trkB.DN mice have significantly increased baseline activity in all three frequency bands compared with eYFP mice. SI increases the power in the eYFP mice, but not in trkB.DN mice, diminishing the power difference between the two groups of mice. The power increases further in eYFP mice after SI, with eYFP mice displaying significantly higher γ power than trkB.DN mice post-SI (despite the baseline γ power being significantly higher in trkB.DN mice than in eYFP mice). Individual data point and confidence interval values for θ, β, and γ range power intragroup (H) and intergroup (I) comparisons can be found in Extended Data Figures 1-1, 6-1. Data shown as mean ± SEM for E–G. Data shown as mean ± SD for H, I. For bar plots, Unpaired t test, two-tailed was used to assess significance if data passed the Kolmogorov–Smirnov normality test, if not, the Wilcoxon test was used. For H, I, confidence intervals of bootstrapped data were used to assess significance. Source data can be found in Extended Data Figure 6-1. Scale bar: 100 µm (B); * confidence interval not including 0.
Figure 7.
Figure 7.
Alterations in single-unit and population activities in trkB.DN mice during SI. A–K, Same recordings and mice as in Figure 6. Single unit and population activities during SI. eYFP mice: gray, trkB.DN mice: red. A, Classification of recorded single-units into NS putative inhibitory interneurons and WS putative excitatory PNs based on spike waveform features [the peak to trough duration (d)]. NS (orange): n = 18, mean d = 0.177 ± 0.012 ms; WS (blue): n = 69, mean d = 0.309 ± 0.028 ms; unclassified units (gray): n = 1. Inset, The spike waveform features used to characterize APs: peak (p), trough (t), and peak to trough duration (d). B, Normalized average spike waveforms of the classified NS (orange) and WS (blue) neurons. Left, All neurons (eYFP + trkB.DN mice), Middle, Neurons in eYFP mice. Right, Neurons in trkB.DN mice. C, The spike waveforms (peak to trough duration) of NS (orange shading) and WS (blue shading) neurons did not differ between trkB.DN (red) and eYFP (gray) mice: NS: eYFP: 0.183 ± 0.009 ms; trkB.DN: 0.175 ± 0.013 ms; t = −1.93, p = 0.22; WS: eYFP: 0.319 ± 0.025 ms; trkB.DN: 0.305 ± 0.029 ms; t = −1.27 p = 0.06. D–K, Analysis of the WS neurons. D, E, There is no difference in the baseline (−9–0 min) firing of WS neurons between trkB.DN and eYFP mice. D, left, Average firing rate of WS neurons during baseline: eYFP: 7.2 ± 0.17; trkB.DN: 6.08 ± 0.12 spike/s. Right, The cumulative distribution of the firing rate of WS neurons during baseline; KS-stat = 0.32, p = 0.08. E, left, CV ISI distribution during baseline: eYFP: 0.76 ± 0.01; trkB.DN: 0.637 ± 0.004. Right, The cumulative distribution of the CV ISI during baseline, KS-stat = 0.31, p = 0.1. AF, The firing rate (z-scored) of individual WS neurons in eYFP mice (top: n = 21 neurons) and trkB.DN mice (bottom: n = 48 neurons) during baseline, SI, and post-SI. Dashed lines outline the SI period. G, Mean firing rate (z-scored) of the WS population in the eYFP and trkB.DN mice during baseline, SI, and post-SI. Left, SI significantly increased the firing rate of the WS population in trkB.DN mice but significantly decreased the firing rate of the WS population in eYFP mice. Baseline (−9–0 min) versus 0–14 min (SI + post-SI): eYFP: −0.34 ± 0.87; W = 190, p = 0.0096; trkB.DN: 0.42 ± 0.21; W = 368, p = 0.0240. Right, Change in mean firing rate from baseline. SI increased the WS firing in trkB.DN mice but not in eYFP mice. SI: eYFP: −0.07 ± 0.25; trkB.DN: 0.71 ± 0.35; U = 647, p = 0.06. After SI the WS firing was significantly higher in trkB.DN mice than in eYFP mice. Post-SI: eYFP: −0.45 ± 0.17; trkB.DN: 0.31 ± 0.18; U = 763, p = 0.001. H, Based on their individual firing rate during SI (0–4 min), a significantly higher proportion of the WS neurons was positively modulated by SI in trkB.DN mice than in eYFP mice: eYFP: 19% (4 neurons); trkB.DN: 46%, (22 neurons); p = 0.03, χ2 = 4.46. A lower proportion of the WS neurons was negatively modulated by SI in trkB.DN mice than in eYFP mice: eYFP: 48% (10 neurons); trkB.DN: 29% (14 neurons); p = 0.14, χ2 = 2.19. Not modulated neurons: eYFP: 33% (7 neurons); trkB.DN: 25% (12 neurons); p = 0.48, χ2 = 0.51. I–K, The firing rate of the positively, negatively, and not modulated WS subpopulations did not differ between eYFP and trkB.DN mice during SI (0–4 min). I, Mean firing rate (z-scored) of positively modulated WS neuron: SI: eYFP: 1.65 ± 0.83; trkB.DN: 2.31 ± 0.56; U = 47, p = 0.75, post-SI: eYFP: 0.52 ± 0.52; trkB.DN: 0.76 ± 0.32; U = 49, p = 0.86. J, Mean firing rate (z-scored) of negatively modulated WS neuron: SI: eYFP: −0.73 ± 0.16; trkB.DN: −1.12 ± 0.32; U = 62, p = 0.66), post-SI: eYFP: −0.84 ± 0.20; trkB.DN: −0.37 ± 0.30; U = 89, p = 0.28. K, Mean firing rate (z-scored) of not modulated WS neuron: SI: eYFP: −0.11 ± 0.07; trkB.DN: −0.08 ± 0.06; U = 44, p = 0.90); post-SI: eYFP: −0.46 ± 0.12; trkB.DN: 0.26 ± 0.14; U = 78, p = 0.001. Data shown as mean ± SEM for (G, I–K). For boxplots in D, E, data shown as median (white line), mean (squared dot), box (25th and 75th percentiles), whiskers (data points that are not outliers), and dots (outliers). For cumulative distribution function in D, E, the Kolmogorov–Smirnov test was used. For bar plots in G, Unpaired t test, two-tailed was used to assess significance if data passed the Kolmogorov–Smirnov normality test, if not, the Wilcoxon test was used. For paired data in G, the Wilcoxon signed-rank test was used. For H, the χ2 proportion test was used. Source data can be found in Extended Data Figure 7-1; *p < 0.05, **p < 0.01.
Figure 8.
Figure 8.
Alterations in WS population dynamics in trkB.DN mice during SI. A–E, Analysis of the population dynamics of the WS neurons during SI, same neurons as in Figure 7. eYFP mice: gray, trkB.DN mice: red. A, 2D projection of the neuronal population trajectories of the response patterns of WS neurons in eYFP mice (left) and trkB.DN mice (right) during the resident-intruder procedure, with color coding of the timeline (bin size: 4 s). PC1 and PC2 explained, respectively, 23.4% and 14.0% of variance seen in the eYFP mice, while PC1 and PC2 explained, respectively, 42.8% and 11.3% of variance in the trkB.DN mice. B, C, Scatter plot and kernel density estimation of the 2D projection of the population dynamics (bin size: 4 s). Each data point corresponds to the first and second PC, color coded according to the behavioral epoch (baseline, black; SI, green; and post-SI, red). B, In eYFP mice, the population activity patterns of the three behavioral epochs separated into defined but overlapping clusters. Inset, The probability distribution of the Euclidean distance differed between the behavioral epochs (one-way ANOVA, Fcluster(2,342) = 19.1, p < 0.001), with a significant difference between SI and post-SI (p < 0.001), and baseline and post-SI (p < 0.001). However, the probability distribution of the Euclidean distance of the baseline and SI did not differ (p = 1). C, In trkB.DN mice, the population activities during baseline clustered together, with minimal overlap with the activity patterns during SI and post-SI. The population activities during SI and post-SI were considerably more variable but did yet separate. Inlet, The probability distribution of the Euclidean distance significantly differed between the three behavioral epoch (one-way ANOVA, Fcluster(2,342) = 52.7, p < 0.001), with significant differences between baseline and SI (p < 0.001), SI and post-SI (p < 0.001), and baseline and post-SI (p < 0.001). D, Comparison of the probability distribution of the Euclidean distance for each behavioral epoch [baseline (left), SI (middle), and post-SI (right)] revealed significant differences between eYFP and trkB.DN mice, particularly during SI [inset, cumulative distribution function (CDF) comparison: KS-stat = 0.85, p = 3.15 × 10⁻²⁰]. Baseline (inset, CDF comparison: KS-stat = 0.31, p = 2.7 × 10⁻⁶); post-SI (inset, CDF comparison: KS-stat = 0.47, p = 1.8 × 10⁻¹⁵). E, To separate the population dynamics of the positively, negatively, and not modulated WS subpopulations during SI, a bootstrapped version of the trajectory analysis was performed. This revealed high variability in the Euclidean distance of specifically the positively modulated WS neurons in the trkB.DN mice (right), variability not present in the eYFP mice (left). For B, C, one-way ANOVA was used along with a Bonferroni post hoc test. For CDF plots (D), the Kolmogorov–Smirnov test was used. Source data can be found in Extended Data Figure 8-1.
Figure 9.
Figure 9.
Alterations in single-unit activities in trkB.DN mice in response to tail pinch. A–N, Extracellular single-unit and LFP recordings under urethane anesthesia. eYFP mice (gray): n = 4 males, trkB.DN mice (red): n = 5 males. A, 3D illustrations of the reconstructed probe positions. Top, View from the front. Bottom, View from the right side. B, Example brain sections from an eYFP mouse with DiI labeling (white) of the tracts from the four-shank silicon probe. C, D, Representative LFP recording (6 min shown) from an eYFP (C) and a trkB.DN (D) mouse before, during, and after tail pinch. Violet vertical bar, tail pinch (7 s). Left, top, Filtered (0–200 Hz) LFP. Dashed box, Shown in closeup on the right. Bottom, Wavelet spectrogram of LFP showing the decrease in power in slow frequencies (0.5–2.0 Hz) in response to tail pinch. Dashed line: start of tail pinch. Right, Close up of the dashed box in top left. Filtering of the LFP into different frequency bands. E, Classification of recorded single-units into NS, putative inhibitory interneurons and WS putative excitatory PNs based on spike waveform features [the peak to trough duration (d)]. NS (orange): n = 56, mean d = 0.194 ± 0.025 ms; WS (blue): n = 289, mean d = 0.307 ± 0.019 ms; gray: unclassified units (n = 5). F, Normalized average spike waveforms of the classified NS (orange) and WS (blue) neurons. Left, All neurons (eYFP + trkB.DN mice). Middle, Neurons in eYFP mice. Right, Neurons in trkB.DN mice. G, The spike waveforms (peak to trough duration) of NS (orange shading) and WS (blue shading) neurons do not differ between trkB.DN (red) and eYFP mice (gray): NS: eYFP: 0.191 ± 0.021 ms; trkB.DN: 0.195 ± 0.027 ms; U = 8983, p = 0.23, WS: eYFP: 0.309 ± 0.019 ms; trkB.DN: 0.306 ± 0.019 ms; U = 1063, p = 0.80. H–N, Activity of WS neurons. H, I, There is no difference in the baseline (−2–0 min) firing of WS neurons between trkB.DN (red) and eYFP (gray) mice. H, left, Average firing rate of WS neurons during baseline: eYFP: 9.28 ± 0.19; trkB.DN: 8.67 ± 0.11 spike/s. Right, The cumulative distribution of the firing rate of WS neurons during baseline; KS-stat = 0.16, p = 0.43. I, left, CV ISI distribution during baseline: eYFP: 0.72 ± 0.01; trkB.DN: 0.65 ± 0.01. Right, The cumulative distribution of the CV ISI during baseline, KS-stat = 0.15, p = 0.58. J, Top, Raster plot of the spiking of the WS neurons in eYFP mice (gray) and trkB.DN mice (red) before, during (violet vertical bar, 7 s), and after tail pinch. Bottom, The spike probability. K, The firing rate (z-scored) of individual WS neurons in eYFP mice (top: n = 45 neurons) and trkB.DN mice (bottom: n = 86 neurons) before, during, and after tail pinch. Dashed line: start of tail pinch. L, Mean firing rate (z-scored) of the WS population in eYFP and trkB.DN mice. Left, Tail pinch increased the firing rate of the WS population to a higher degree in trkB.DN mice than in eYFP mice. Dashed line: start of tail pinch. Right, The WS population in trkB.DN mice had a significantly higher firing rate than the WS population in eYFP mice 0–2 min after a tail pinch (eYFP: 0.19 ± 0.23; trkB.DN: 1.28 ± 0.46; U = 2434, p = 0.01), but not 2–4 min after the tail pinch (eYFP: 0.16 ± 0.20; trkB.DN: 0.28 ± 0.15; U = 2072, p = 0.51). The firing rate of the WS neurons in the trkB.DN mice decreased significantly after 2 min (W = 2567, p = 6 × 10⁻⁵) but not in the eYFP mice (W = 470, p = 0.5918). M, Based on the firing rate of the individual WS neurons after tail pinch (0–2 min), a significantly higher proportion of the WS neurons was positively modulated by SI in trkB.DN mice than in eYFP mice. eYFP: 22% (10 neurons); trkB.DN: 51% (44 neurons), p = 0.001, χ2 = 10.21. A significantly lower proportion of the WS neurons was negatively modulated by SI in trkB.DN mice than in eYFP mice. eYFP: 58%, (26 neurons); trkB.DN: 34% (29 neurons), p = 0.008, χ2 = 7.01. Not modulated neurons: eYFP: 20% (9 neurons); trkB.DN: 15% (13 neurons), p = 0.48, χ2 = 0.50. N, The mean firing rate (z-scored) of the positively (left), negatively (middle), and not modulated (right), WS subpopulations. No differences in the mean firing rate of the WS populations were found for any of the three subpopulations between trkB.DN and eYFP mice. Positively modulated: 0–2 min: eYFP: 2.38 ± 0.38; trkB.DN: 2.89 ± 1.02; U = 179, p = 0.37; and 2–4 min: eYFP: 1.72 ± 0.36; trkB.DN: 0.95 ± 0.30; U = 164, p = 0.22. Negatively modulated: 0–2 min: eYFP: −0.13 ± 0.10; trkB.DN: −0.58 ± 0.05; U = 292, p = 0.15; and 2–4 min: eYFP: −0.40 ± 0.14; trkB.DN: −0.53 ± 0.06; U = 264, p = 0.06. Not modulated: 0–2 min: eYFP: −0.15 ± 0.02; trkB.DN: −0.02 ± 0.03; U = 85, p = 0.08; and 2–4 min: eYFP: 0.03 ± 0.10; trkB.DN: −0.15 ± 0.10; U = 54, p = 0.79. Dashed line: start of tail pinch. Data shown as mean ± SEM. For bar plots, the Wilcoxon rank-sum test was used to assess significance since data did not pass the Kolmogorov–Smirnov test for normality. For boxplots (H, I), data shown as median (white line), mean (squared dot), box (25th and 75th percentiles), whiskers (data points that are not outliers), and dots (outliers). For paired data in (L), the Wilcoxon signed-rank test was used. Source data can be found in Extended Data Figure 9-1; *p < 0.05, **p < 0.01.
Figure 10.
Figure 10.
Alterations in WS population dynamics in trkB.DN mice in response to tail pinch. A–E, Analysis of the population dynamics of the WS neurons in response to tail pinch, same neurons as in Figure 9. eYFP mice: gray, trkB.DN mice: red. A, 2D projection of the neuronal population trajectories of the response patterns of WS neurons in eYFP mice (left) and trkB.DN mice (right) during the tail pinch experiment, with color coding of the timeline (bin size: 1 s). PC1 and PC2 explained, respectively, 25.2% and 19.2% of variance in the eYFP mice, while PC1 and PC2 explained, respectively, 68.4% and 8.6% of variance in the trkB.DN mice. B, C, Scatter plot and kernel density estimation of the 2D projection of WS population dynamics. Each data point corresponds to the first and second PC, color coded according to the temporal intervals (−2–0 min, black; 0–2 min, green; and 2–4 min, red). B, In eYFP mice, the population activity patterns of the three temporal intervals separated into defined clusters with little variability or overlap. Inset, The probability distribution of the Euclidean distance differed between the temporal intervals (one-way ANOVA, Fcluster(2,357) = 69.4, p < 0.001), with significant differences between −2–0 and 0–2 min (p < 0.001), between −2–0 and 2–4 min (p < 0.001), and between 0–2 and 2–4 min (p = 0.04). C, In trkB.DN mice, the population activities during baseline clustered together, with minimal overlap with the activity patterns during SI and post-SI. The population activities during SI and post-SI were considerably more variable but did yet separate. Inset, The probability distribution of Euclidean distance significantly differed between the temporal intervals (one-way ANOVA, Fcluster(2,357) = 167.8, p < 0.001), with significant differences between −2–0 and 0–2 min (p < 0.001), between 0–2 and 2–4 min (p = 0.004), and between −2–0 and 2–4 min (p < 0.001). D, Comparison of the probability distribution of the Euclidean distance for each temporal interval [−2–0 min (left), 0–2 min (middle), and 2–4 min (right)] revealed significant differences between eYFP and trkB mice 0–2 min after tail pinch [inset, cumulative distribution function (CDF) comparison: KS-stat = 0.73, p = 1.97 × 10⁻¹⁹] and 2–4 min after tail pinch (inset, CDF comparison: KS-stat = 0.67, p = 2.13 × 10⁻²⁴). −2–0 min (inset, CDF comparison: KS-stat = 0.16, p = 0.089). E, To separate the population dynamics of the positively, negatively, and not modulated WS subpopulations during 0–2 min after tail pinch, a bootstrapped version of the trajectory analysis was performed. This revealed high variability in the Euclidean distance of specifically the positively modulated WS neurons in the trkB.DN mice (right), variability not present in the eYFP mice (left). For B, C, one-way ANOVA was used along with a Bonferroni post hoc test. For the CDF plots (D), Kolmogorov–Smirnov test was used to assess significance. Source data can be found in Extended Data Figure 10-1.

Similar articles

Cited by

References

    1. Agetsuma M, Hamm JP, Tao K, Fujisawa S, Yuste R (2018) Parvalbumin-positive interneurons regulate neuronal ensembles in visual cortex. Cereb Cortex 28:1831–1845. 10.1093/cercor/bhx169 - DOI - PMC - PubMed
    1. Andero R, Choi DC, Ressler KJ (2014) BDNF-TrkB receptor regulation of distributed adult neural plasticity, memory formation, and psychiatric disorders. Prog Mol Biol Transl Sci 122:169–192. 10.1016/B978-0-12-420170-5.00006-4 - DOI - PubMed
    1. Ardid S, Vinck M, Kaping D, Marquez S, Everling S, Womelsdorf T (2015) Mapping of functionally characterized cell classes onto canonical circuit operations in primate prefrontal cortex. J Neurosci 35:2975–2991. 10.1523/JNEUROSCI.2700-14.2015 - DOI - PMC - PubMed
    1. Bakker R, Tiesinga P, Kötter R (2015) The scalable brain atlas: instant web-based access to public brain atlases and related content. Neuroinformatics 13:353–366. 10.1007/s12021-014-9258-x - DOI - PMC - PubMed
    1. Barfield ET, Gourley SL (2018) Prefrontal cortical trkB, glucocorticoids, and their interactions in stress and developmental contexts. Neurosci Biobehav Rev 95:535–558. 10.1016/j.neubiorev.2018.10.015 - DOI - PMC - PubMed

Publication types

LinkOut - more resources