. 2021 Apr 7;41(14):3142-3162.
doi: 10.1523/JNEUROSCI.1732-20.2021. Epub 2021 Feb 16.

Diversity of Receptive Fields and Sideband Inhibition with Complex Thalamocortical and Intracortical Origin in L2/3 of Mouse Primary Auditory Cortex

Affiliations

Diversity of Receptive Fields and Sideband Inhibition with Complex Thalamocortical and Intracortical Origin in L2/3 of Mouse Primary Auditory Cortex

Ji Liu et al. J Neurosci. .

Abstract

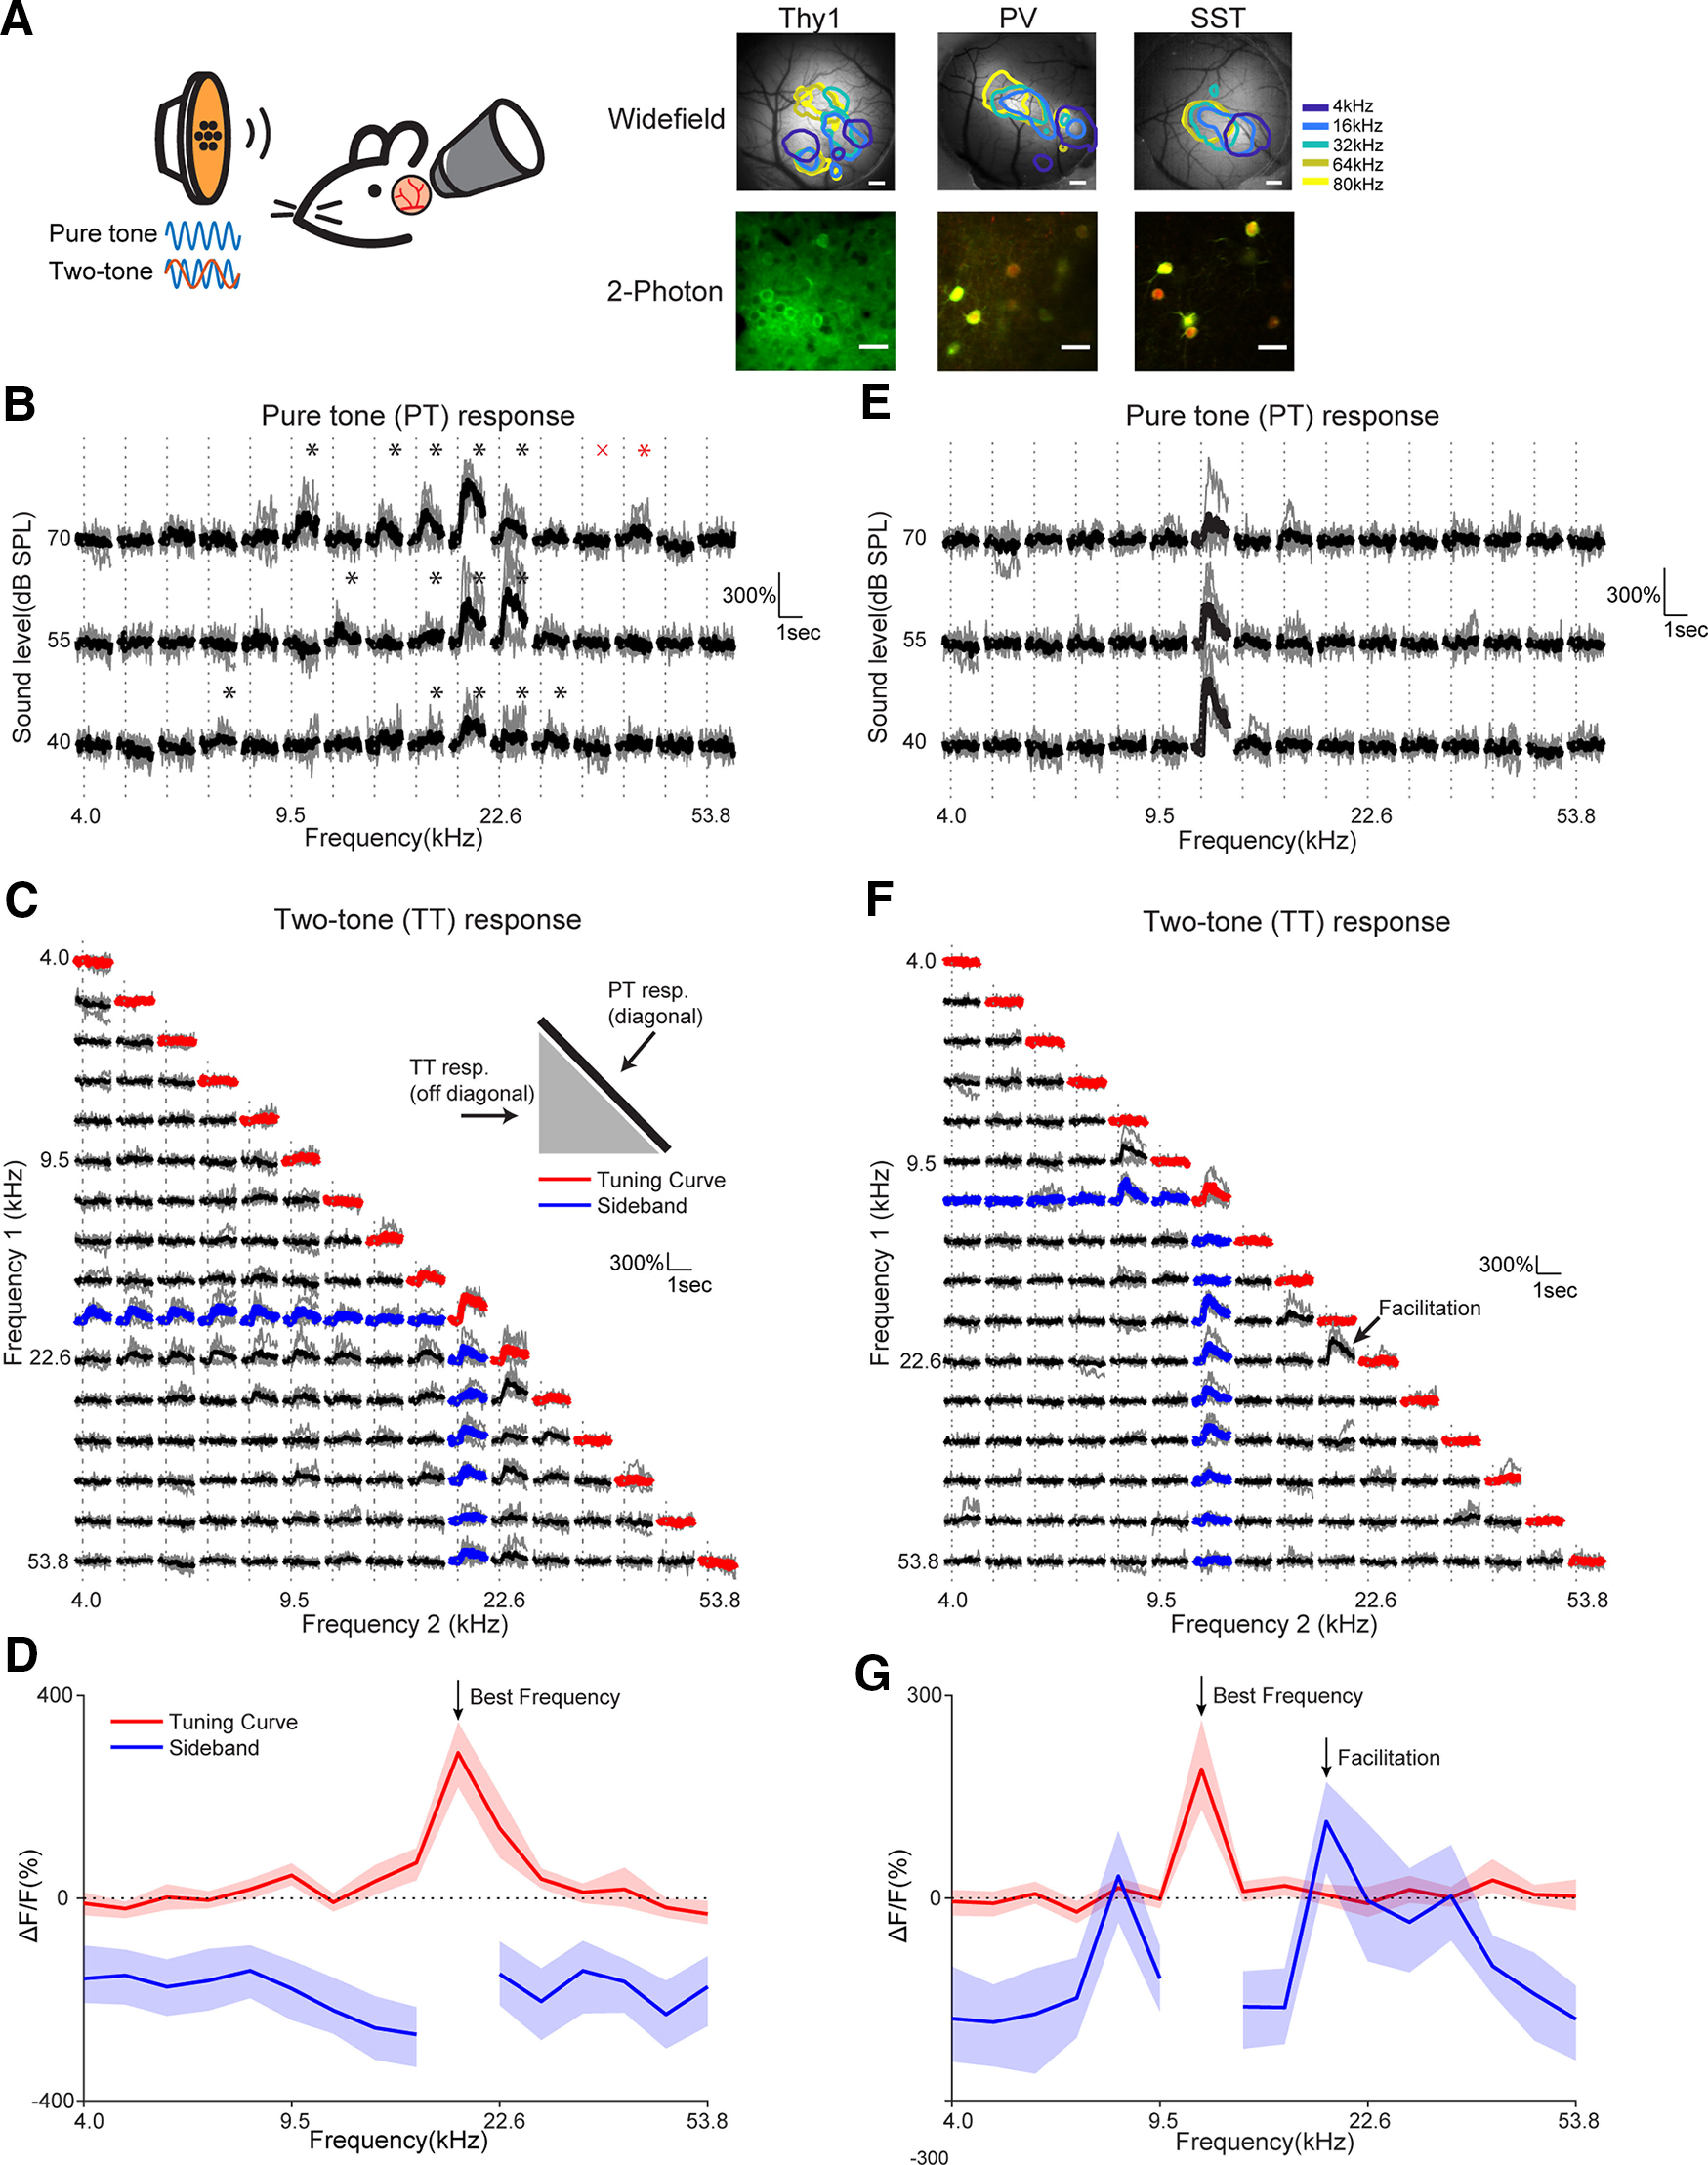
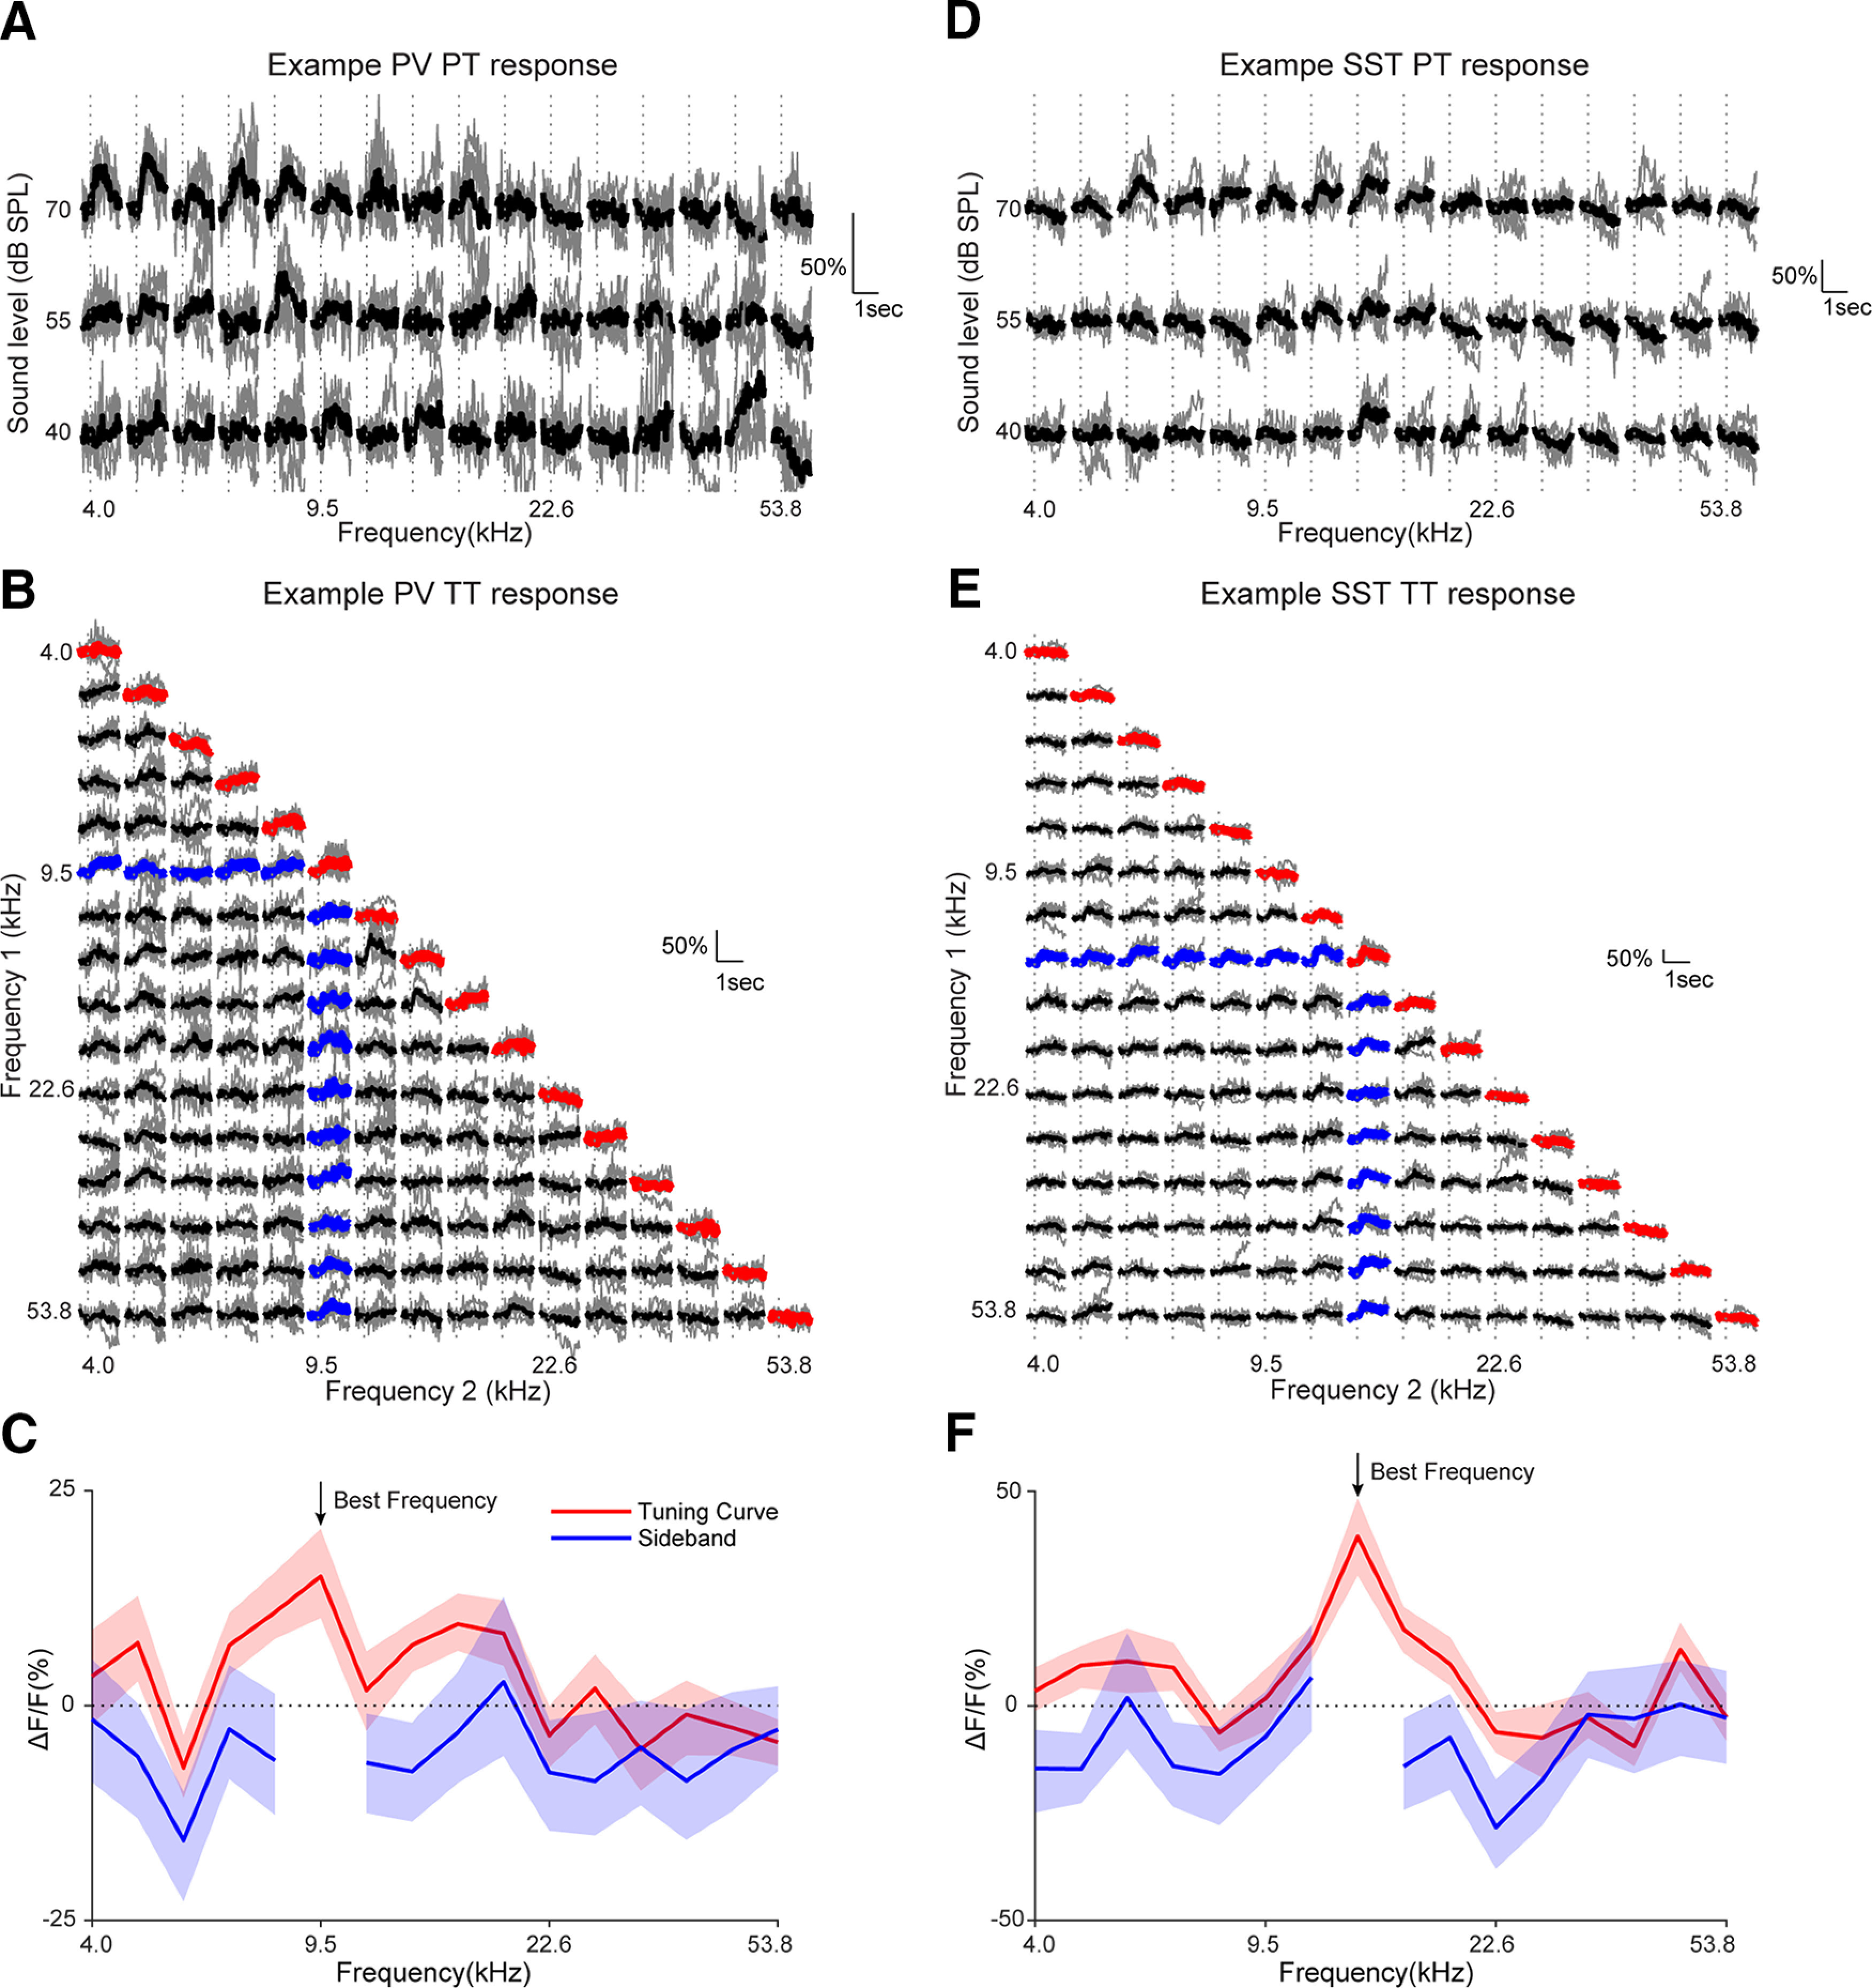
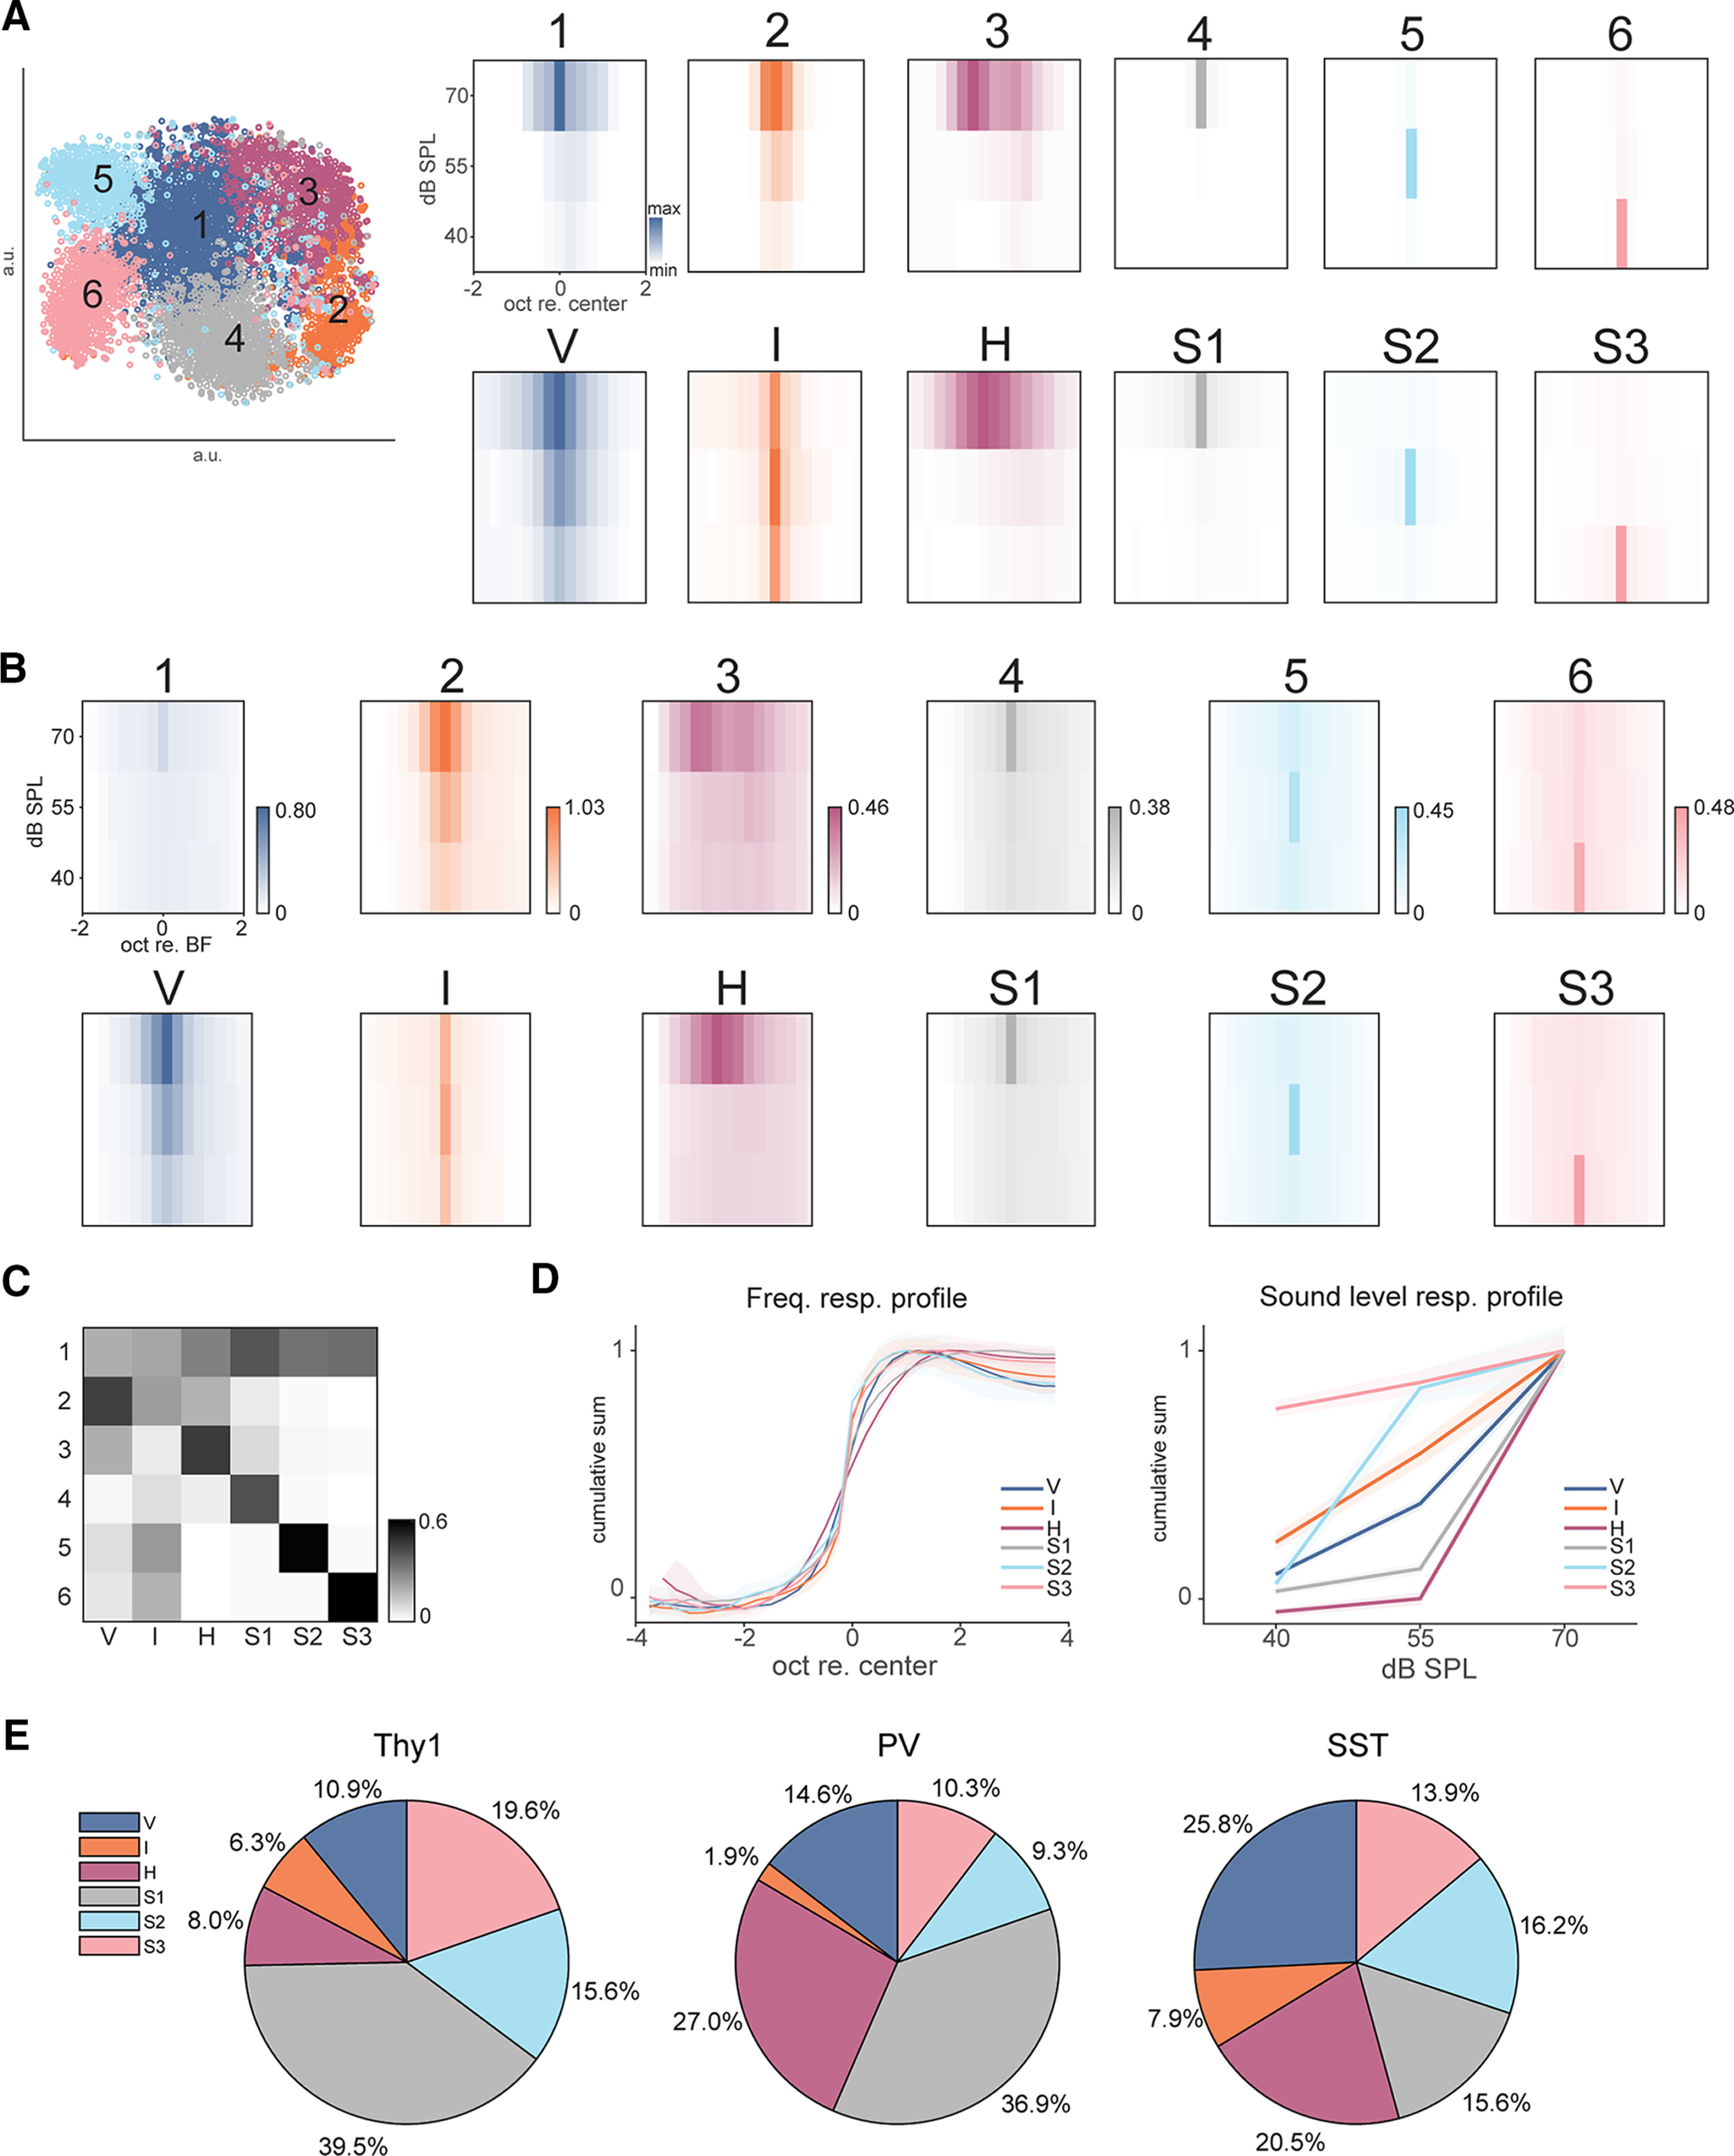
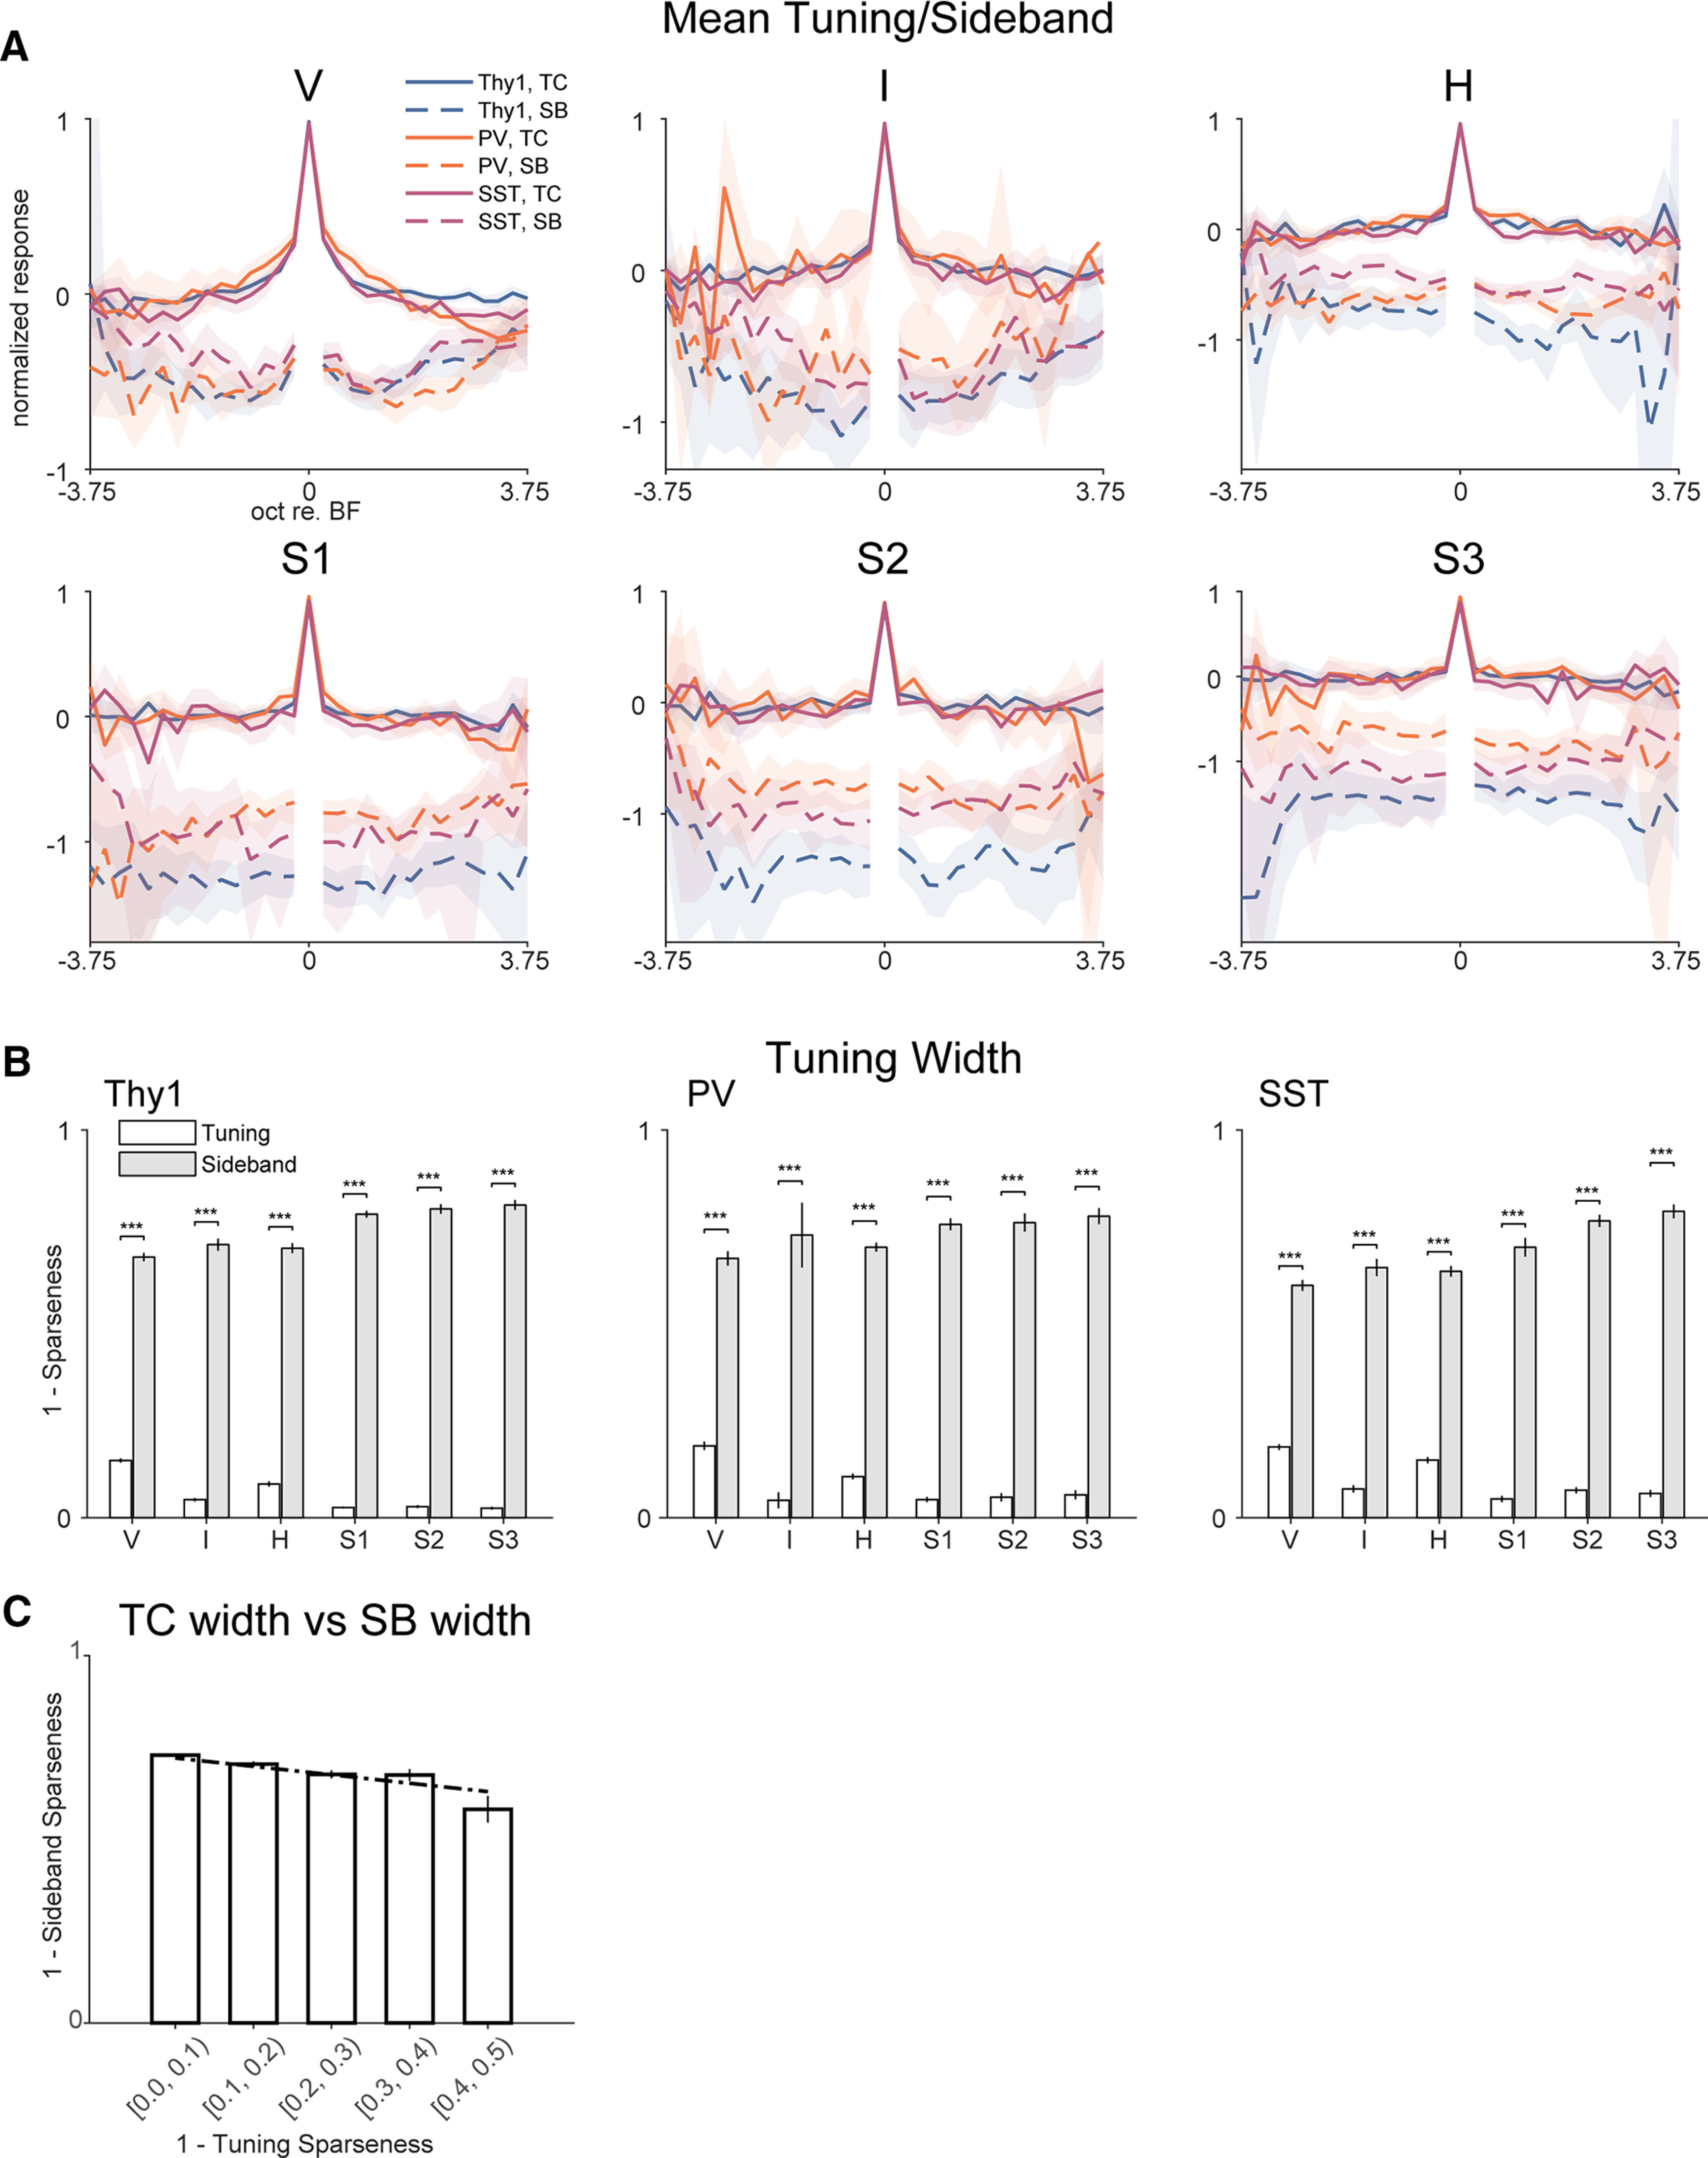
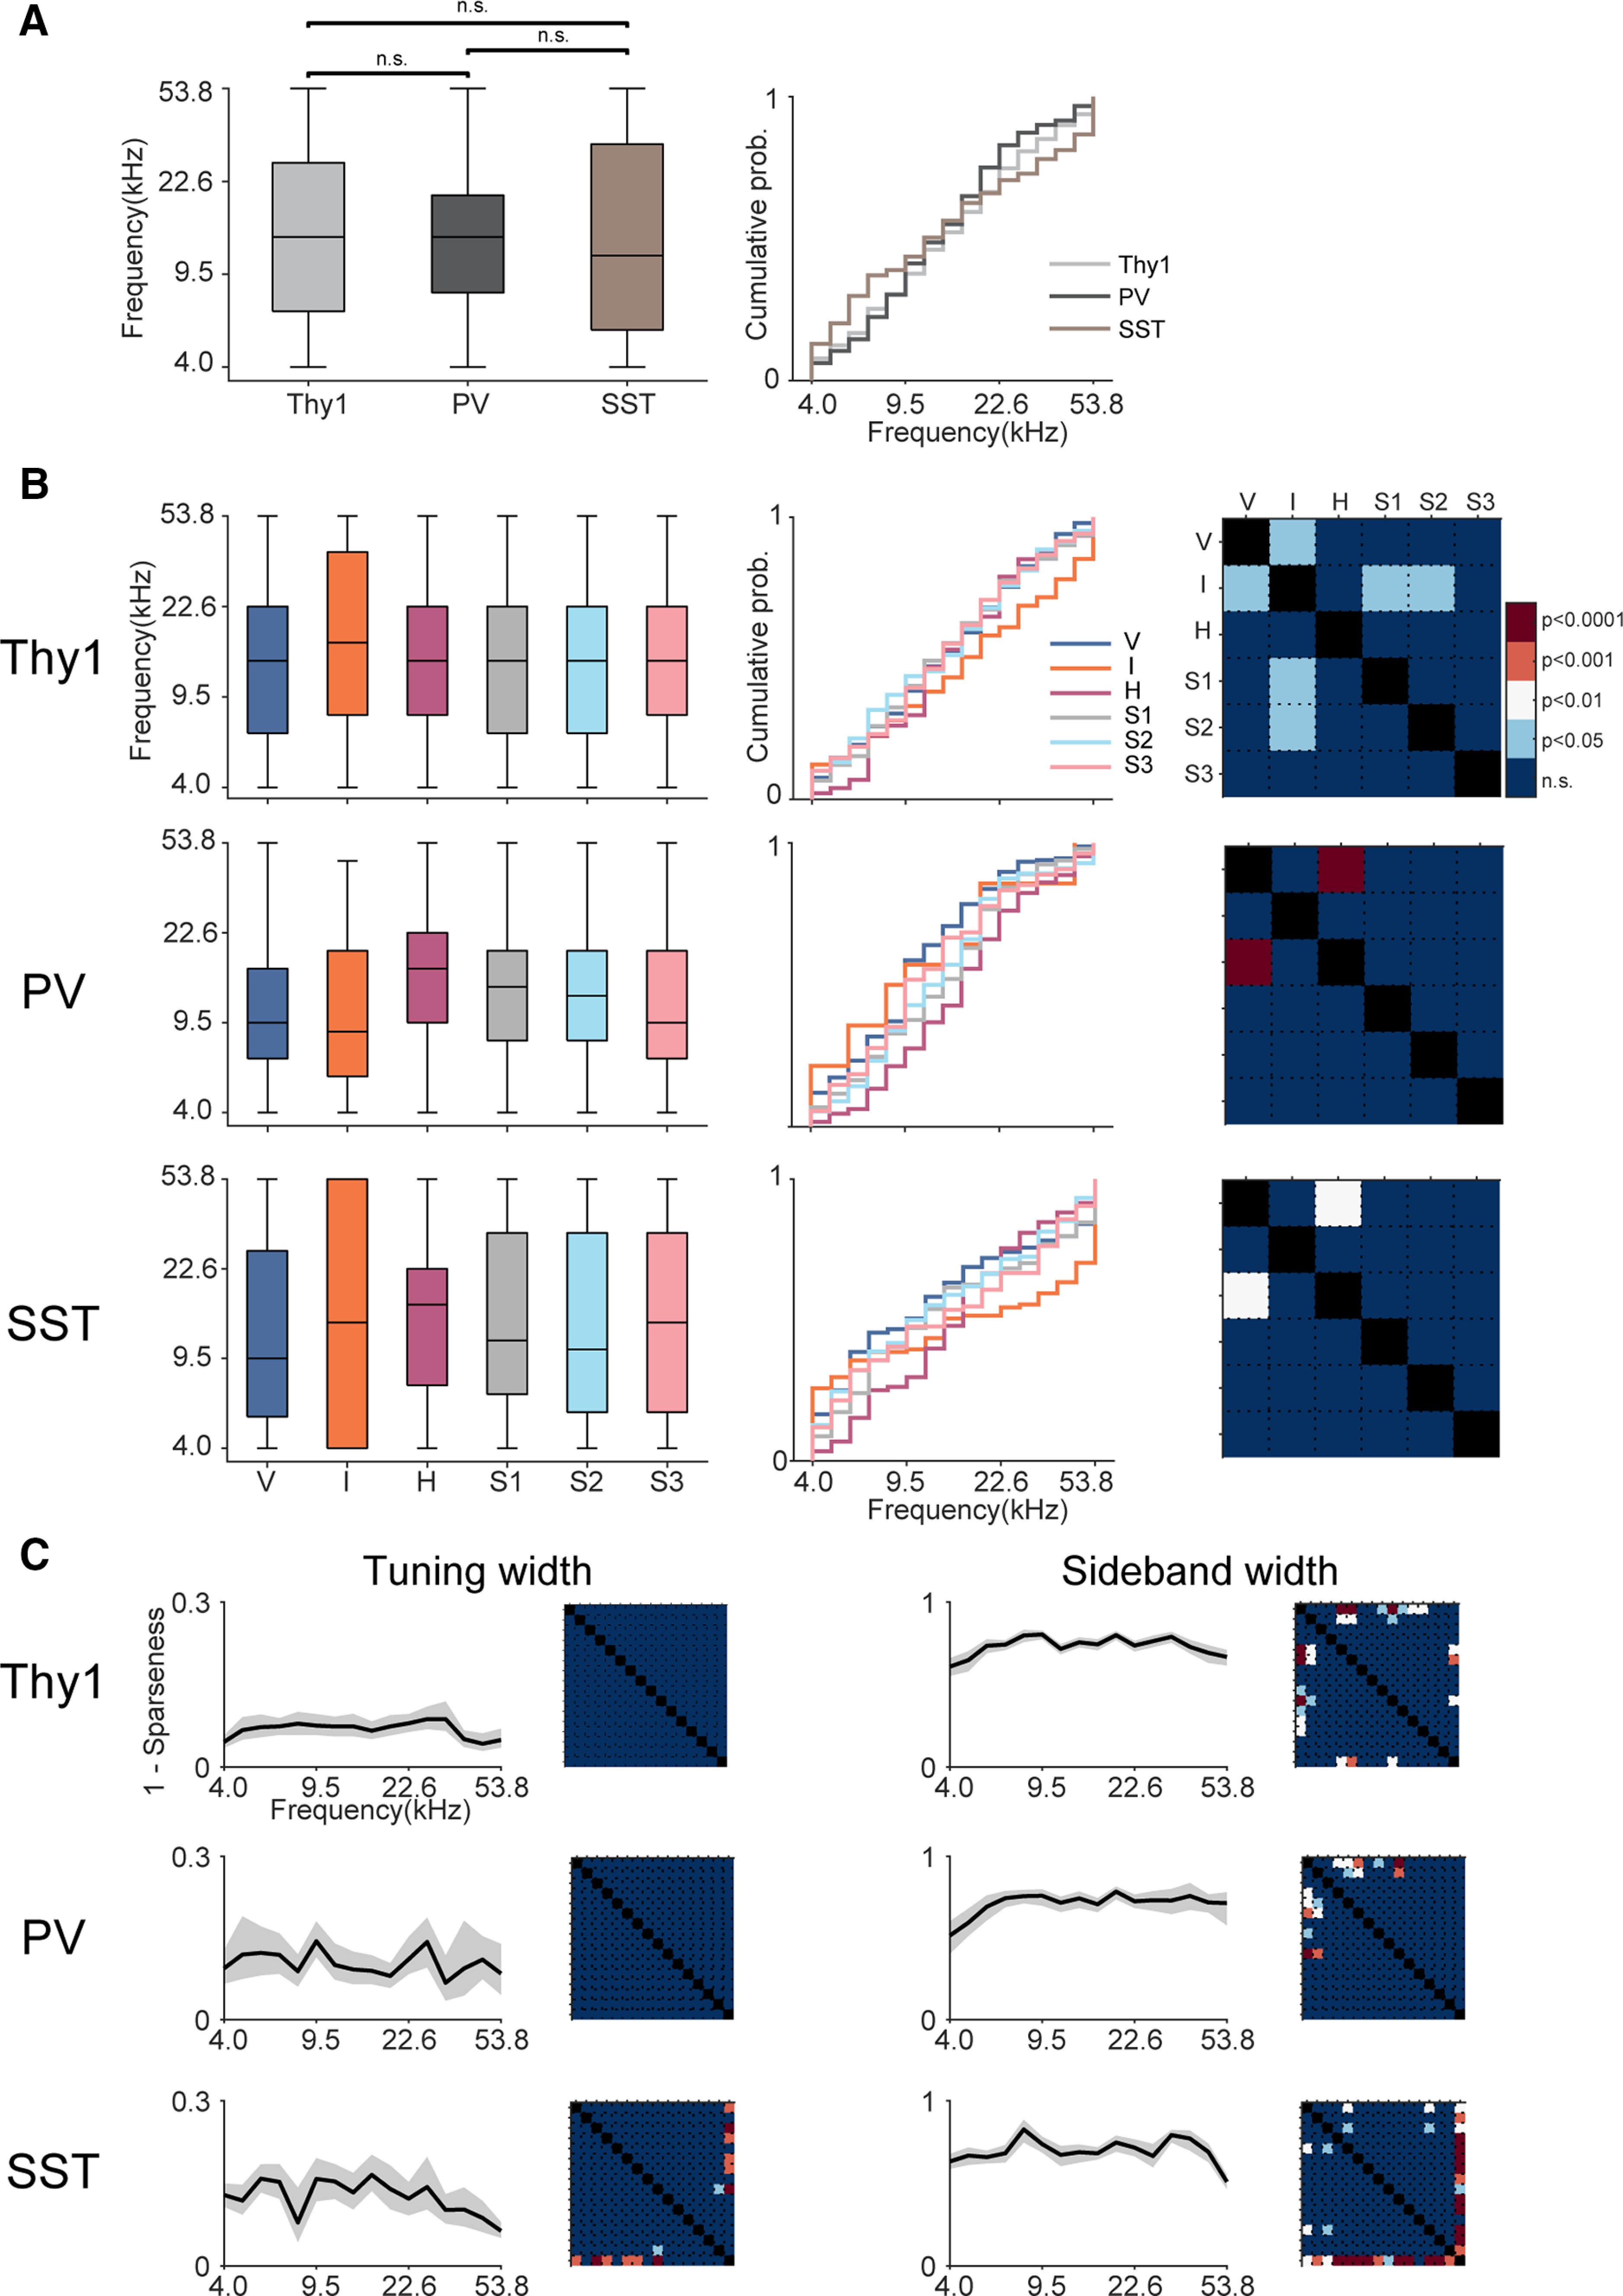
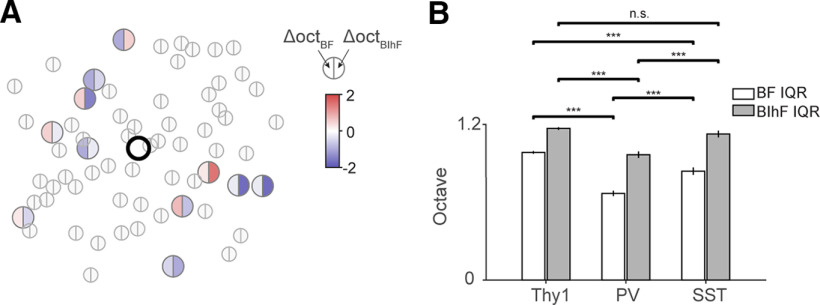
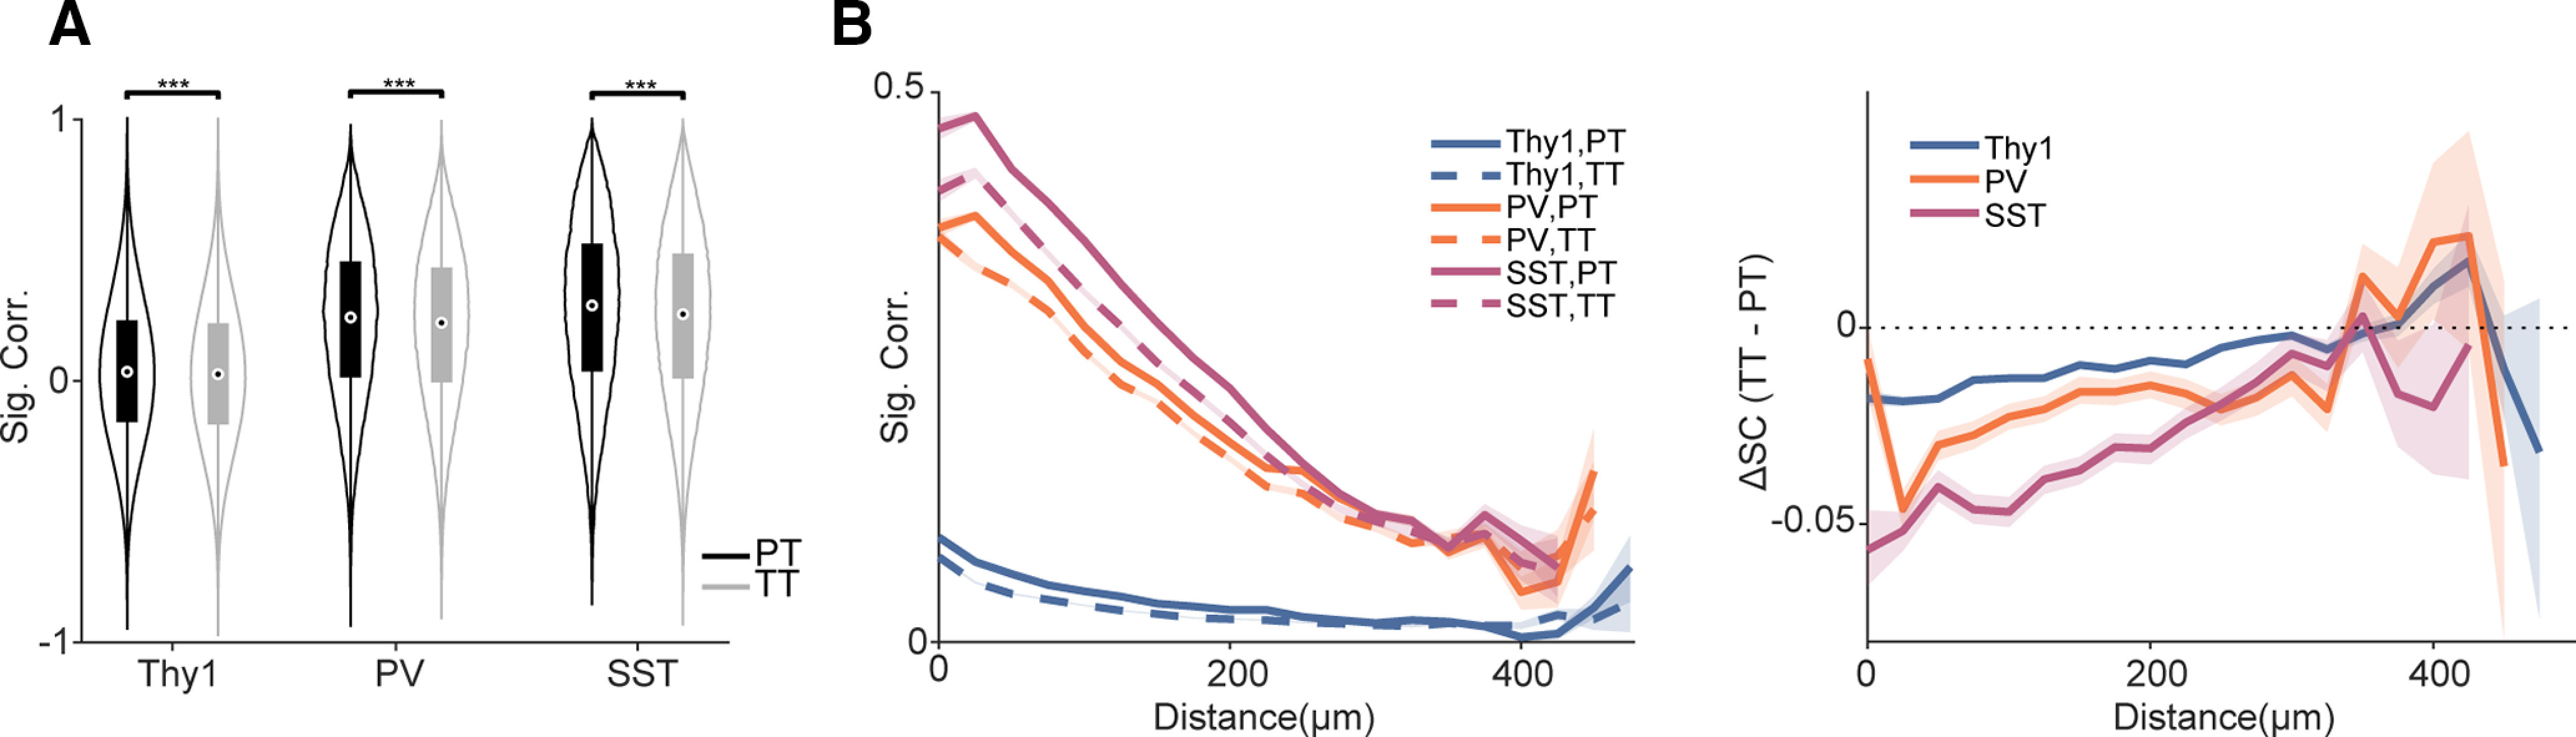
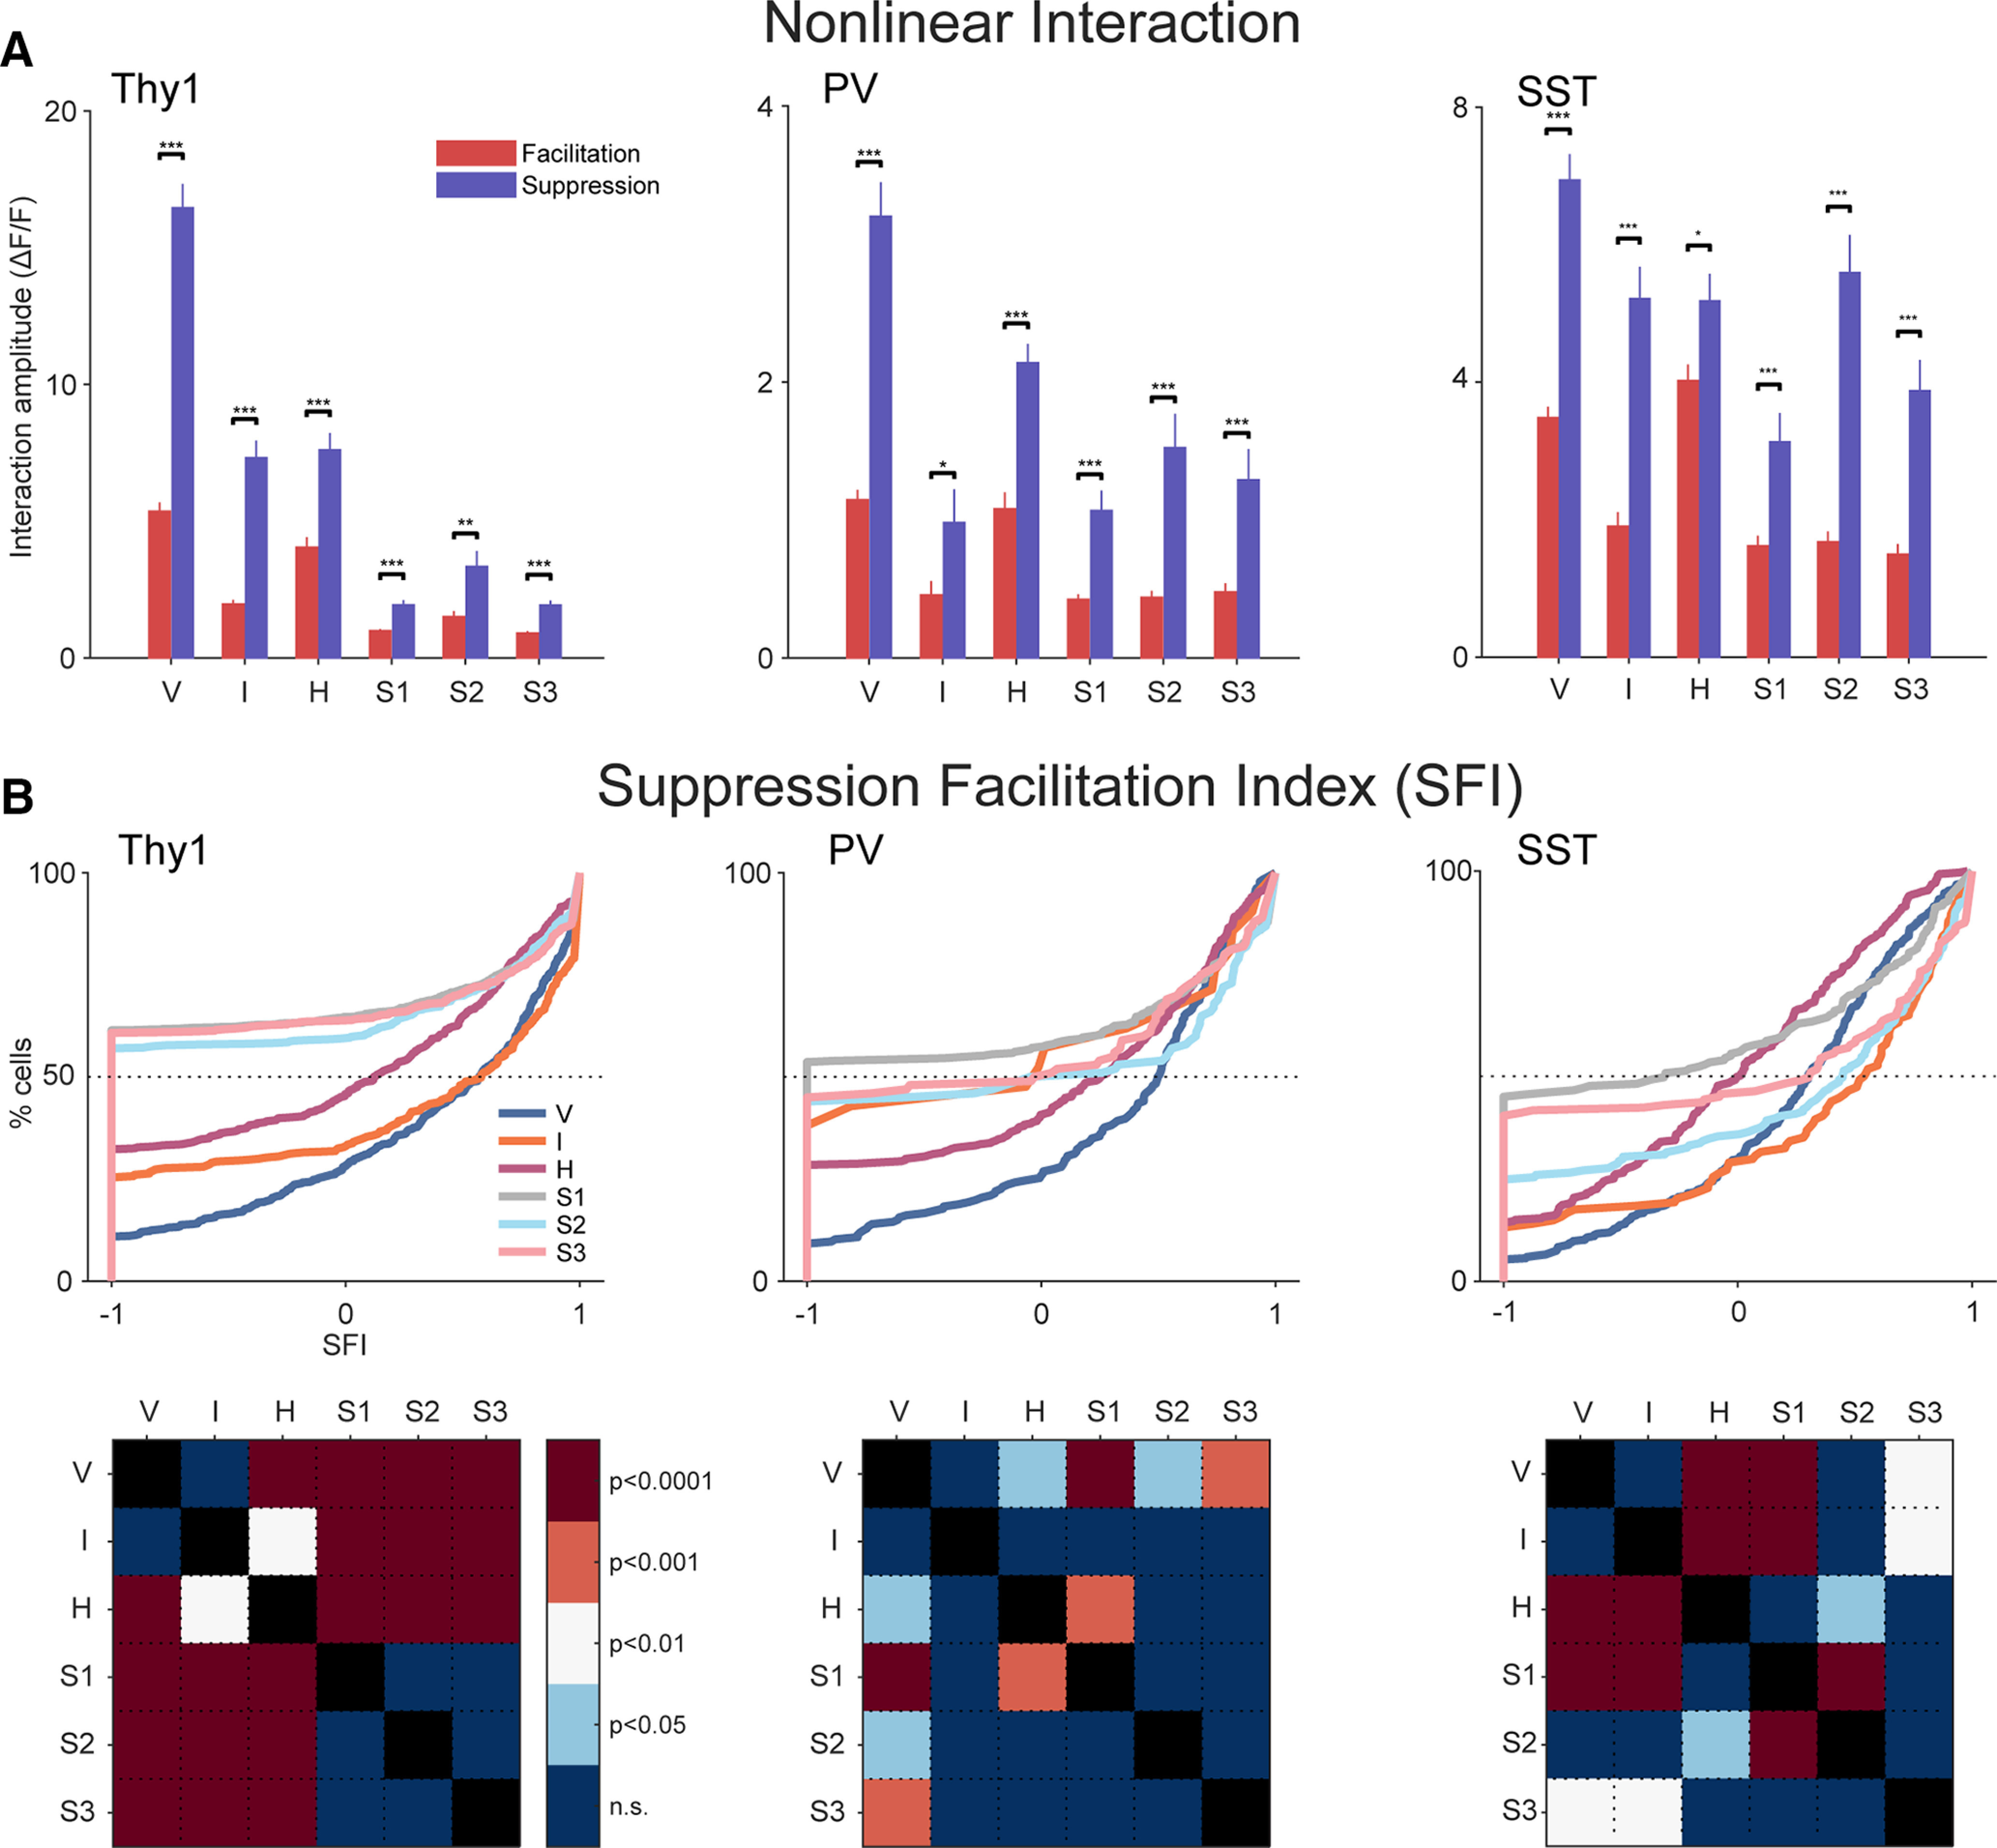
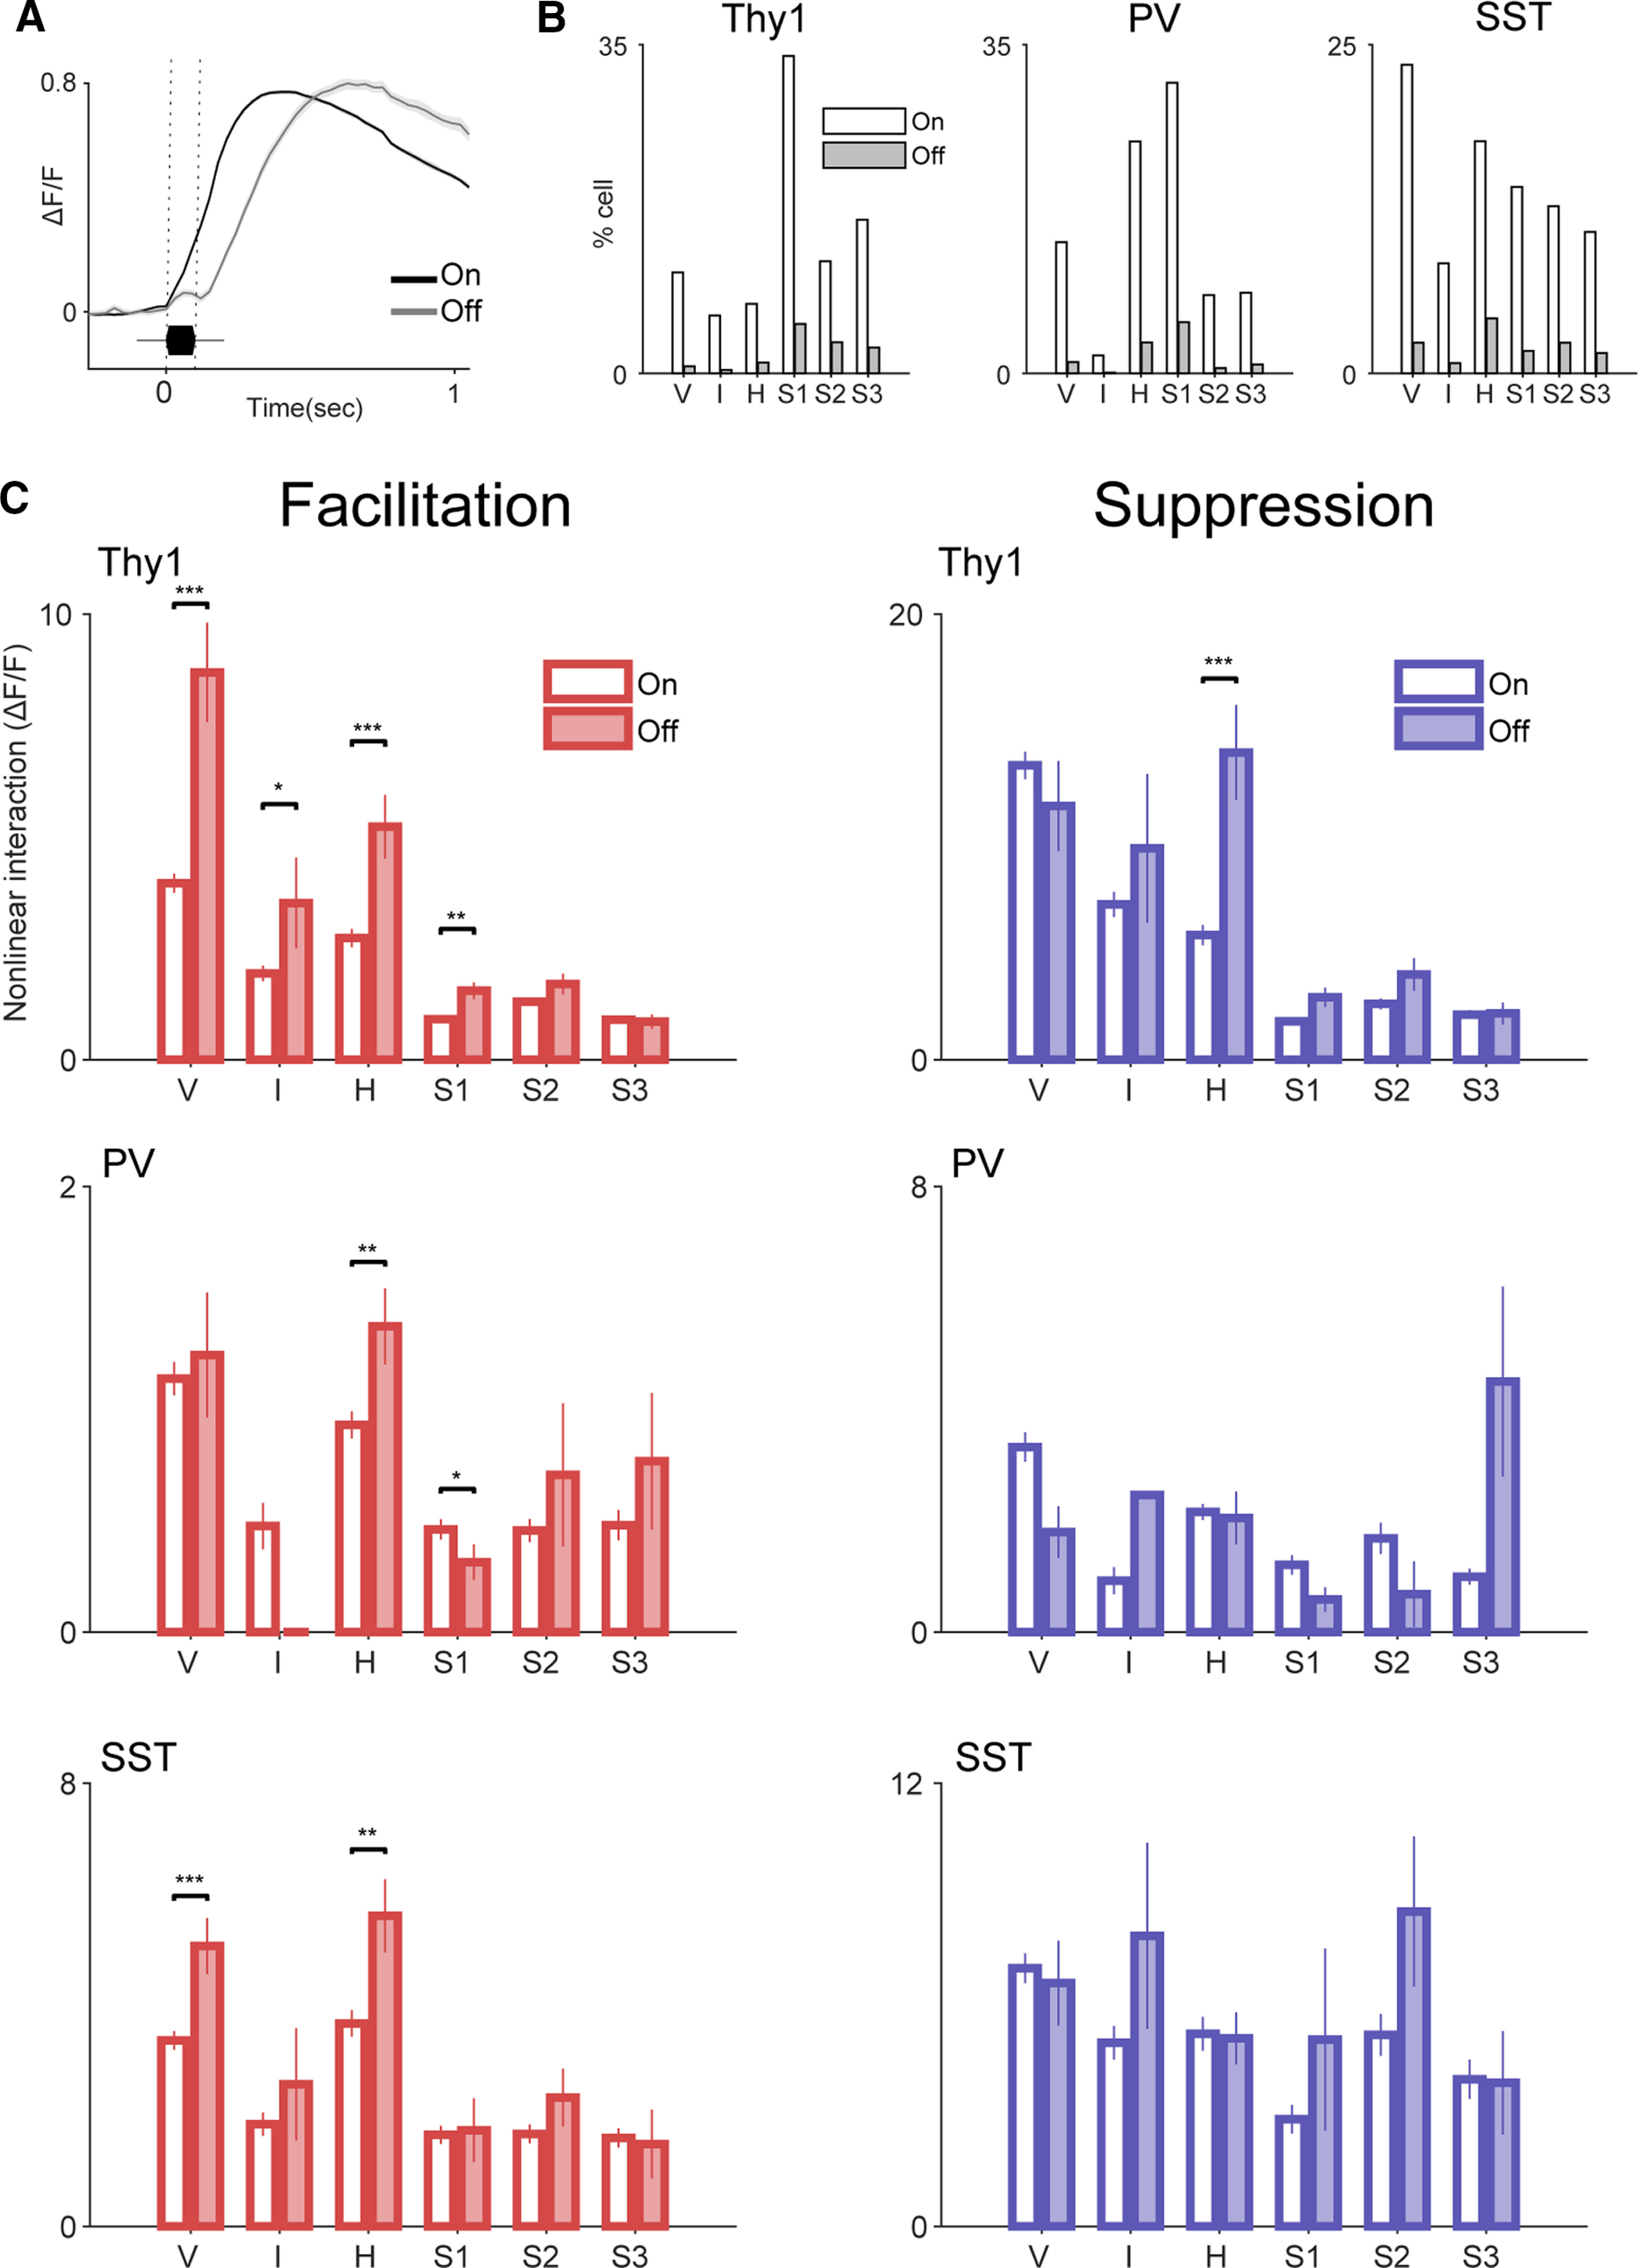
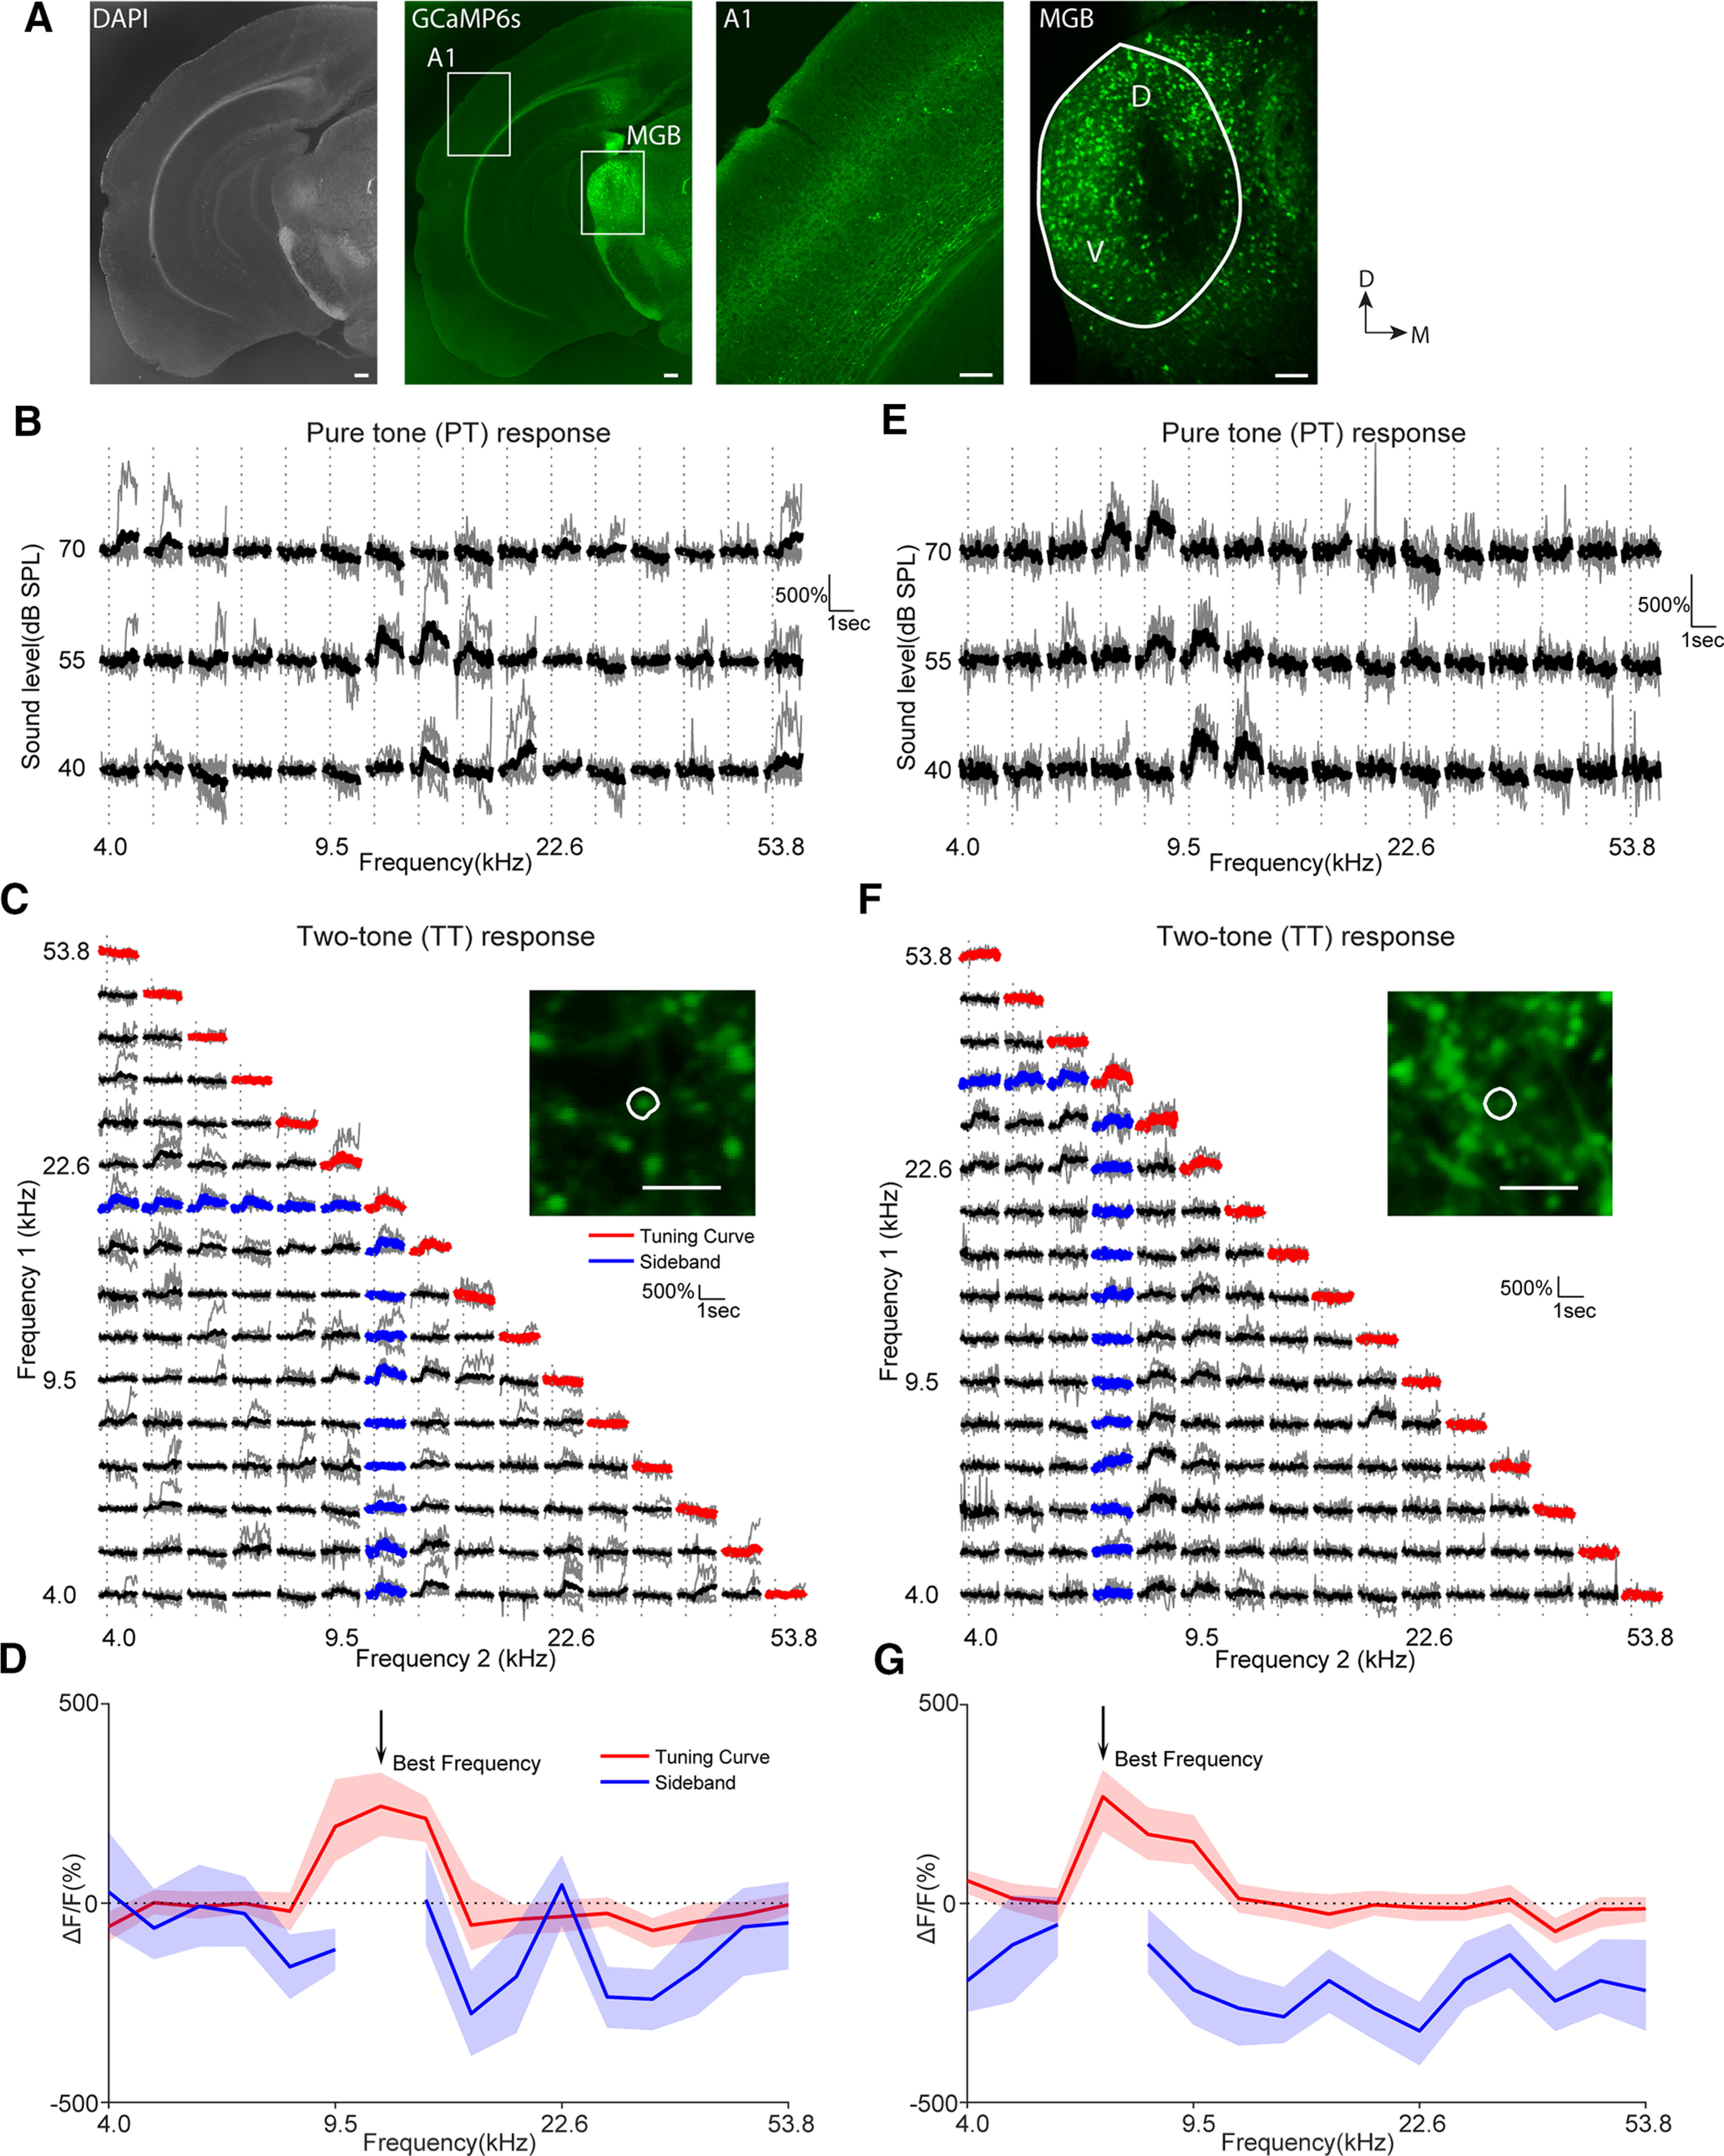
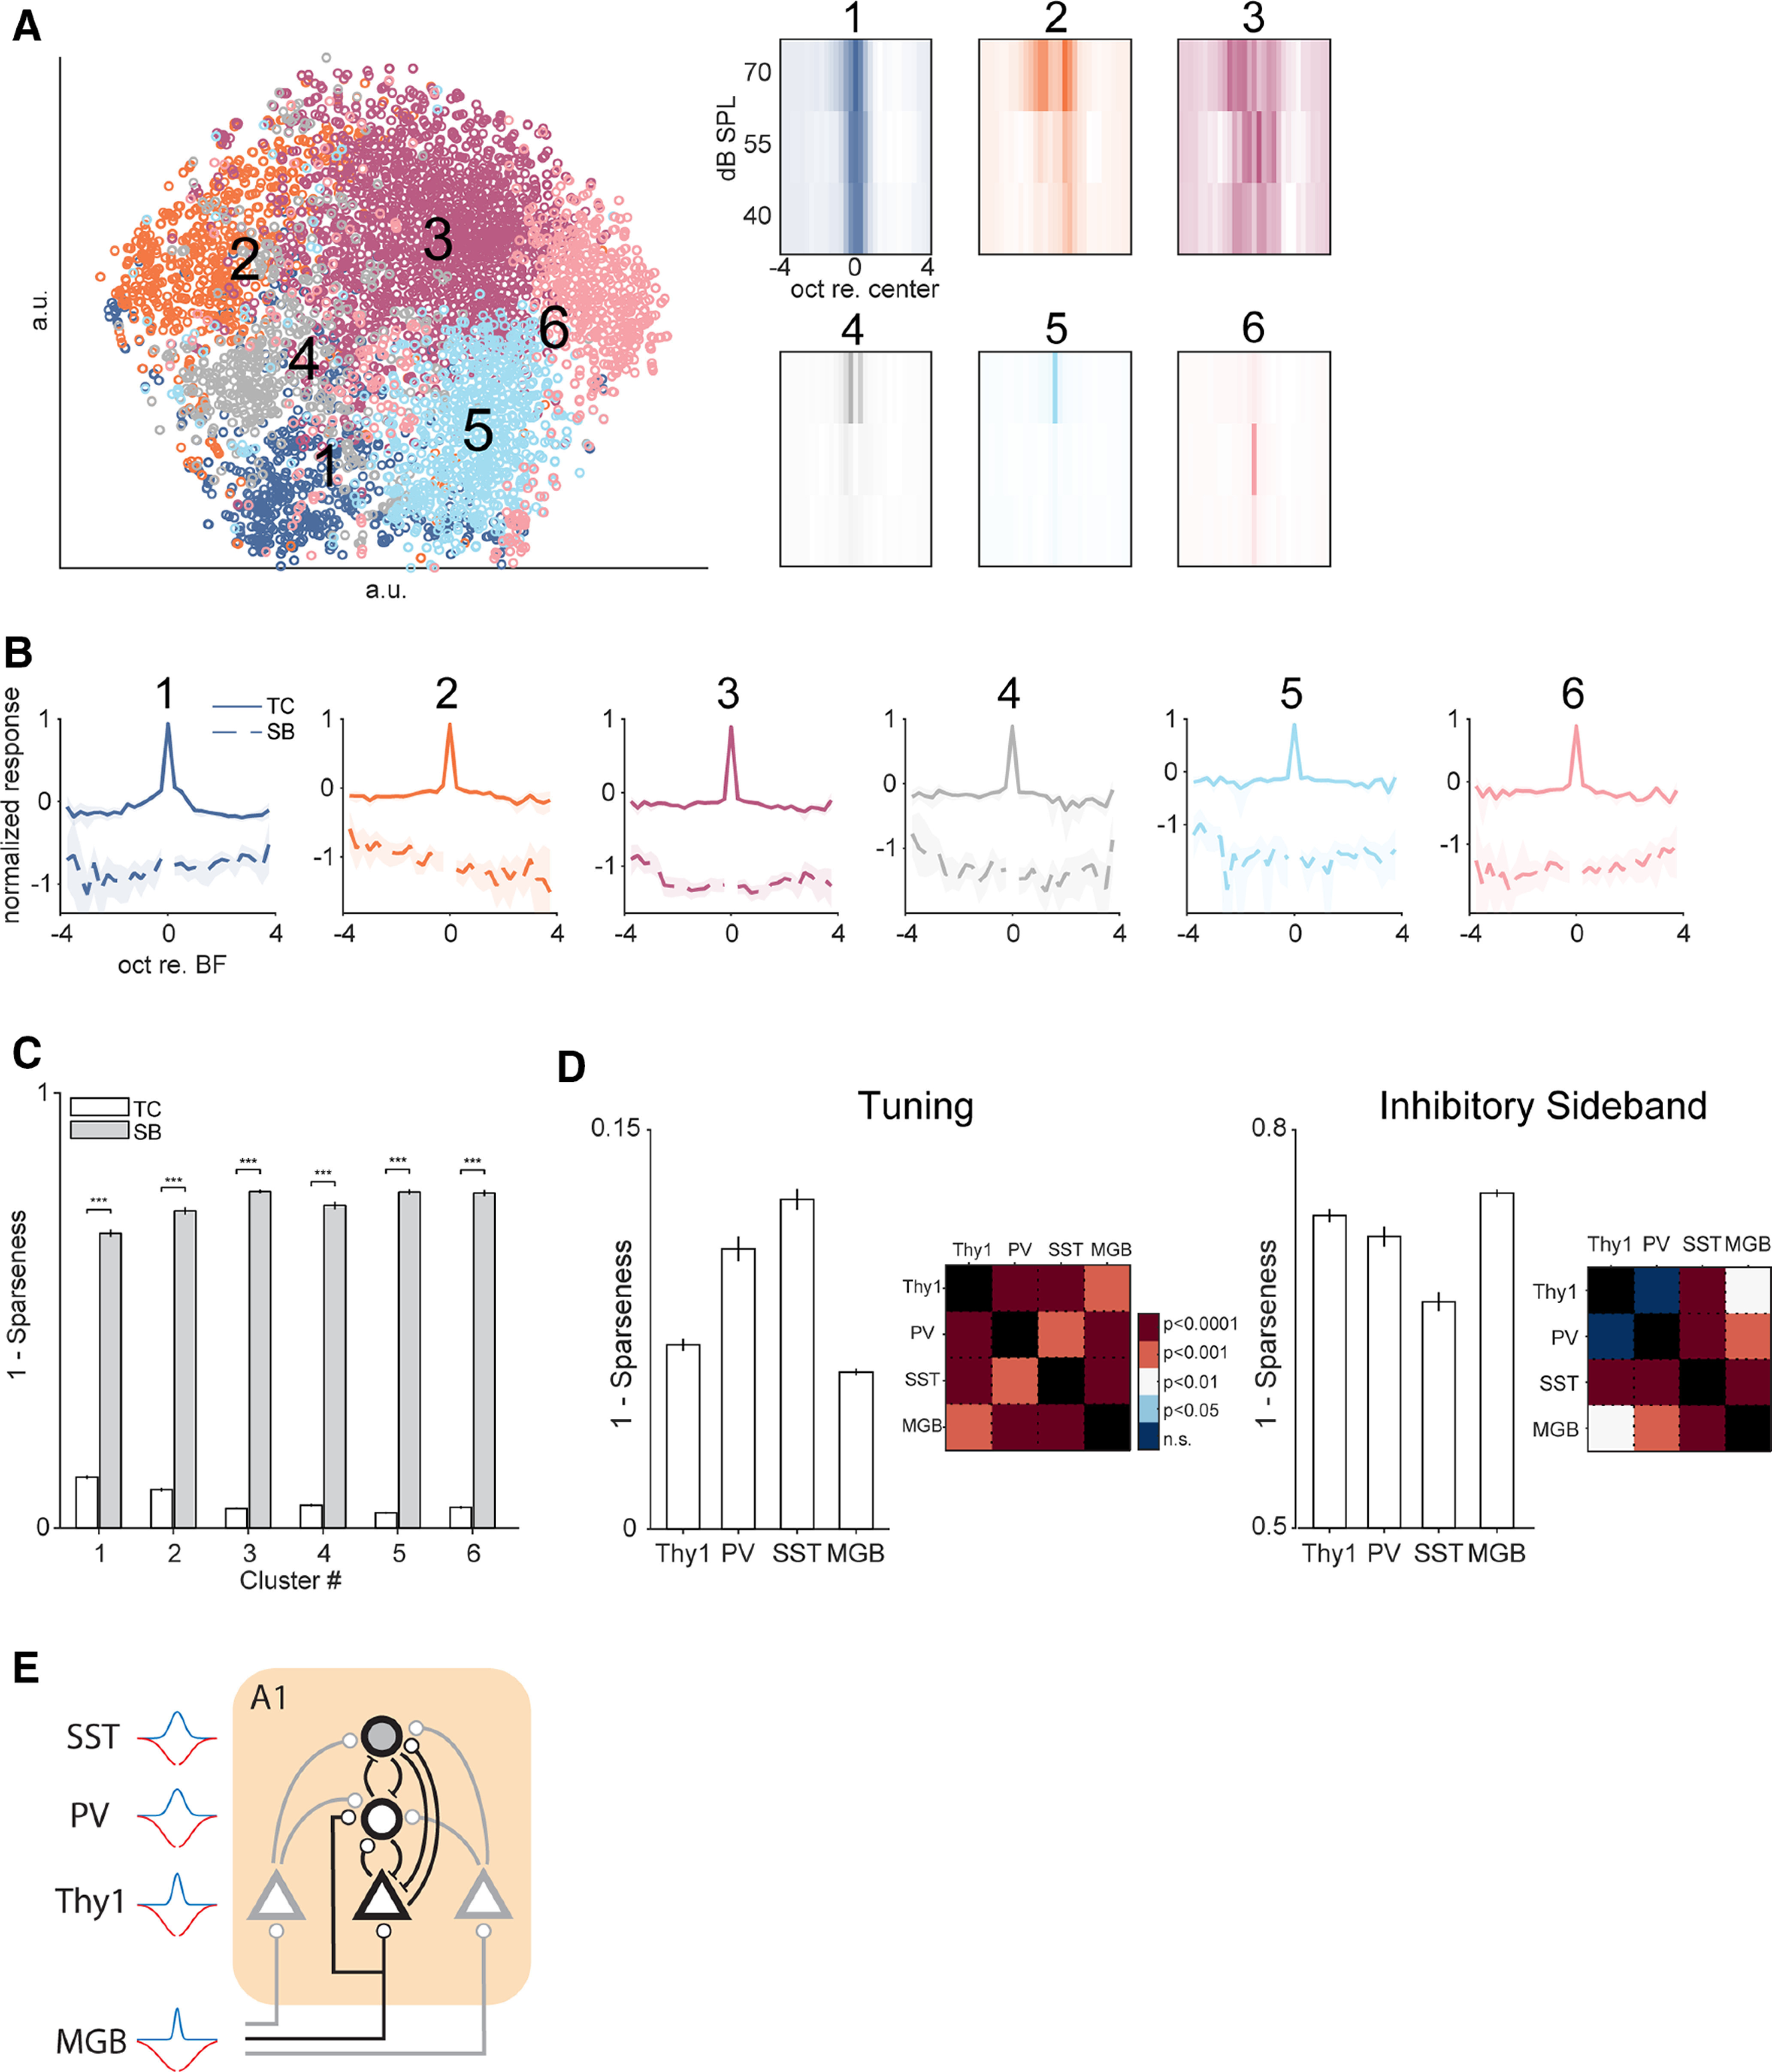
Receptive fields of primary auditory cortex (A1) neurons show excitatory neuronal frequency preference and diverse inhibitory sidebands. While the frequency preferences of excitatory neurons in local A1 areas can be heterogeneous, those of inhibitory neurons are more homogeneous. To date, the diversity and the origin of inhibitory sidebands in local neuronal populations and the relation between local cellular frequency preference and inhibitory sidebands are unknown. To reveal both excitatory and inhibitory subfields, we presented two-tone and pure tone stimuli while imaging excitatory neurons (Thy1) and two types of inhibitory neurons (parvalbumin and somatostatin) in L2/3 of mice A1. We classified neurons into six classes based on frequency response area (FRA) shapes and sideband inhibition depended both on FRA shapes and cell types. Sideband inhibition showed higher local heterogeneity than frequency tuning, suggesting that sideband inhibition originates from diverse sources of local and distant neurons. Two-tone interactions depended on neuron subclasses with excitatory neurons showing the most nonlinearity. Onset and offset neurons showed dissimilar spectral integration, suggesting differing circuits processing sound onset and offset. These results suggest that excitatory neurons integrate complex and nonuniform inhibitory input. Thalamocortical terminals also exhibited sideband inhibition, but with different properties from those of cortical neurons. Thus, some components of sideband inhibition are inherited from thalamocortical inputs and are further modified by converging intracortical circuits. The combined heterogeneity of frequency tuning and diverse sideband inhibition facilitates complex spectral shape encoding and allows for rapid and extensive plasticity.SIGNIFICANCE STATEMENT Sensory systems recognize and differentiate between different stimuli through selectivity for different features. Sideband inhibition serves as an important mechanism to sharpen stimulus selectivity, but its cortical mechanisms are not entirely resolved. We imaged pyramidal neurons and two common classes of interneurons suggested to mediate sideband inhibition (parvalbumin and somatostatin positive) in the auditory cortex and inferred their inhibitory sidebands. We observed a higher degree of variability in the inhibitory sideband than in the local frequency tuning, which cannot be predicted from the relative high homogeneity of responses by inhibitory interneurons. This suggests that cortical sideband inhibition is nonuniform and likely results from a complex interplay between existing functional inhibition in the feedforward input and cortical refinement.

Keywords: auditory cortex; inhibition; layer 2/3; mouse; sideband; tuning.


Conflict of interest statement

The authors declare no competing financial interests.

Figures

Figure 1.
Figure 1.
Inhibitory sideband can be inferred using TT stimuli combined with two-photon imaging of GCaMP6s across neural populations. Example responses to PT and TT of two Thy1-GCaMP6s neurons within the same field of view and their respective tuning curves and inhibitory sidebands are shown here. A, Experimental paradigm of the current study. Awake mice were passively listening to PT and TT stimuli, while different cell classes in the left A1 were imaged. The location of A1 was determined by performing wide-field imaging. Example wide-field maps are shown on the right. The contour lines of different colors indicate the region of fluorescence increase following the presentations of pure tones of corresponding frequencies. Scale bar, 300 µm. The example two-photon field of views show Thy1-GCaMP6s neurons and viral expression of GCaMP6s and mRuby in PV and SST interneurons. Scale bars, 20 µm. B, Example responses to PT of one Thy1 neuron. The gray traces represent responses in individual trials, and average responses are plotted in black. Vertical dotted lines indicate the onset of the stimulus. The asterisks indicate significant responses determined by nonoverlapping 99.9% confidence intervals of ΔF/F over prestimulus and poststimulus periods. For example, the prestimulus and poststimulus CIs were −17% to 19% and 29% to 84%, respectively, for the stimulus with the red asterisk, and thus this stimulus evoked a significant response. For the stimulus with the red cross, the prestimulus and poststimulus CIs were −19% to 18% and −22% to 11%, respectively, and thus the response was not significant. C, Example responses from the same neuron as in B to TT stimuli. Note that the traces on the diagonal were responses to PTs in the second stimulus set (see Materials and Methods), while off-diagonal traces were responses to TT combinations (inset). The traces with averages plotted in red or blue were used to construct the tuning curve and sideband, respectively in D. D, Tuning curve and inhibitory sideband of the same neuron shown in B and C. The solid lines indicate mean responses, while the shaded regions show 99.9% confidence intervals. For tuning curves, the ΔF/F reflects the percentage of fluorescence change from baseline following the different PTs. For inhibitory sidebands, ΔF/F following the BF tone was subtracted from the ΔF/F following the TT stimuli containing the BF. A significantly negative value suggests a suppression of the response because of the presence of a second tone other than BF. E–G, Same as in B–D but for another Thy1-GCaMP6s neuron with an I-shaped FRA. Note that this neuron showed both TT suppression and facilitation. In F, the arrow points to one example of TT facilitation where PTs presented alone failed to excite this neuron. G, The sideband of this neuron showed mostly suppression except for one frequency (arrow) that evoked facilitation.
Figure 2.
Figure 2.
Inhibitory sidebands can be inferred with TT stimuli in PV and SST interneurons. A, Example FRA of one PV interneuron. The gray traces show individual trials, while the black traces show the trial average. Vertical dotted lines indicate the onset of the stimulus. B, Example responses to TT from the same PV neuron as shown in A. The diagonal responses were to PTs while the off-diagonal responses were to TTs that were the combinations of all PT pairs. C, The tuning curve and inhibitory sideband of the same PV neuron as shown in A and B. The solid lines indicate mean responses, while the shaded regions show 99.9% confidence intervals. D–F, Same as in A–C but for an SST interneuron.
Figure 3.
Figure 3.
The FRAs of individual neurons show a large variability. Six different FRAs from Thy1 neurons were plotted to show the variability of FRA shapes across neural populations. In each panel, the image of the neuron was shown in the left top corner with the red line indicating its contour. The white scale bar in the image shows 10 µm. For FRA traces, all horizontal calibration bars indicate 1 s, while vertical calibration bars indicate 300% ΔF/F. All gray traces show individual trials, while the black traces show the trial average. These examples differed in their sparseness of responses as well their selectivity for frequency and sound level. For example, in the second row these neurons responded only to one frequency and sound level combination and thus showed the highest level of sparseness in their FRAs.
Figure 4.
Figure 4.
Classification of FRA shapes reveals distinct receptive field types. A, Left, t-SNE plot of PCA coefficients of aligned FRAs with data points color coded with their corresponding K-means clusters. Right, Top row, Average aligned FRAs of the six clusters as determined by K-means algorithm. Right, Bottom row, Average aligned FRAs of manual classification based on K-means result. Clusters 1–6 approximately correspond to the color-matched manual classification result in the bottom row. B, The variability within the K-means cluster and that within the manually classified cluster were compared. We quantified the variability at each aligned frequency by computing the interquartile range of response amplitude at the aligned frequency across neurons. The color-matched plots share the same color axis. The manual classification results showed higher variability within their perspective shape (e.g., cluster 1 vs V and cluster 2 vs I). C, To quantify the misclassification, for each final manual label, the proportion of the original K-means cluster is plotted. For example, the first column shows the proportion of the original clusters that constituted the final V-shaped cells (i.e., 19.6% from cluster 1, 44.8% from cluster 2, 19.8% from cluster 3, 2.1% from cluster 4, 7.7% from cluster 5, and 6.1% from cluster 6). Thus, each column has the summation of 1. The most misclassification happened among the putative V- and I-shaped neurons (clusters 1 and 2), while H- and S-type neurons were more accurately assigned. D, The FRA clusters differed in their frequency and sound level response profile. Each line represents the normalized cumulative summation of responses over either frequency (left) or sound level (right). For each cell, the summation was normalized such that the maximum was 1. The shaded regions show 95% confidence intervals. E, The proportion of FRA types within each cell type.
Figure 5.
Figure 5.
All cell types and FRA types show broader inhibitory sidebands than tuning curves. A, The average tuning curve (solid lines) and inhibitory sideband (dash lines) were plotted as a function of both cell types and FRA types. TC, Tuning curve; SB, sideband. For each cell, the amplitude of the tuning curve and that of the inhibitory sideband were normalized to the amplitude of the BF. Then the normalized tuning curve and inhibitory sideband were aligned at BF to construct both the mean and the confidence interval using bootstrap procedures. B, The widths of the tuning curves and the inhibitory sidebands as measured by 1 – sparseness were plotted as a function of cell types and FRA types. Inhibitory sidebands were considerably larger in width than those of the tuning curves. ***p < 0.001. C, Across all cells, the width of the tuning curve was negatively correlated with the width of the inhibitory sideband. The bar graph shows the inhibitory sideband width binned according to the width of the tuning curve. The dot–dash line shows the linear fit (y = 0.73–0.23x, p = 5.1 × 10⁻¹³).
Figure 6.
Figure 6.
BF of tuning curves were not different across cell types. A, Boxplot and cumulative distribution function of tuning BF as a function of cell types. Median BF across different cell types were similar. B, Boxplot and cumulative distribution function (left and mid-column) of tuning BF as a function of both cell types and FRA types. The rightmost column shows the pairwise comparison significance of tuning BF as a function of FRA types. BF difference was only found in between specific FRA subtypes within each cell type. C, The widths of tuning curve and inhibitory sideband were largely similar across tuning BF in all cell types, except for at the low- or high-frequency end, which is likely because of the lack of data beyond the frequency range chosen for this study. n.s., not significant.
Figure 7.
Figure 7.
Inhibitory sidebands show more local heterogeneity than tuning curves. A, Cartoon for IQR calculation. The cell in question is represented as the black circle at the center. Cells within a 100 µm radius are plotted. The left and right half of the circle color code the difference of BF and BIhF in octave, respectively, with the center cell. Gray circles represent nonresponding cells. The IQRs are then calculated taking the interquartile range of BF and BIhF Δoctave (oct). B, The heterogeneity of the selectivity of the local tuning and inhibitory sideband was quantified by calculating the IQR of BF or BIhF, respectively. The IQR of BIhF was larger than that of BF across all cell types. ***p < 0.001, n.s., not significant.
Figure 8.
Figure 8.
The presence of the second tone decorrelates neuronal responses. A, Violin plot showing the distribution of SCs as a function of both cell types and stimuli (PT vs TT). SCs of TT responses between pairs of neurons were significantly reduced compared with SCs of PT across all cell types. ***p < 0.001. B, Left, SCs as a function of distance, cell types, and stimulus (PT vs TT). SCs of TTs were smaller in value than SCs of PTs across distance. Solid lines correspond to SCs of PTs, while dashed lines correspond to SCs of TT. The shaded regions show the 95% confidence interval. Right, The difference between SCs of TT and PTs as a function of distance and cell types. Shaded regions show 95% confidence intervals.
Figure 9.
Figure 9.
Nonlinear frequency interactions show prominent suppression among all cell types while the relative facilitation/suppression strength depends on specific cell/FRA type combination. A, The amplitude of facilitative and suppressive nonlinear frequency interactions as a function of FRA types and cell types. In all cell types, the average suppressive interactions were larger in amplitude than facilitative interactions. *p < 0.05. **p < 0.01. ***p < 0.001. B, Top row, SFI (see Materials and Methods) as a function of FRA types and cell types. SFI measures the bias of suppressive or facilitative interactions within individual cells. 1 indicates purely suppressive interactions, while −1 indicates purely facilitative interactions. Bottom row, matrices showing p values of pairwise comparisons among different FRA types within each cell types.
Figure 10.
Figure 10.
Nonlinear frequency interactions as a function of response timing. A, The average traces of onset and offset responses pooled from all responding neurons. Dotted vertical lines mark the onset and offset of the stimulus, respectively. B, Proportion of onset and offset neurons as a function of cell type and FRA types. C, Nonlinear frequency interactions as a function of response timing, FRA types, and cell types. A subset of offset neurons showed a higher degree of facilitative interactions than their onset counterparts. *p < 0.05; **p < 0.01; ***p < 0.001.
Figure 11.
Figure 11.
MGB terminals show inhibitory sideband structures. A, Brain slice showing GCaMP6s expression in MGB and MGB terminals in A1. Left two images show DAPI staining and GCaMP6s epifluorescence at low magnification (2×). Scale bars, 200 µm. Right two images show high magnification (10×) views of outlined areas. Scale bars, 100 µm. Axon terminal GCaMP6s expressions can be seen in L1 and L4. B–G, Two examples of the response of MGB boutons to PT and TT are shown. B, FRA of one example bouton. C, Example responses to TT stimuli. Gray traces represent individual trials in both B and C. The blue and red average traces indicate the responses used to construct the tuning curve and the inhibitory sideband in D. The inset shows the image of the bouton, with the white contour line outlining the ROI mask. Scale bar, 5 µm. D, The tuning curve and inhibitory sideband of the bouton. E–G, Same as in A–C but for another bouton.
Figure 12.
Figure 12.
MGB terminals show narrow tuning and prominent sideband inhibition. A, t-SNE plot showing the distribution of center-aligned FRAs of MGB terminal FRAs. The colors indicate the clusters from the K-means algorithm. Right, Average center-aligned FRAs of the K-means clusters. B, Average tuning curves and inhibitory sidebands of clustered MGB terminals. All clusters showed narrow tuning and broad inhibitory sidebands. C, Bar plot showing the width of tuning and inhibitory sideband as a function of clusters. In all clusters, the inhibitory sidebands were much broader than tuning curves. ***p < 0.001. D, Bar plot comparing tuning width and sideband width among different cortical cell types and MGB terminals. MGB terminals show narrower tuning than cortical neurons while having broader inhibitory sidebands. E, Cartoon showing a model for cortical tuning and sideband inhibition. The cortical neurons partially inherit inhibitory sideband structures from the thalamocortical MGB input, and the width of tuning and sideband inhibition reflect the differential convergence of input within intracortical circuits (i.e., from neurons tuned to other frequencies; gray triangles and connections). Triangles represent Thy1 neurons, while white and gray circles represent PV and SST neurons, respectively.

Similar articles

Cited by

References

    1. Bandyopadhyay S, Shamma SA, Kanold PO (2010) Dichotomy of functional organization in the mouse auditory cortex. Nat Neurosci 13:361–368. 10.1038/nn.2490 - DOI - PMC - PubMed
    1. Bartlett EL, Sadagopan S, Wang X (2011) Fine frequency tuning in monkey auditory cortex and thalamus. J Neurophysiol 106:849–859. 10.1152/jn.00559.2010 - DOI - PMC - PubMed
    1. Bowen Z, Winkowski DE, Kanold PO (2020) Functional organization of mouse primary auditory cortex in adult C57BL/6 and F1 (CBAxC57) mice. Sci Rep 10:10905. 10.1038/s41598-020-67819-4 - DOI - PMC - PubMed
    1. Bridi MS, Shin SY, Huang S, Kirkwood A (2020) Dynamic recovery from depression enables rate encoding in inhibitory synapses. iScience 23:100940. 10.1016/j.isci.2020.100940 - DOI - PMC - PubMed
    1. Brimijoin WO, O'Neill WE (2005) On the prediction of sweep rate and directional selectivity for FM sounds from two-tone interactions in the inferior colliculus. Hear Res 210:63–79. 10.1016/j.heares.2005.07.005 - DOI - PMC - PubMed

Publication types

LinkOut - more resources