. 2021 Apr 14;41(15):3320-3330.
doi: 10.1523/JNEUROSCI.2817-20.2021. Epub 2021 Feb 16.

Rod Photoreceptors Avoid Saturation in Bright Light by the Movement of the G Protein Transducin

Affiliations

Rod Photoreceptors Avoid Saturation in Bright Light by the Movement of the G Protein Transducin

Rikard Frederiksen et al. J Neurosci. .

Abstract

Rod photoreceptors can be saturated by exposure to bright background light, so that no flash superimposed on the background can elicit a detectable response. This phenomenon, called increment saturation, was first demonstrated psychophysically by Aguilar and Stiles and has since been shown in many studies to occur in single rods. Recent experiments indicate, however, that rods may be able to avoid saturation under some conditions of illumination. We now show in ex vivo electroretinogram and single-cell recordings that in continuous and prolonged exposure even to very bright light, the rods of mice from both sexes recover as much as 15% of their dark current and that responses can persist for hours. In parallel to recovery of outer segment current is an ∼10-fold increase in the sensitivity of rod photoresponses. This recovery is decreased in transgenic mice with reduced light-dependent translocation of the G protein transducin. The reduction in outer-segment transducin together with a novel mechanism of visual-pigment regeneration within the rod itself enable rods to remain responsive over the whole of the physiological range of vision. In this way, rods are able to avoid an extended period of transduction channel closure, which is known to cause photoreceptor degeneration.SIGNIFICANCE STATEMENT Rods are initially saturated in bright light so that no flash superimposed on the background can elicit a detectable response. Frederiksen and colleagues show in whole retina and single-cell recordings that, if the background light is prolonged, rods slowly recover and can continue to produce significant responses over the entire physiological range of vision. Response recovery occurs by translocation of the G protein transducin from the rod outer to the inner segment, together with a novel mechanism of visual-pigment regeneration within the rod itself. Avoidance of saturation in bright light may be one of the principal mechanisms the retina uses to keep rod outer-segment channels from ever closing for too long a time, which is known to produce photoreceptor degeneration.

Keywords: G protein; adaptation; retina; rod photoreceptor; saturation; visual pigment.


Figures

Figure 1.
Figure 1.
Representative trans-retinal (ERG) recordings of isolated rod responses to flashes of 505 nm light in DA Gnat2−/− mouse retinae, immediately (0 min), 30 min, and 90 min after the onset of a 560 nm background light. Background light intensity is expressed in ϕ µm−2 s−1, which are photons effective at the λmax of mouse rhodopsin at 503 nm (see Fig. 5). The 505 nm flashes (in ϕ µm−2) were as follows: 0.80, 4.8, 19, 72, 2.5 × 10², 7.7 × 10², and 2.3 × 10³ (DA before 1.3 × 10⁴ and 3.6 × 10⁴ ϕ µm−2 s−1 background); 1.2, 6.5, 53, 2.5 × 10², and 7.1 × 10² (DA before 1.3 × 10⁵ and 3.6 × 10⁵ ϕ µm−2 s−1 background); 1.6 × 10², 9.6 × 10², 3.8 × 10³, 1.4 × 10⁴, 4.9 × 10⁴, 1.5 × 10⁵, and 4.6 × 10⁵ (1.3 × 10⁴ ϕ µm−2 s−1 background); 1.6 × 10³, 9.6 × 10³, 3.8 × 10⁴, 1.4 × 10⁵, 4.9 × 10⁵, 1.5 × 10⁶, 4.5 × 10⁶ (3.6 × 10⁴ ϕ µm−2 s−1 background); 4.7 × 10³, 2.1 × 10⁴, 7.5 × 10⁴, 3.0 × 10⁵, 1.2 × 10⁶, 3.4 × 10⁶ (1.3 × 10⁵ and 3.6 × 10⁵ ϕ µm−2 s−1 background).
Figure 2.
Figure 2.
Single-cell suction electrode recordings from WT mouse rods. A, Average responses to 505 nm flashes recorded from 16 DA mouse rods. Flashes were 1.6, 4.6, 21, 51, 190, 540, 1300, 2200, and 5100 ϕ µm−2. B, Responses in the presence of 565 nm background of 1.0 × 10⁶ ϕ µm−2 s−1. Traces are average responses from 30 flashes of 6.1 × 10⁶ ϕ µm−2 recorded from 6 rods. C, Mean flash responses from 11 rods first exposed for 60 min to 565 nm background light of 1.0 × 10⁶ ϕ µm−2 s−1, then allowed to reach steady state after another 60 min in darkness. Flashes were 9.4 × 10⁴, 1.9 × 10⁵, 4.1 × 10⁵, 6.7 × 10⁵, and 1.36 × 10⁶ ϕ µm−2. D, Response-intensity functions from cells of C. Data were fitted with saturating exponential relations of R = Rmax[1 – e(–kϕ)], where Rmax is the maximum response amplitude in pA, k is a constant in ϕ−1 µm2, and ϕ is the number of effective photons in the flash per square micron (Lamb et al., 1981). The best fitting parameters for DA rods were Rmax = 12.4 pA and k = 5.1 × 10⁻³ ϕ−1 µm2; and for rods after illumination, Rmax = 0.93 pA and k; = 7.1 × 10⁻⁶ ϕ−1 µm2.
Figure 3.
Figure 3.
Response amplitude and sensitivity of rods in background light. A, Mean response-intensity relations recorded from Gnat2−/− mouse retinae, DA and every 15 min after onset of a background of 1.3 × 10⁵ ϕ µm−2 s−1 (n = 6 for each condition). The data were fitted with Equation 3, with the parameters as follows: DA, Rmax = 746 µV and ϕ1/2 = 26.8 ϕ µm−2; 0 min, Rmax = 18.4 µV and ϕ1/2 = 9.85 × 10⁵ ϕ µm−2; 15 min, Rmax = 26.5 µV and ϕ1/2 = 2.02 × 10⁵ ϕ µm−2; 30 min, Rmax = 33.1 µV and ϕ1/2 = 4.45 × 10⁴ ϕ µm−2; 45 min, Rmax = 43.0 µV and ϕ1/2 = 4.93 × 10⁴ ϕ µm−2; 60 min, Rmax = 53.4 µV and ϕ1/2 = 8.71 × 10⁴ ϕ µm−2; 75 min, Rmax = 74.7 µV and ϕ1/2 = 1.37 × 10⁵ ϕ µm−2; 90 min, Rmax = 72.5 µV and ϕ1/2 = 1.55 × 10⁵ ϕ µm−2. B, Data in background light from A, with the ordinate rescaled to 10% that in A. C, Maximal response amplitude (Rmax) to a bright flash plotted as a function of time in the presence of background light. Flashes were 4.6 × 10⁵ ϕ µm−2 for the 1.3 × 10⁴ ϕ µm−2 s−1 background, 4.5 × 10⁶ ϕ µm−2 for the 3.6 × 10⁴ ϕ µm−2 s−1 background, and 3.4 × 10⁶ ϕ µm−2 for the 1.3 × 10⁵ and 3.6 × 10⁵ ϕ µm−2 s−1 backgrounds. D, Sensitivity normalized to DA sensitivity plotted and as a function of time in background light. C, D, n = 6 for each condition.
Figure 4.
Figure 4.
Recordings as in Figure 1 from Gnat2−/− and Gnat1−/−Gnat2−/−A3C+ mice. A, Representative responses from a Gnat1−/−Gnat2−/−A3C+ retina DA and at indicated times after onset of a 560 nm background light of 3.1 × 10⁵ ϕ µm−2 s−1. B, Maximum response amplitude (Rmax) to a flash stimulus recorded every 2 min after the onset of background light of 3.1 × 10⁵ ϕ µm−2 s−1 in Gnat1−/−Gnat2−/−A3C+ (n = 4, black) and Gnat2−/− (n = 9, red) retinae. Flashes were 6.1 × 10⁷ ϕ µm−2. C, Mean flash sensitivities of Gnat1−/−Gnat2−/−A3C+ (n = 7) and Gnat2−/− (n = 9) retinae plotted as a function of time in the presence of a background light of 3.1 × 10⁵ ϕ µm−2 s−1.
Figure 5.
Figure 5.
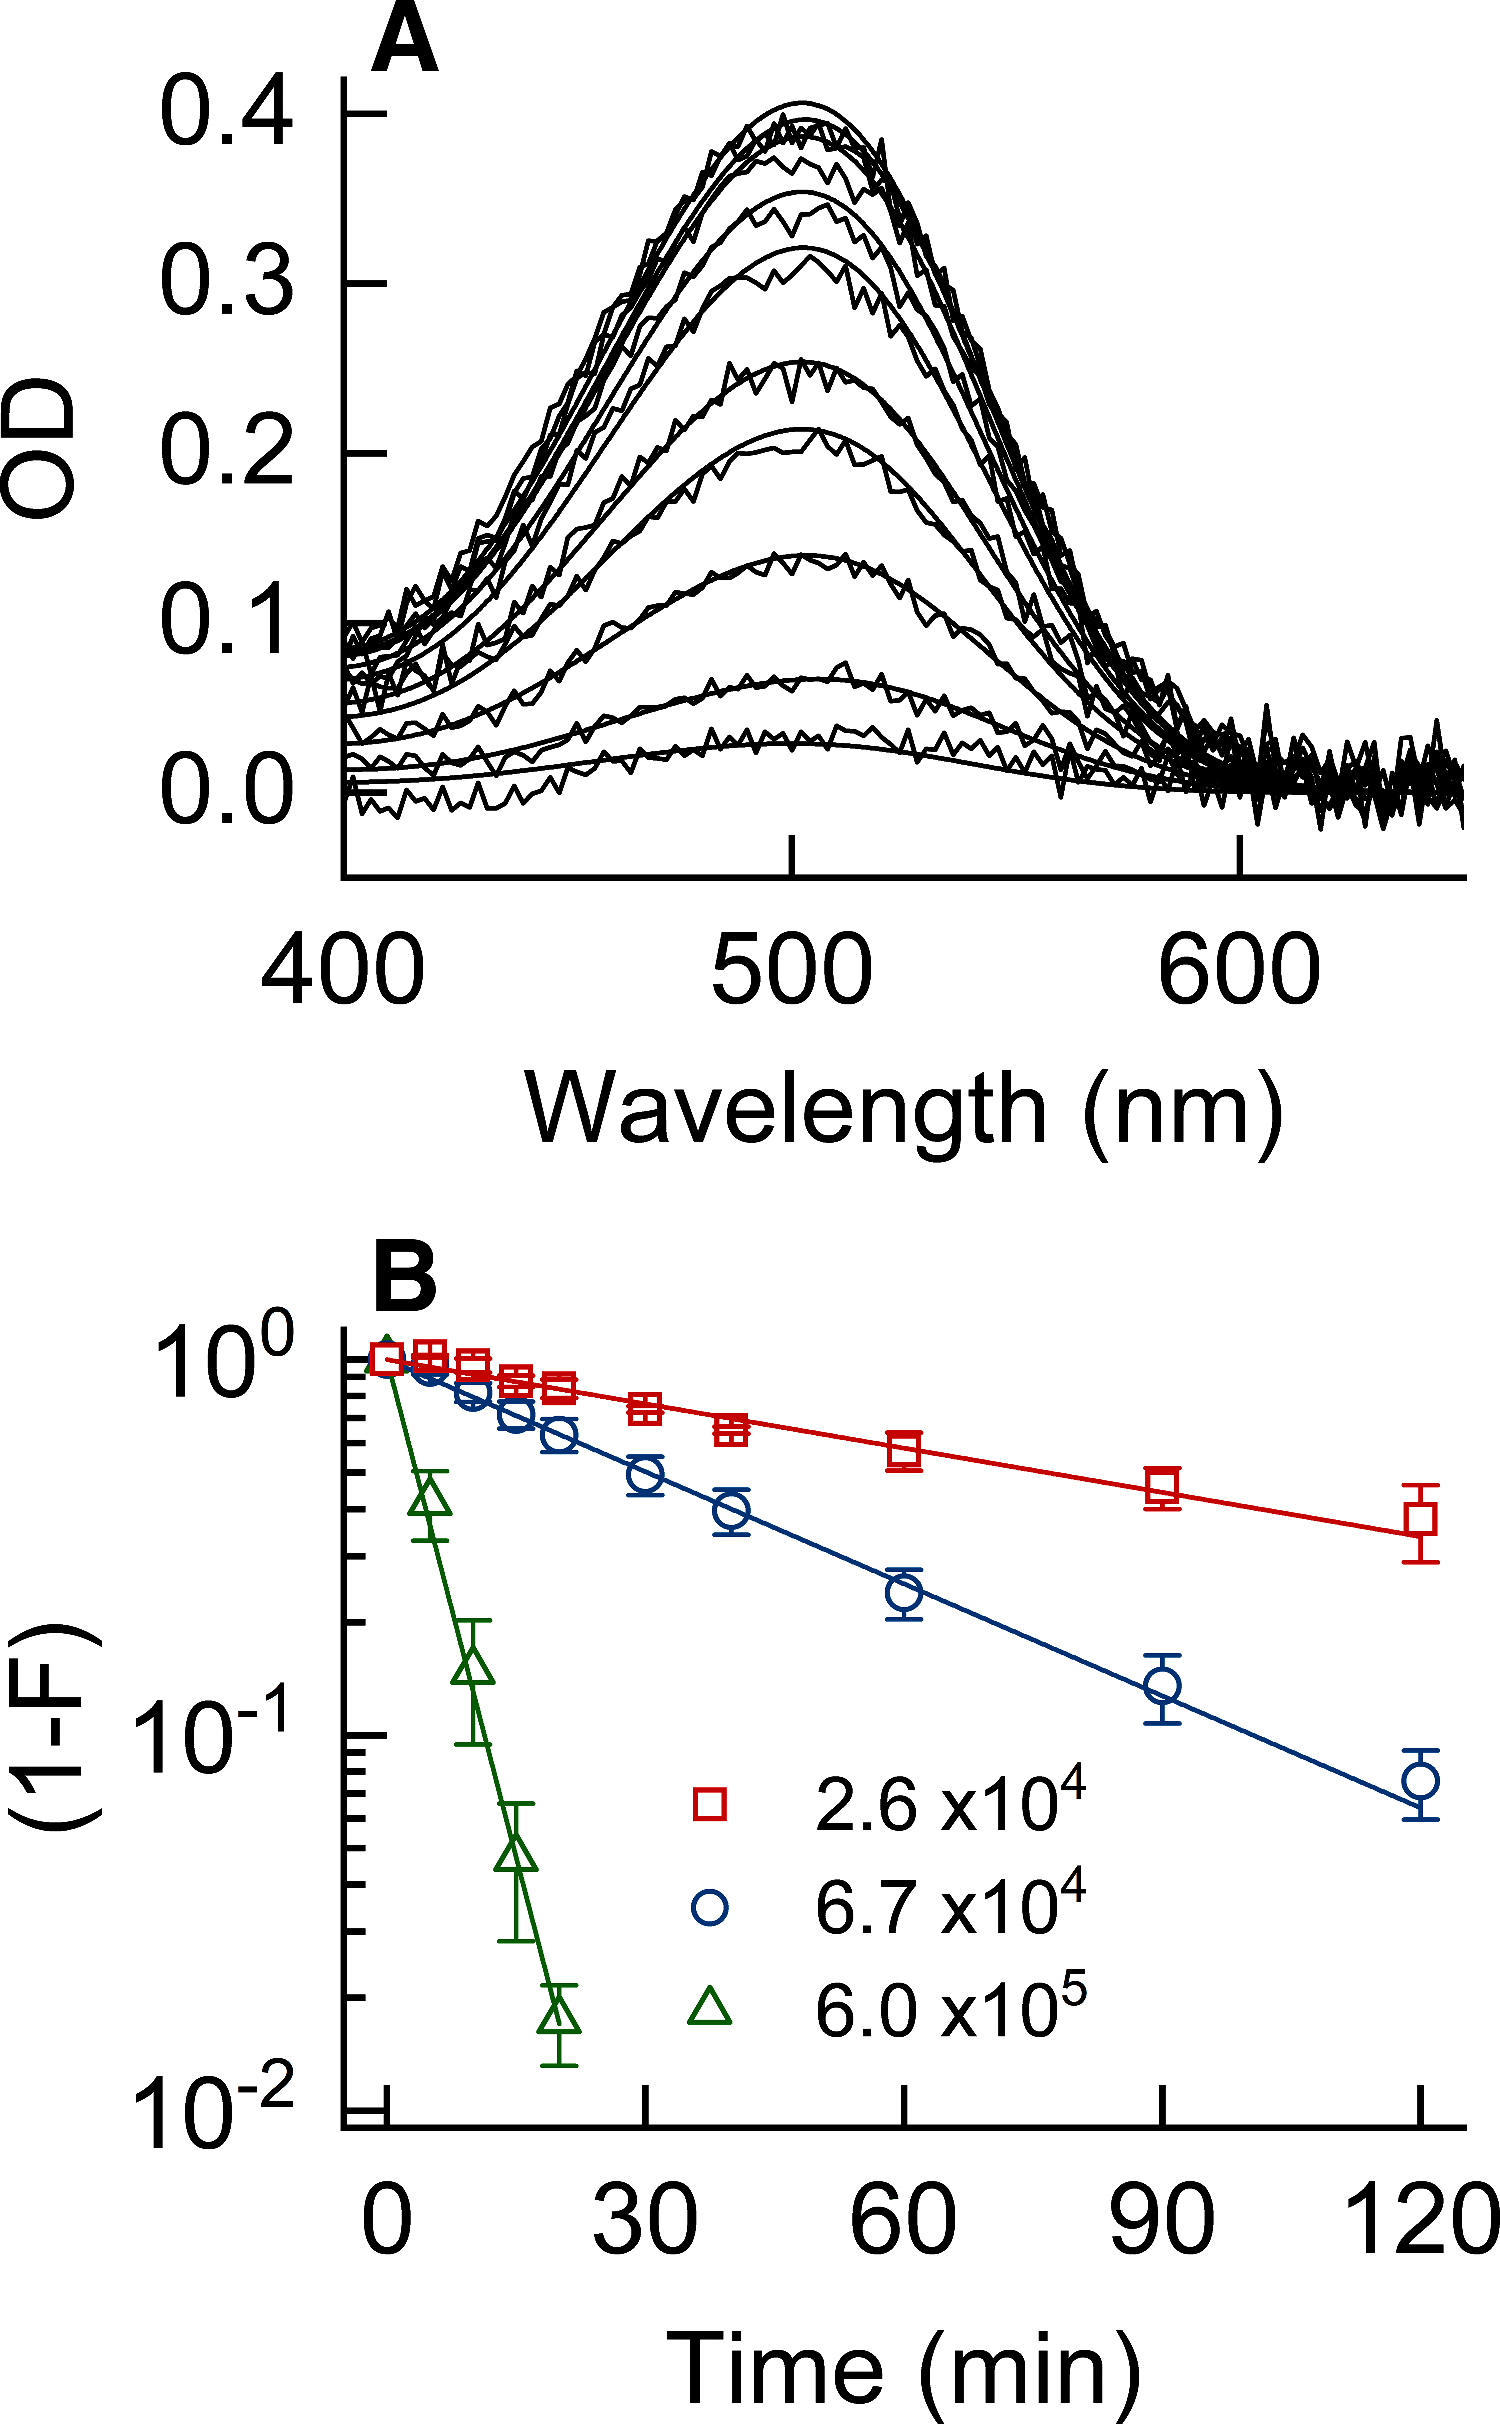
MSP measurements of OD of WT mouse rods during pigment bleaching. A, Examples of absorbance spectra recorded first in DA retina and then after exposure to 570 nm light of 6.7 × 10⁴ ϕ µm−2 s−1 for 5, 10, 15, 20, 30, 40, 60, 90, and 120 min. Spectra were fitted with rhodopsin templates (Govardovskii et al., 2000) with λmax = 503 nm. B, Bleaching of rhodopsin expressed as normalized OD at 500 nm from recordings as in A for background intensities of 2.6 × 10⁴ ϕ µm−2 s−1 (red squares, n = 3), 6.7 × 10⁴ ϕ µm−2 s−1 (blue circles, n = 5), and 6.0 × 10⁵ ϕ µm−2 s−1 (green triangles, n = 3). Lines indicate fraction of pigment remaining (1 – F) calculated from Equation 4.
Figure 6.
Figure 6.
Sensitivity and rhodopsin concentration after long exposures to bright light. A, Responses were recorded as in Figure 1 first in darkness (DA, n = 24). Retinae were then exposed for a variable duration (as indicated in the figure) to 560 nm light of 3.6 × 10⁵ ϕ µm−2 s−1 and returned to darkness for an additional 45-60 min to allow the rods to come to steady state. Data from bleached conditions are averages from 3 retinae for each condition and give response amplitude as a function of flash strength. B, Sensitivity from A, normalized to DA sensitivity. Dashed red line is Equation 5, with k = 70 and 1 – F calculated from Equation 4. Black line is also Equation 5, but with 1 – F taken from its value inferred from the black line in C. Arrow points to the sensitivity where the two lines diverge at ∼0.8%-1% of DA rhodopsin concentration. C, Inferred concentration of rhodopsin (1 – F). Dashed red line is 1 – F from Equation 4, assuming no regeneration. Black line is 1 – F calculated from the numerical solution to Equations 2a and 2b, with the constants kd = 2.0 × 10⁻⁴ s−1 and kr = 1.8 × 10⁻¹¹ µm2. Arrow points to the value of 1 – F where the two curves diverge.
Figure 7.
Figure 7.
Mechanism of regeneration. A, Response-intensity relations recorded before, during, and after the retinae were exposed to a 60 min, 560 nm background of 3.6 × 10⁵ ϕ µm−2 s−1. Responses are means from 5 retinae. B, Smaller responses from A, replotted on an expanded scale. C, Sensitivity during or after background exposure normalized to DA sensitivity (n = 5). Dashed vertical line at 0 min indicates when background was turned off. D, HPLC analysis of retinoid content in WT mouse retinae in dark (0 min) and after exposure to a 560 nm bleaching light of 1.0 × 10⁶ ϕ µm−2 s−1 (DA, n = 4; 30 min, n = 3; 60 min, n = 7, 90 min, n = 5). Retinoid levels normalized to those in darkness are given for 11-cis retinal (black), 9-cis retinal (red), and atRAL (blue). Open symbols represent sum of 9-cis and 11-cis retinal. Dotted horizontal line indicates estimate of 11-cis retinal in DA cones. The first data point for 9-cis retinal (0 min, DA) is uncertain because it is close to the detection limit of the instrument.

References

    1. Aguilar M, Stiles WS (1954) Saturation of the rod mechanism of the retina at high levels of stimulation. Optica Acta 1:59–65. 10.1080/713818657 - DOI
    1. Alpern M (1971) Rhodopsin kinetics in the human eye. J Physiol 217:447–471. 10.1113/jphysiol.1971.sp009580 - DOI - PMC - PubMed
    1. Arshavsky VY, Burns ME (2012) Photoreceptor signaling: supporting vision across a wide range of light intensities. J Biol Chem 287:1620–1626. 10.1074/jbc.R111.305243 - DOI - PMC - PubMed
    1. Artemyev NO (2008) Light-dependent compartmentalization of transducin in rod photoreceptors. Mol Neurobiol 37:44–51. 10.1007/s12035-008-8015-2 - DOI - PubMed
    1. Baylor DA, Lamb TD, Yau KW (1979) The membrane current of single rod outer segments. J Physiol 288:589–611. - PMC - PubMed

Publication types