. 2021 Mar 31;41(13):2944-2963.
doi: 10.1523/JNEUROSCI.2250-20.2021. Epub 2021 Feb 16.

Network Asynchrony Underlying Increased Broadband Gamma Power

Affiliations

Network Asynchrony Underlying Increased Broadband Gamma Power

Nicolas Guyon et al. J Neurosci. .

Abstract

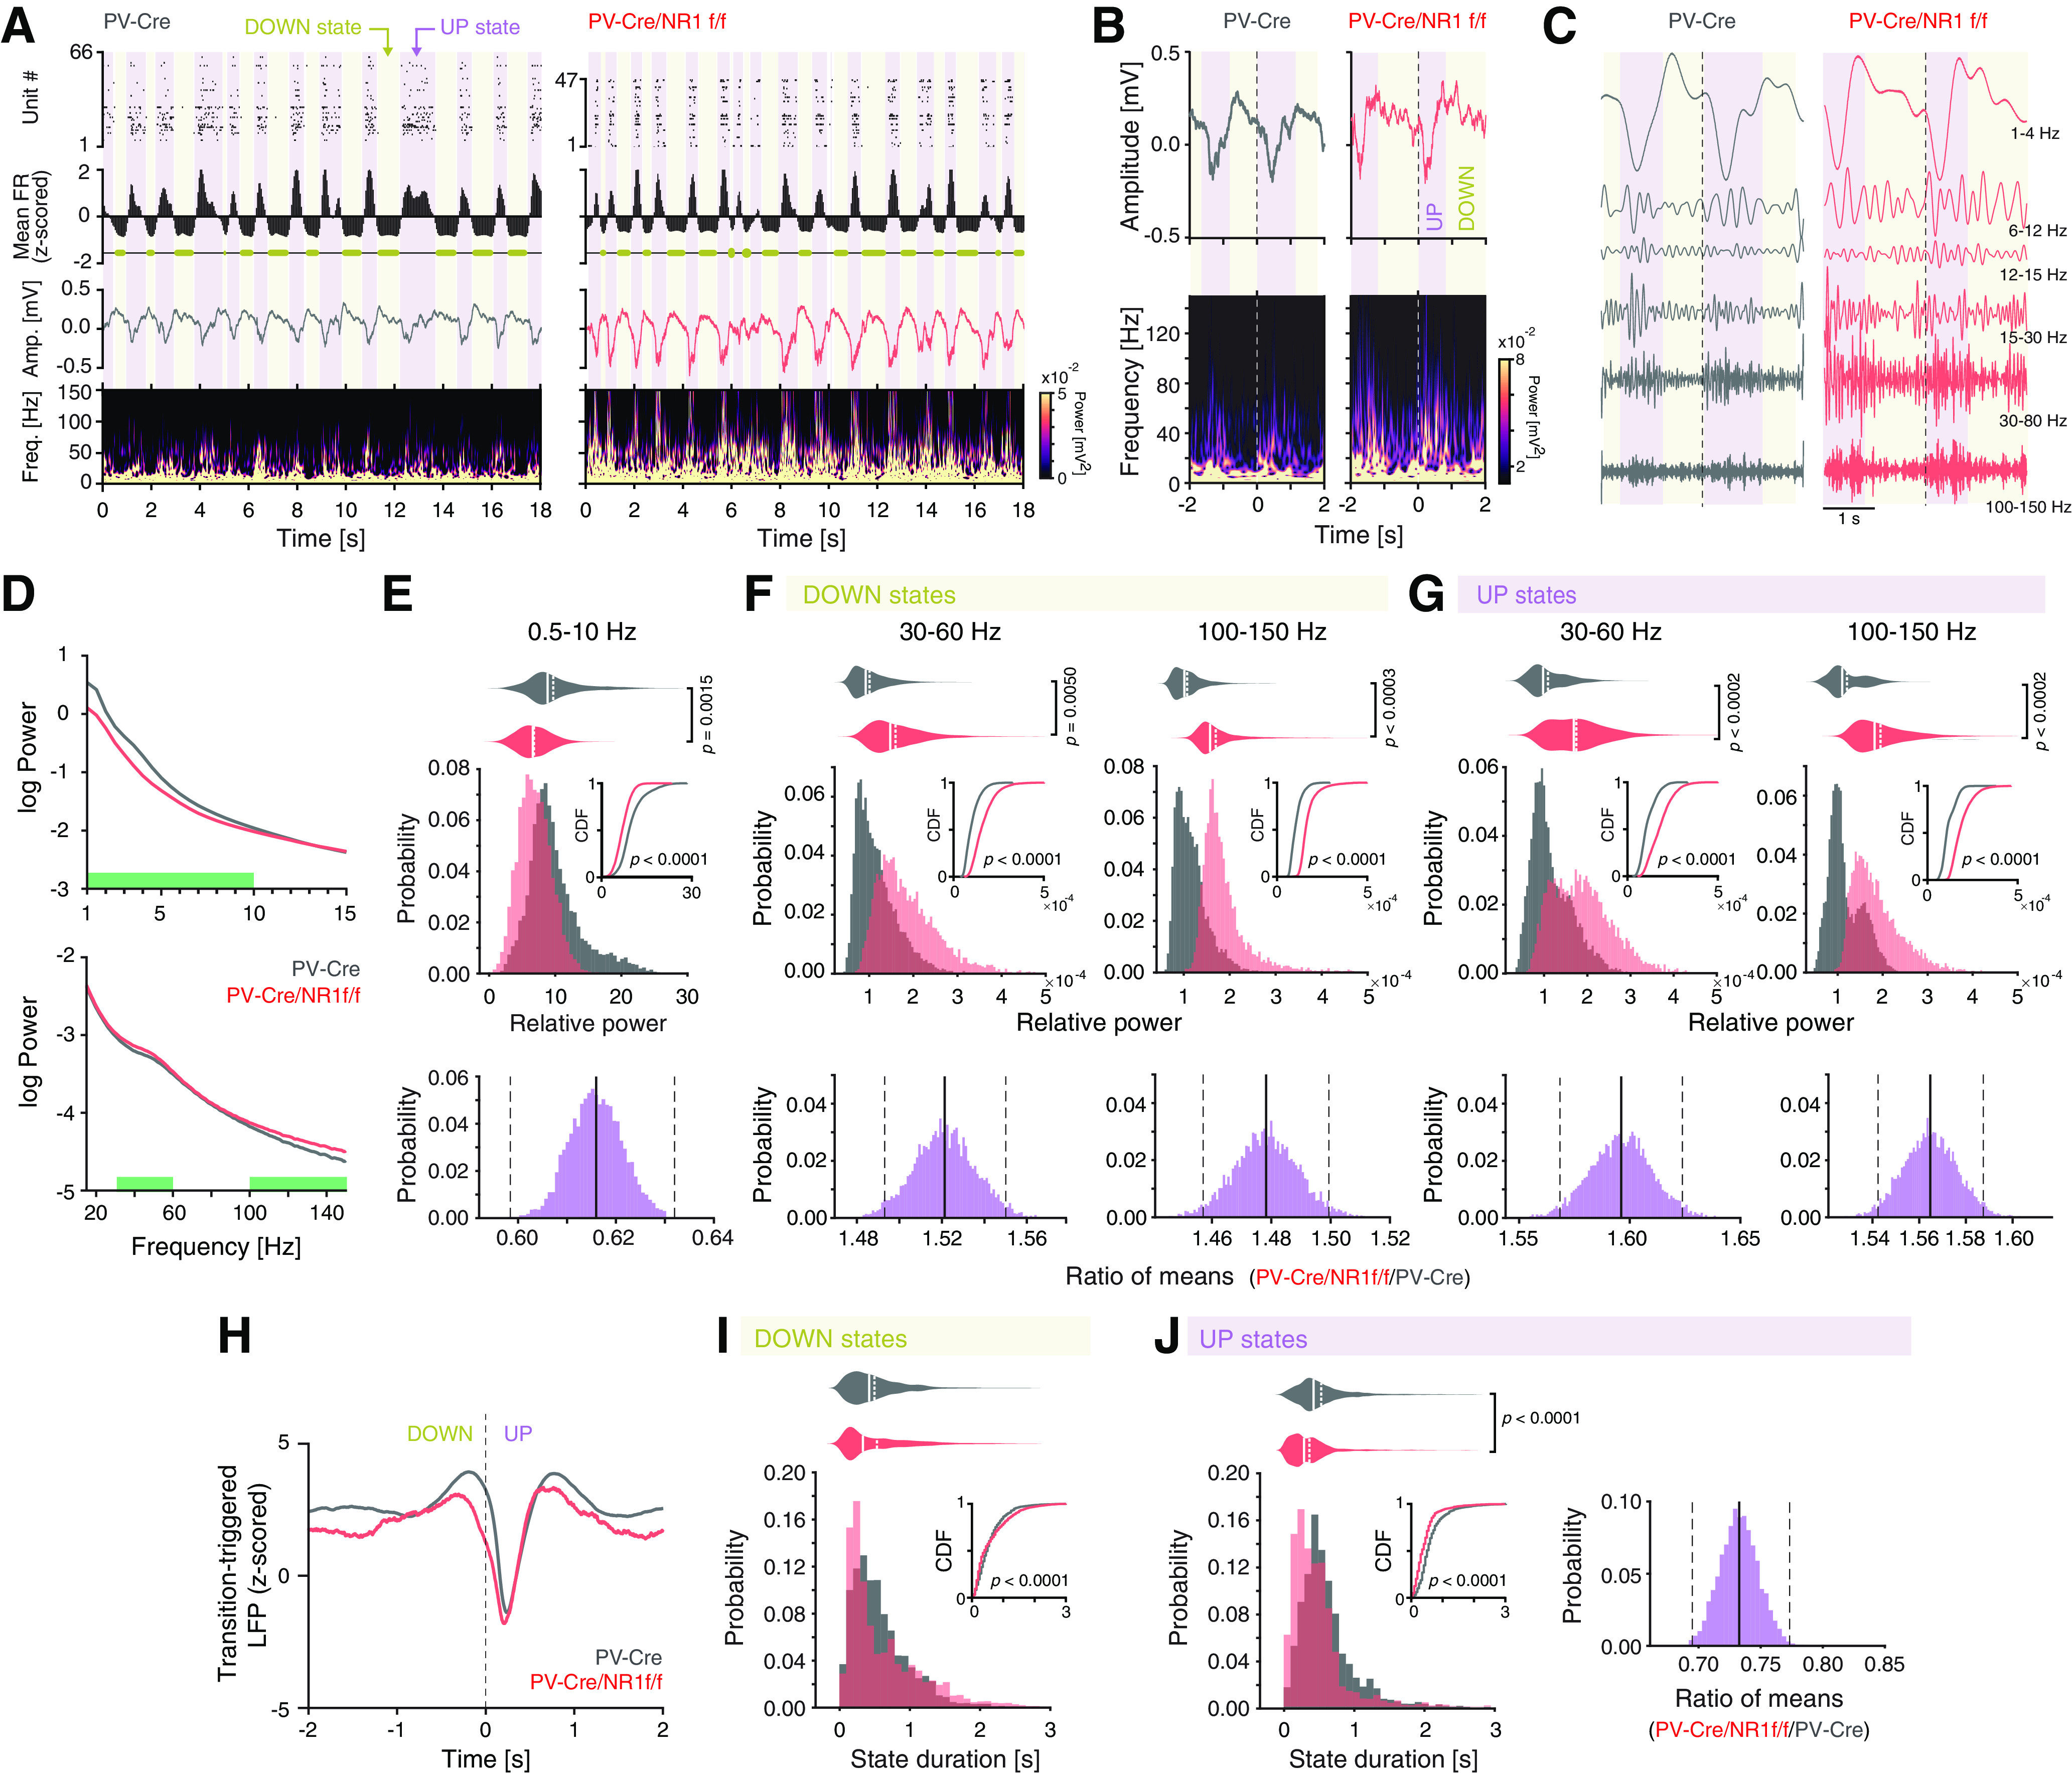
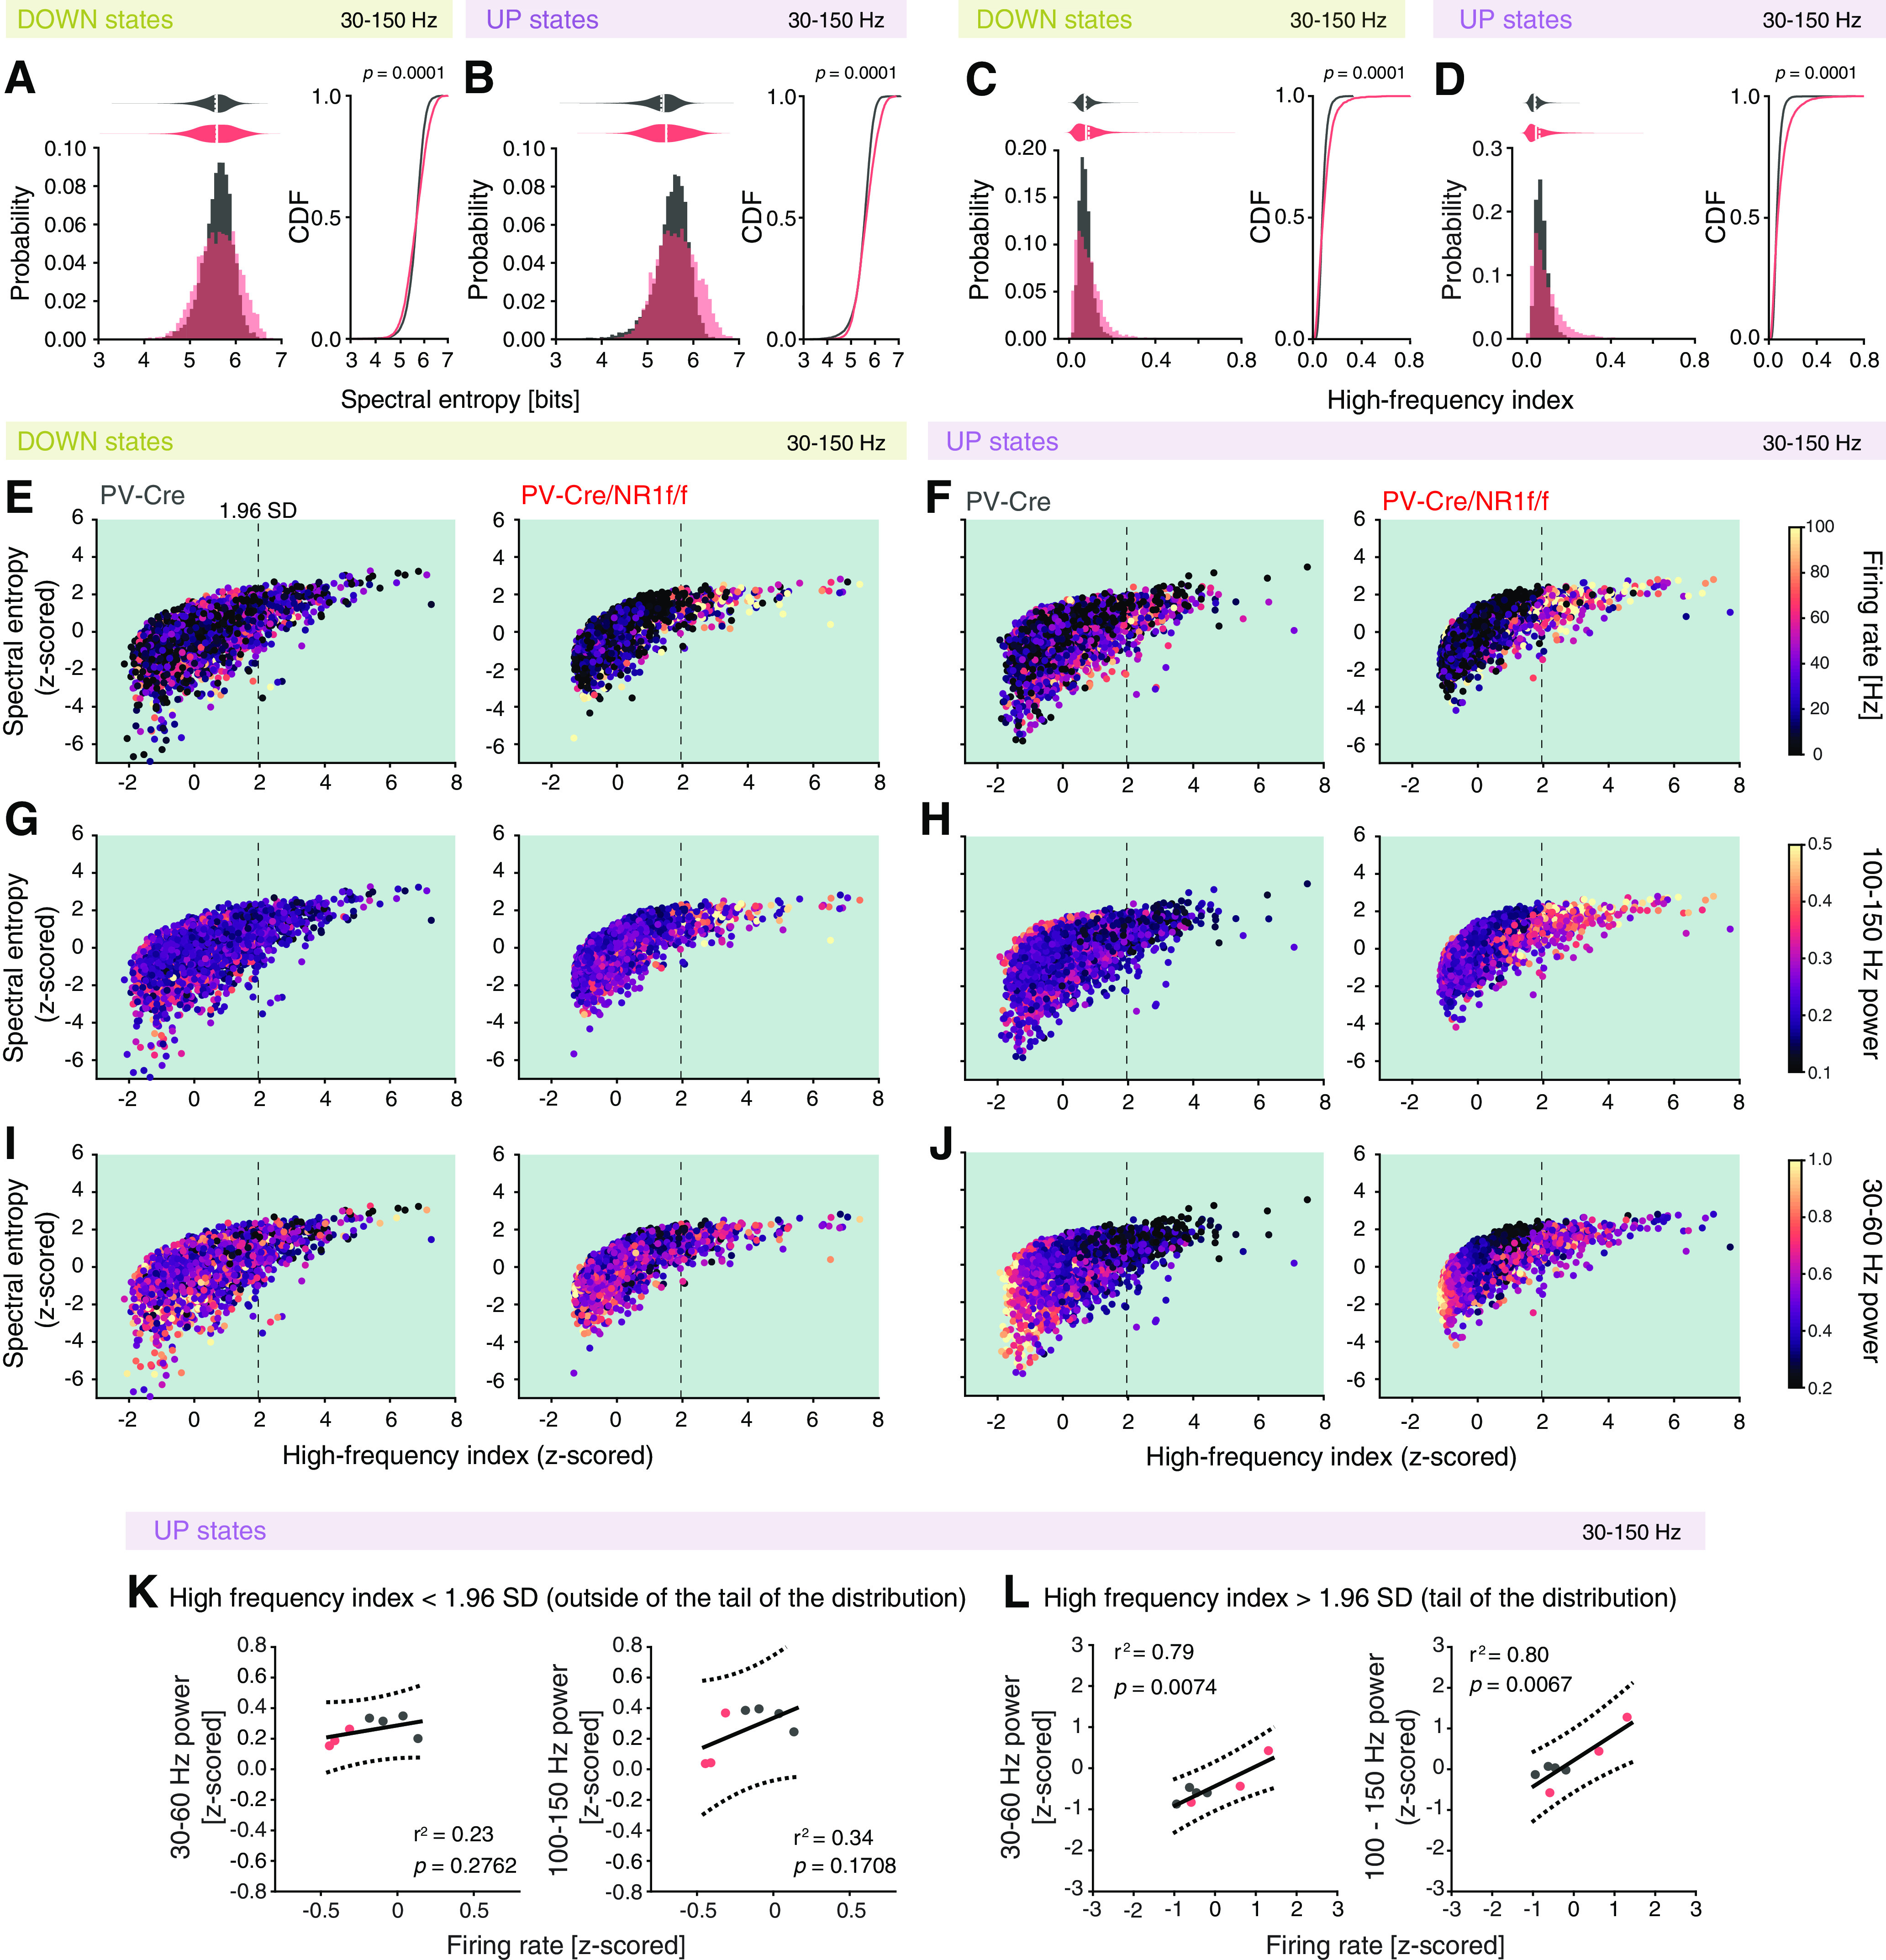
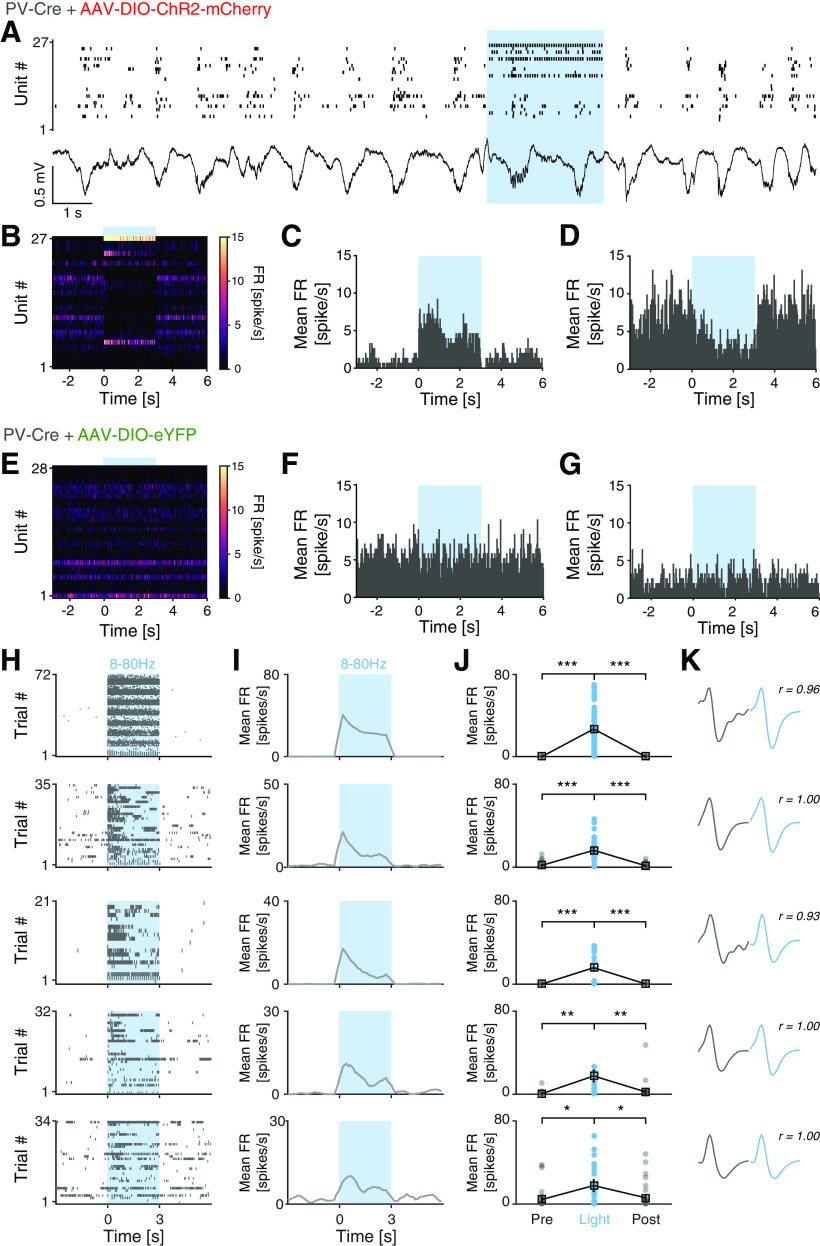
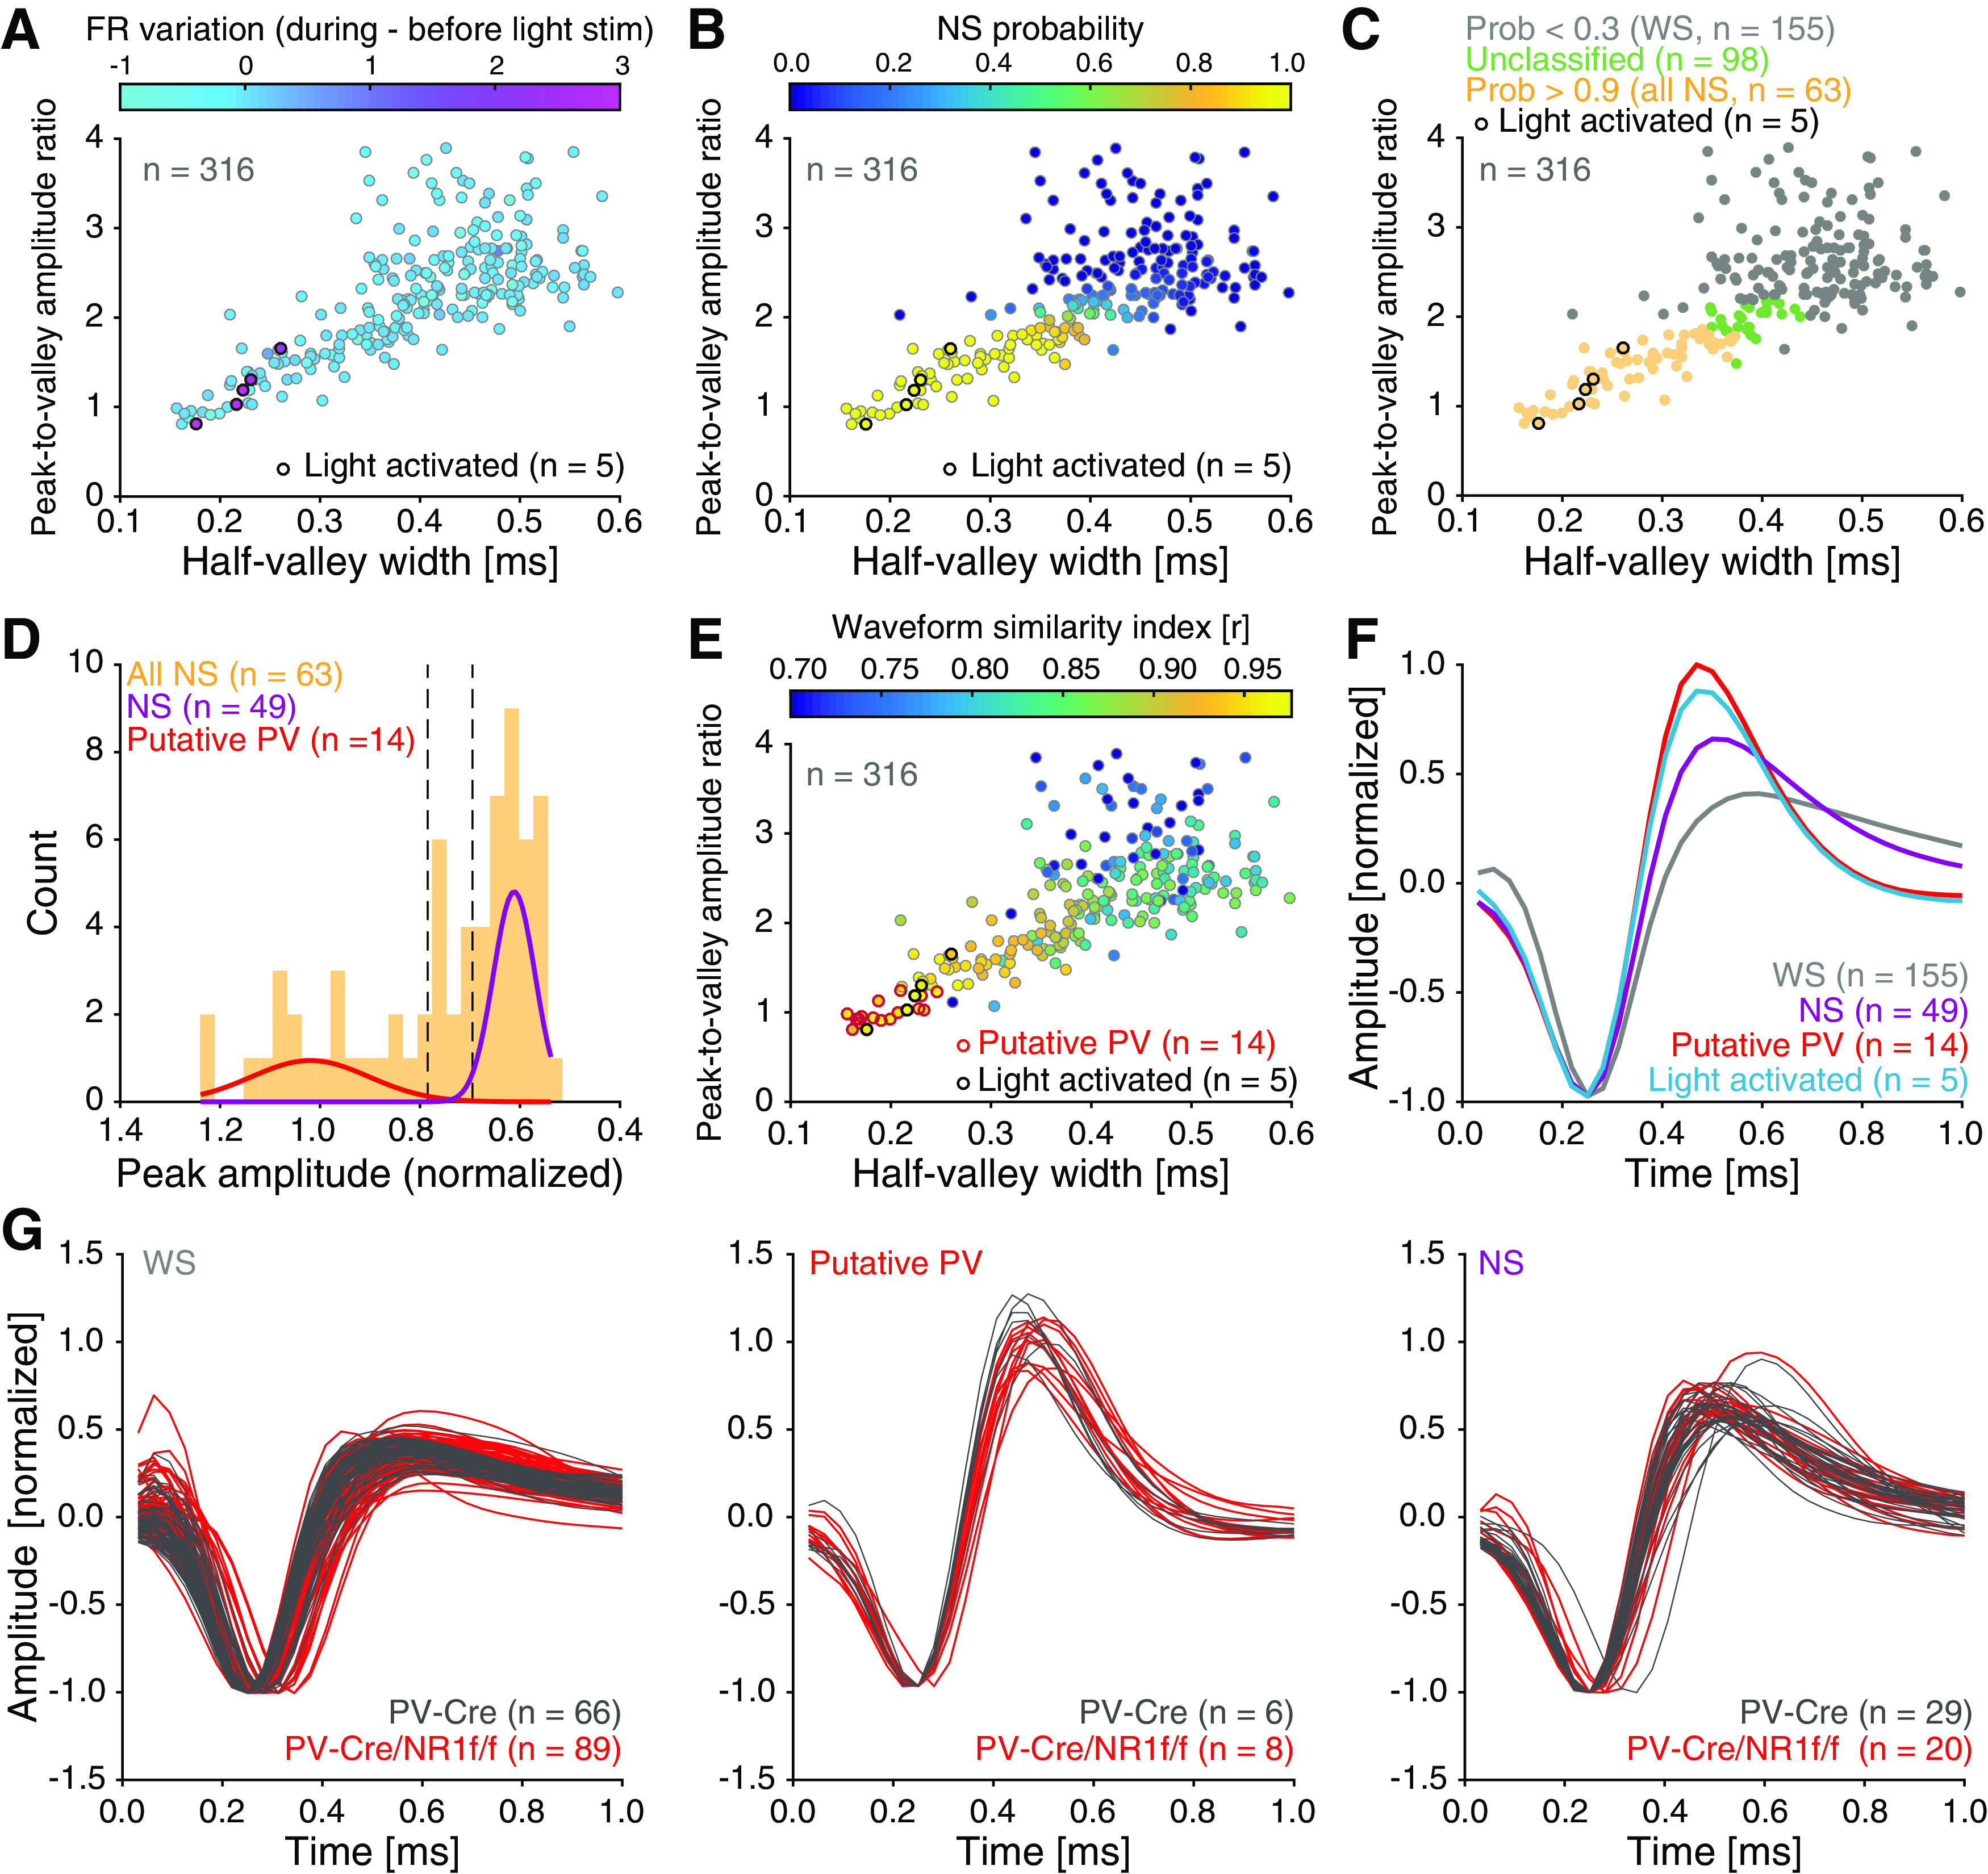
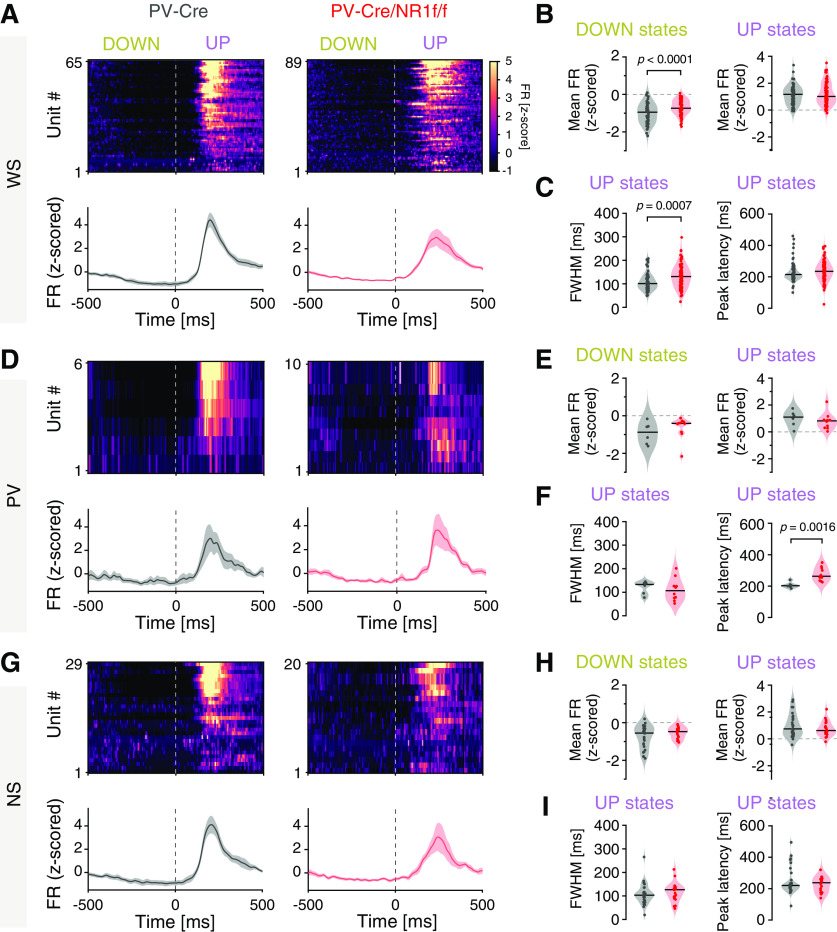
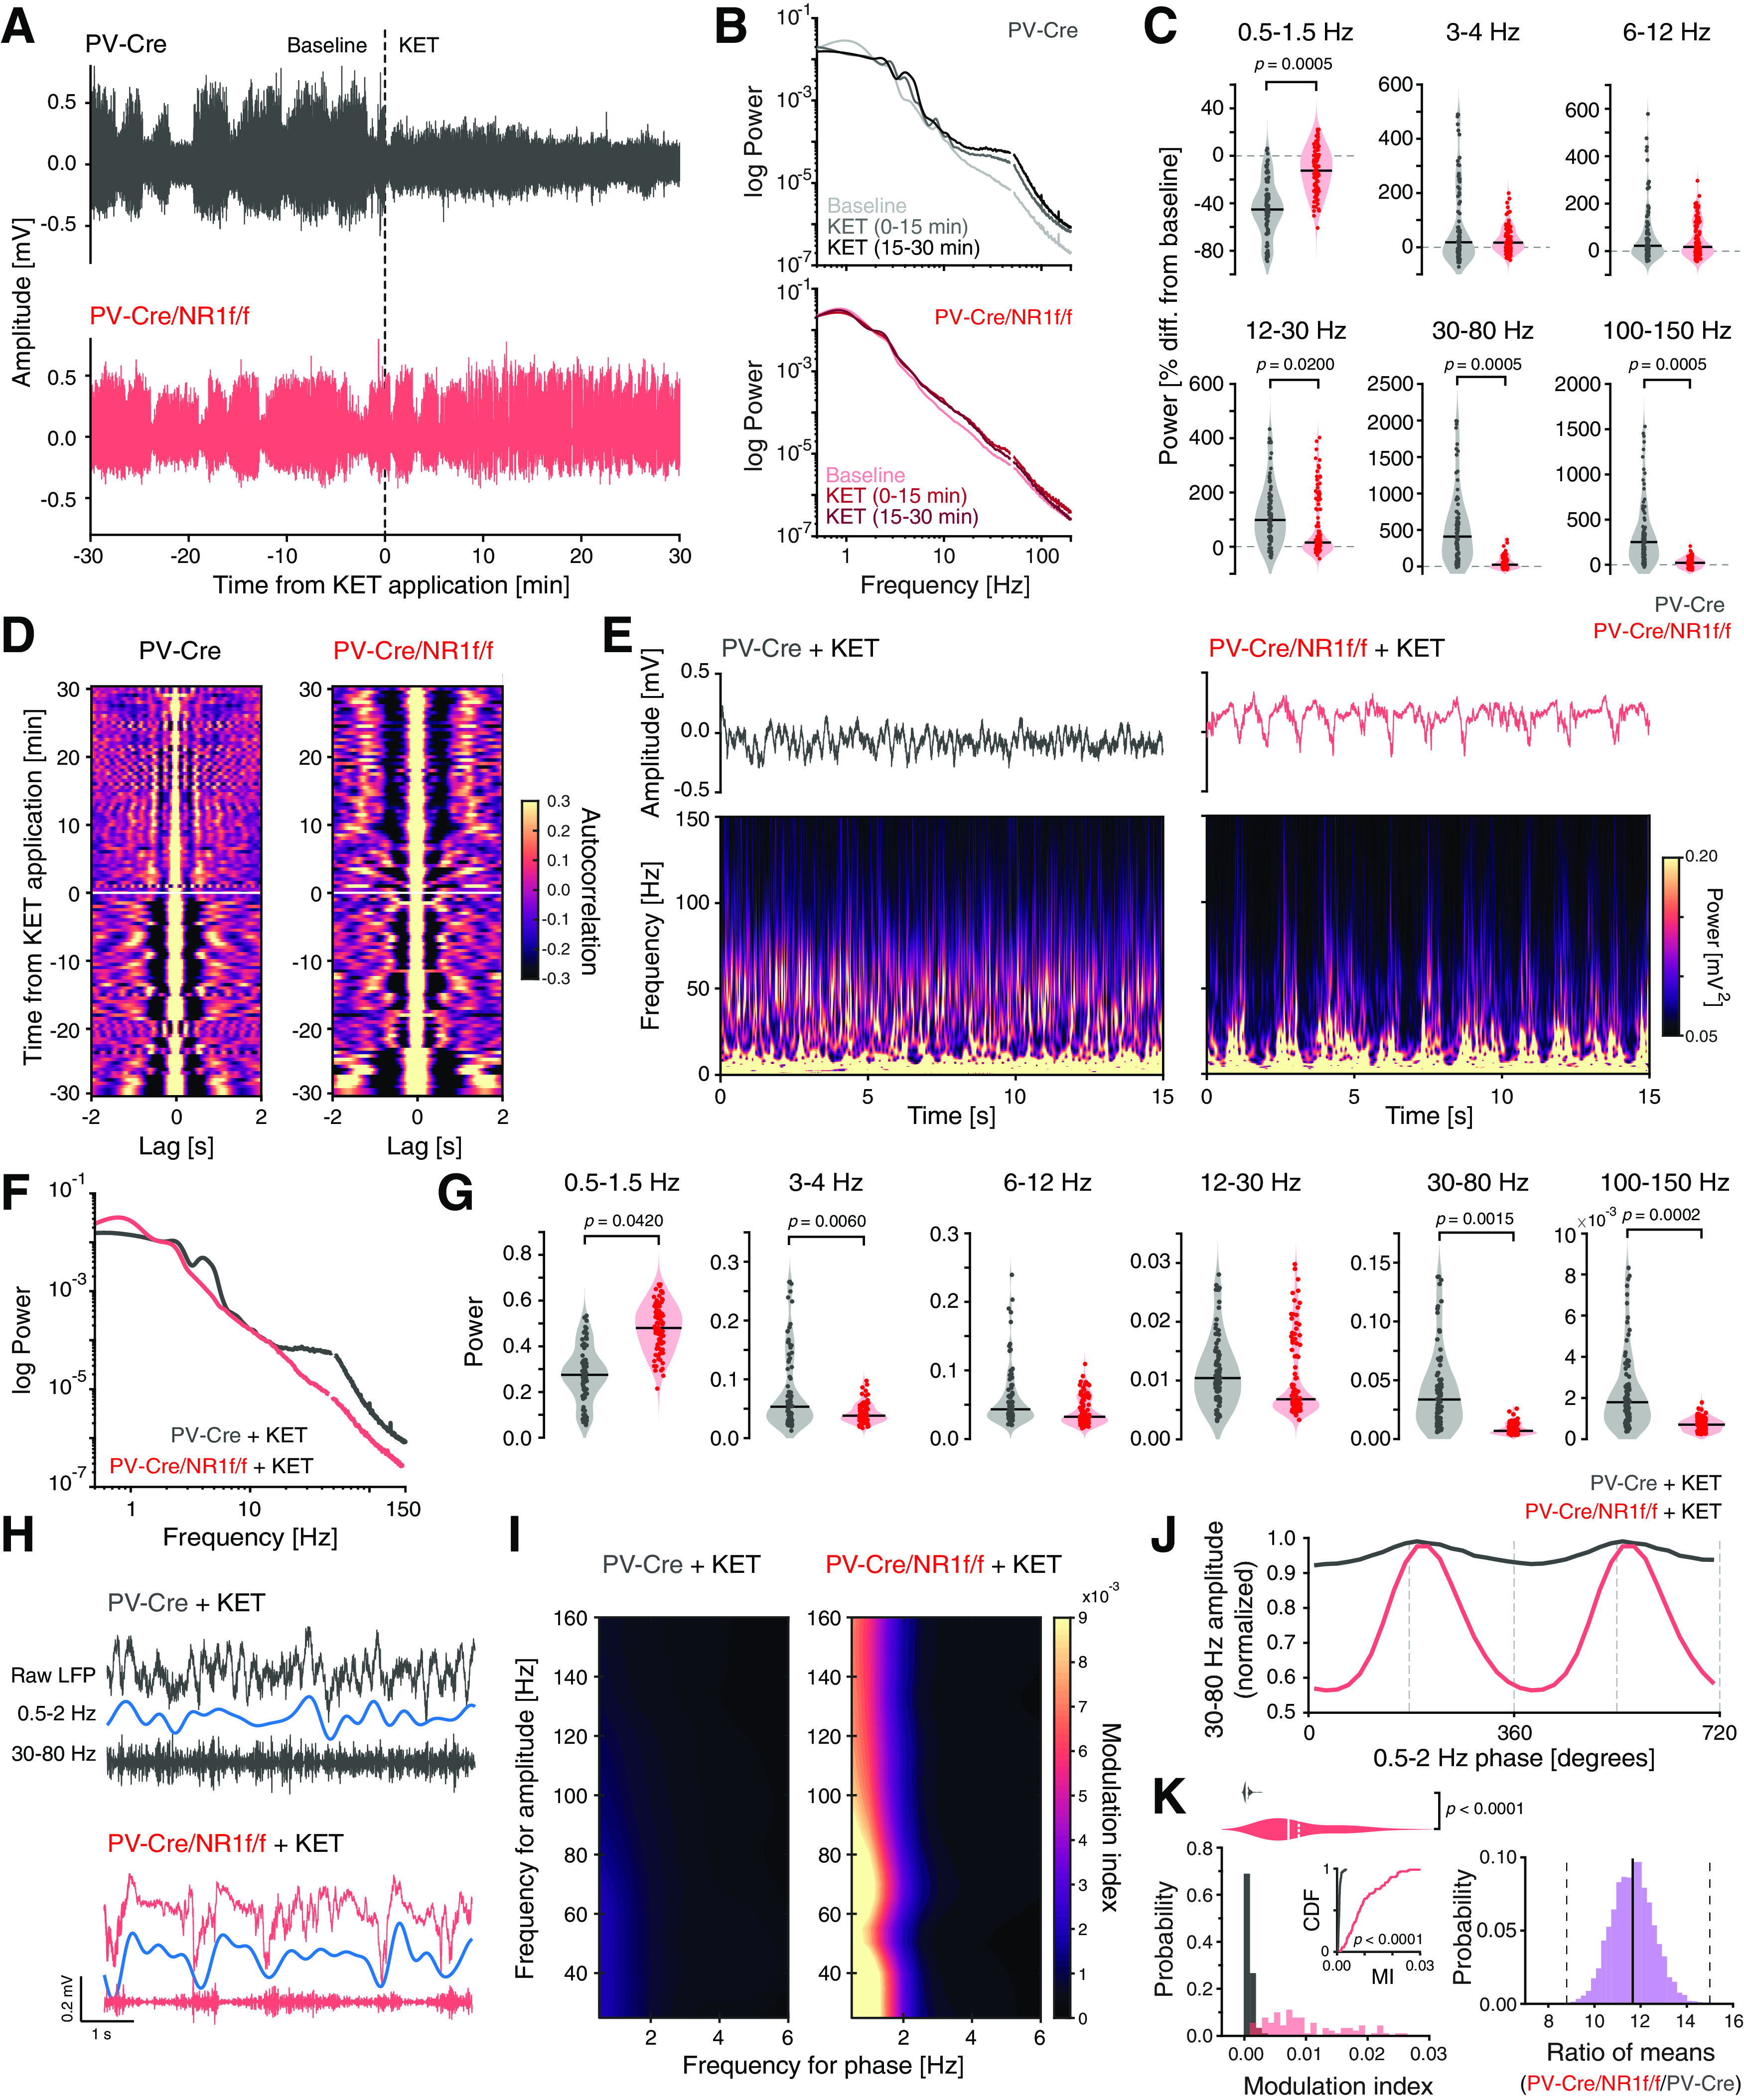
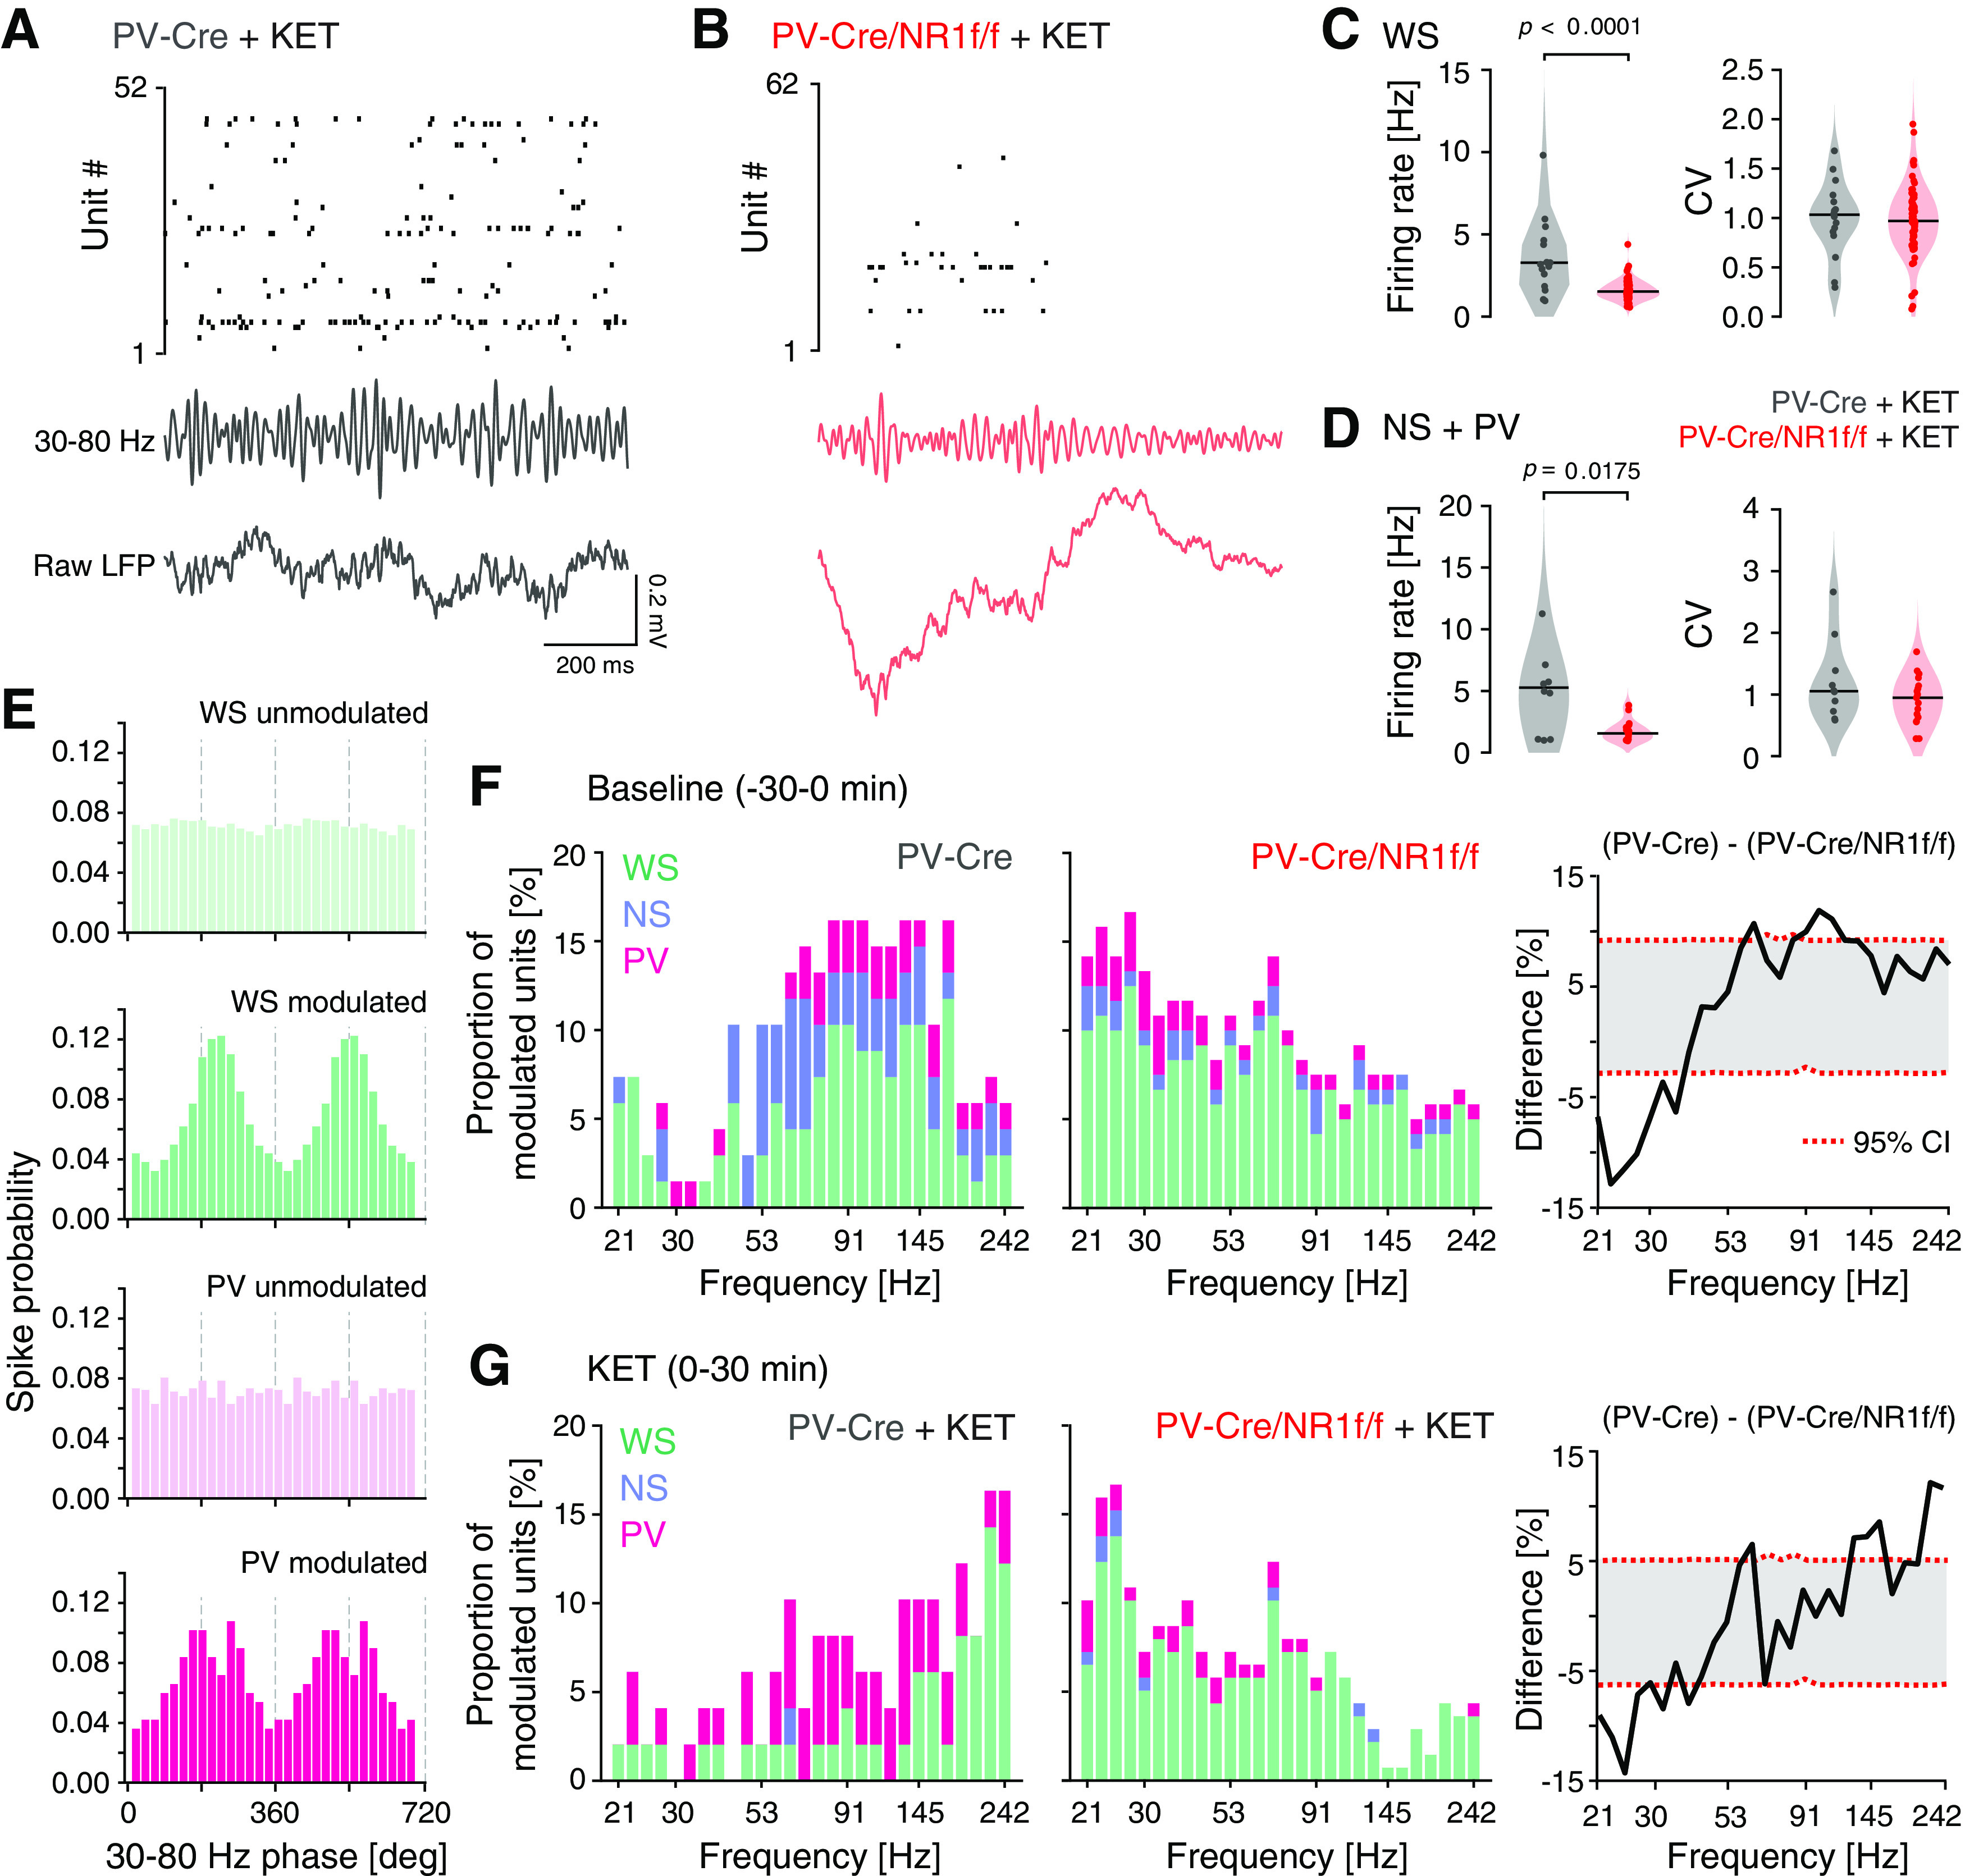
Synchronous activity of cortical inhibitory interneurons expressing parvalbumin (PV) underlies expression of cortical γ rhythms. Paradoxically, deficient PV inhibition is associated with increased broadband γ power in the local field potential. Increased baseline broadband γ is also a prominent characteristic in schizophrenia and a hallmark of network alterations induced by NMDAR antagonists, such as ketamine. Whether enhanced broadband γ is a true rhythm, and if so, whether rhythmic PV inhibition is involved or not, is debated. Asynchronous and increased firing activities are thought to contribute to broadband power increases spanning the γ band. Using male and female mice lacking NMDAR activity specifically in PV neurons to model deficient PV inhibition, we here show that neuronal activity with decreased synchronicity is associated with increased prefrontal broadband γ power. Specifically, reduced spike time precision and spectral leakage of spiking activity because of higher firing rates (spike "contamination") affect the broadband γ band. Desynchronization was evident at multiple time scales, with reduced spike entrainment to the local field potential, reduced cross-frequency coupling, and fragmentation of brain states. Local application of S(+)-ketamine in (control) mice with intact NMDAR activity in PV neurons triggered network desynchronization and enhanced broadband γ power. However, our investigations suggest that disparate mechanisms underlie increased broadband γ power caused by genetic alteration of PV interneurons and ketamine-induced power increases in broadband γ. Our study confirms that enhanced broadband γ power can arise from asynchronous activities and demonstrates that long-term deficiency of PV inhibition can be a contributor.SIGNIFICANCE STATEMENT Brain oscillations are fundamental to the coordination of neuronal activity across neurons and structures. γ oscillations (30-80 Hz) have received particular attention through their association with perceptual and cognitive processes. Synchronous activity of inhibitory parvalbumin (PV) interneurons generates cortical γ oscillation, but, paradoxically, PV neuron deficiency is associated with increases in γ oscillations. We here reconcile this conundrum and show how deficient PV inhibition can lead to increased and asynchronous excitatory firing, contaminating the local field potential and manifesting as increased γ power. Thus, increased γ power does not always reflect a genuine rhythm. Further, we show that ketamine-induced γ increases are caused by separate network mechanisms.

Keywords: DOWN and UP states; NMDAR; PFC; asynchrony; broadband gamma; parvalbumin.


Figures

Figure 1.
Figure 1.
Virus expression and position of silicon probes. A, Illustration of viral injections. For optogenetic targeting of mPFC PV interneurons, AAV5-DIO-ChR2-mCherry (red) was unilaterally injected into the mPFC of PV-Cre/NR1f/f (n = 3) and PV-Cre (n = 4) mice. AAV5-DIO-eYFP (green) was unilaterally injected into the mPFC of PV-Cre (n = 4) for control of optogenetic artifacts (see Fig. 6E–G). B, Coronal sections of the mPFC showing expression of ChR2-mCherry (red; left) in a representative PV-Cre/NR1f/f mouse, and eYFP (green; right) in a representative PV-Cre mouse. C, Left, Representative 3D illustration of detected mPFC expression of ChR2-mCherry (top: PV-Cre/NR1f/f mouse; middle: PV-Cre mouse) and eYFP (bottom: PV-Cre mouse) registered to the Allen Mouse Brain Common Coordinate Framework version 3 (ABA_v3) reference atlas. Box represents the mPFC (ACA, ILA, and PL according to ABA_v3). Middle, Closeup (front view) of the box on the left. Right, Representative coronal sections used for detection and 3D plotting of virus-expressing neurons. D, Illustration of the experimental setup. Electrophysiological recordings were conducted using a silicon probe in urethane-anesthetized mice. The four-shank eight-tetrode silicon probe was targeted to the PL area in the mPFC. E, Example DiO (red) labeling of the four shank tracts of a silicon probe. Nuclei are counterstained by DAPI (white). ACA, Anterior cingulate area; IL, Infralimbic area. Scale bars: B, 300 µm; C, 1 mm; E, 500 µm. Brain silhouette in A and mouse in D were sourced from https://scidraw.io/ and adapted from Kennedy (2020) and Tyler and Kravitz (2020), respectively.
Figure 2.
Figure 2.
Mice with lack of NMDAR activity in PV neurons display altered cortical states. A, B, Representative mPFC LFP oscillations (3200 s) recorded under urethane anesthesia in a PV-Cre (A) and a PV-Cre/NR1f/f (B) mouse, respectively. Top, Raw LFP. Middle, Color-coded outline of detected activated (green), deactivated (purple), and transition states (white). Bottom, Spectrogram (0-5 Hz) of the LFP trace in the top panel. A, Mice with intact NMDAR activity in PV neurons (PV-Cre) display typical cyclic transitions between deactivated (high-amplitude low-frequency [0.5-2 Hz] oscillations) and activated states (low-amplitude higher-frequency oscillations). B, PV-Cre/NR1f/f mice show less defined slow oscillations along with altered transition patterns between deactivated and activated states. C, Representative LFP traces (5 s) of activated (green), transition (gray), and deactivated states (purple), respectively, from a PV-Cre mouse (top) and a PV-Cre/NR1f/f mouse (bottom). D-G, PV-Cre mice (n = 4, gray) and PV-Cre/NR1f/f mice (n = 3, red). D, Classification of brain states in PV-Cre mice (top) and PV-Cre/NR1f/f mice (bottom). Left, For detection of deactivated, activated, and transition (unclassified) states, a GMM was used for clustering of 30 s epochs (colored circles) of the LFP trace based on the power in the 0.5-2 Hz and 3-45 Hz frequency bands. Middle, Relative PSD (1-91 Hz) of the LFP for the activated (green) and deactivated (purple) states. Right, Magnification of the relative PSD of the LFP in the 1-4 Hz frequency band. E-G, Comparisons of the proportion (of total time), frequency (states/min), and duration, of deactivated and activated states in PV-Cre mice and PV-Cre/NR1f/f mice. E, There is no difference in the proportion time spent in deactivated and in activated states between PV-Cre/NR1f/f and PV-Cre mice (F(1,10) = 0.1908, p = 0.6715). Deactivated: PV-Cre: 0.85 ± 0.04; PV-Cre/NR1f/f: 0.81 ± 0.03; p = 0.8768; activated: PV-Cre: 0.07 ± 0.03; PV-Cre/NR1f/f: 0.08 ± 0.01; p > 0.9999. F, Mice lacking NMDAR in PV neurons (PV-Cre/NR1f/f) transition into deactivated states significantly more often than mice with intact NMDAR in PV neurons (PV-Cre mice) (F(1,10) = 0.2252, p = 0.0008). Frequency (states/min) of deactivated: PV-Cre: 0.098 ± 0.012 states/min; PV-Cre/NR1f/f: 0.394 ± 0.068 states/min; p = 0.0001; activated: PV-Cre: 0.066 ± 0.018 states/min; PV-Cre/NR1f/f: 0.069 ± 0.013 states/min; p > 0.9999. G, The duration of the deactivated states is significantly shorter in mice lacking NMDAR in PV neurons (PV-Cre/NR1f/f) than in mice with intact NMDAR in PV neurons (PV-Cre) (F(1,10) = 64.89, p < 0.0001). Deactivated: PV-Cre: 530.46 ± 37.31 s; PV-Cre/NR1f/f: 130.63 ± 29.09 s; p < 0.0001; activated: PV-Cre: 51.88 ± 11.79 s; PV-Cre/NR1f/f: 29.33 ± 4.44 s; p > 0.9999. Data are mean ± SEM. E–G, Two-way ANOVA was used to assess significance, followed by a Bonferroni's multiple comparisons test if the ANOVA comparisons reached significance.
Figure 3.
Figure 3.
Mice with lack of NMDAR activity in PV neurons display increased broadband γ power and decreased δ-phase modulation of broadband γ and HFB amplitude. A, B, E-G, PV-Cre mice (n = 4, gray) and PV-Cre/NR1f/f mice (n = 3, red). A, Mean PSD of the LFP of deactivated (left) and activated (right) states. Green bar represents frequency band (100-150 Hz) with significant power difference between PV-Cre and PV-Cre/NR1f/f mice. B, Comparisons of the integrated power at different frequency bands during deactivated states between PV-Cre and PV-Cre/NR1f/f mice. Low-δ (0.5-1.5 Hz): PV-Cre: 0.53 ± 0.04; PV-Cre/NR1f/f: 0.44 ± 0.01; t = 1.62, p = 0.99; high-δ (3-4 Hz): PV-Cre: 0.041 ± 0.006; PV-Cre/NR1f/f: 0.040 ± 0.004; t = 0.09, p = 1; theta (6-12 Hz): PV-Cre: 0.017 ± 0.006; PV-Cre/NR1f/f: 0.029 ± 0.004; t = −1.67, p = 0.93; β (12-30 Hz): PV-Cre: 0.008 ± 0.003; PV-Cre/NR1f/f: 0.019 ± 0.004; t = −2.48, p = 0.34; broadband γ (30-80 Hz): PV-Cre: 0.003 ± 0.001; PV-Cre/NR1f/f: 0.009 ± 0.003; t = −2.12, p = 0.52; HFB (100-150 Hz): PV-Cre: 0.00034 ± 0.0001; PV-Cre/NR1f/f: 0.00102 ± 0.0001; t = −4.55, p = 0.036. C, Representative phase-amplitude comodulograms of a PV-Cre (left) and a PV-Cre/NR1f/f mouse (right), respectively, showing the modulation of the broadband γ and the HFB amplitude by the phase of 0.5-2 Hz oscillations. D, Representative unfiltered LFP trace (top) and filtered 0.5-2 Hz (middle) and broadband γ (30-80 Hz; bottom) bands during a deactivated state in a PV-Cre and a PV-Cre/NR1f/f mouse, respectively. E, Mean broadband γ amplitude (left) and mean HFB amplitude (right) at different phases of the 0.5-2 Hz cycles. F, Left, Comparison of the probability distribution of the MI between broadband γ amplitude and 0.5-2 Hz phase shows that PV-Cre/NR1f/f mice have more deactivated epochs (30 s) with lower MI (p < 0.0001, CDF inset) and significantly decreased comodulation between broadband γ amplitude and 0.5-2 Hz phase compared with PV-Cre mice (PV-Cre: 0.0072 ± 0.0012; PV-Cre/NR1f/f: 0.0052 ± 0.0021; F(1,7) = 18.180, p = 0.0037, LMM; right, CI from bootstrap analysis: [0.50, 0.92]). G, Left, Comparison of the probability distribution of the MI between HFB amplitude and 0.5-2 Hz phase shows that PV-Cre/NR1f/f mice have significantly more deactivated epochs (30 s) with lower MI (p < 0.0001, CDF inset) and significantly decreased comodulation between HFB amplitude and 0.5-2 Hz phase compared with PV-Cre mice (PV-Cre: 0.0059 ± 0.0014; PV-Cre/NR1f/f: 0.0046 ± 0.0013; F(1,7) = 12.826, p = 0.0090, LMM; right, CI from bootstrap analysis: [0.59, 0.96]). Data are mean ± SEM. A, Lines indicate mean. Shaded areas represent SEM. B (violin plots), Black line indicates median. Dot indicates mice. F, G (violin plots), Solid line indicates mean. Dashed line indicates median. F, G (bootstrap plots), Solid line indicates mean. Dashed line indicates 95% CI. B, Two-tailed unpaired t test was used to assess significance after data passed the Shapiro–Wilk normality test, and Bonferroni adjustment was applied to correct for multiple comparisons. F, G, The Kolmogorov–Smirnov test was used to assess significance between CDFs, and complemented with an LMM and a bootstrap analysis to assess significance between PV-Cre and PV-Cre/NR1f/f mice while accounting for intragroup variability. Complementary statistical information can be found in Extended Data Figure 3-1.
Figure 4.
Figure 4.
Mice with lack of NMDAR activity in PV neurons display altered LFP power during DOWN-to-UP state transitions and reduced duration of UP and DOWN states. A, B, Representative UP state (purple shading) and DOWN state (yellow shading) characteristics in a PV-Cre (gray) and a PV-Cre/NR1f/f (red) mouse, respectively. A, From top to bottom, Raster plot of the recorded single units; the mean firing rate (FR, z-scored) with DOWN states represented with yellow horizontal bars; the raw LFP; spectrogram (0-150 Hz) of the LFP. Mice with intact NMDAR activity in PV neurons (PV-Cre) display typical cyclic transitions between periods of very low/no spiking activity (DOWN states) and high spiking activity (UP states). Mice lacking NMDAR in PV neurons (PV-Cre/NR1f/f mice) display shorter DOWN and UP states than mice with intact NMDAR in PV neurons. In addition, the UP states have increased LFP amplitude, particularly in LFP frequencies >30 Hz, in PV-Cre/NR1f/f mice. B, Top, Representative unfiltered LFP traces (4 s) aligned to an example transition (time = 0 s) from a DOWN state (yellow shading) to an UP state (purple shading) in a PV-Cre and a PV-Cre/NR1f/f mouse, respectively. Bottom, Spectrograms (0-150 Hz) of the LFP traces in the top panels, highlighting the marked power increase in higher frequencies (>30 Hz) during UP states. Mice with lack of NMDAR activity display increased power in higher frequencies (>30 Hz) during both DOWN and UP states. C, Representative Morlet wavelet filtering of the LFP traces in B at different frequency bands. D-J, PV-Cre mice (n = 4, gray) and PV-Cre/NR1f/f mice (n = 3, red). D, Comparison of the PSD of the LFP during the DOWN-to-UP state transition (−2 to 2 s, see H), between PV-Cre versus PV-Cre/NR1f/f mice. Green bars represent frequency bands with significant power difference between PV-Cre and PV-Cre/NR1f/f mice. E-G, Top, Comparison of the relative power in the frequency bands identified in D to hold differential power in PV-Cre versus PV-Cre/NR1f/f mice (E, 0.5-10 Hz; F,G, 30-60 Hz and 100-150 Hz). E, Comparison of the probability distributions of the relative power of the 0.5-10 Hz frequency band shows that PV-Cre/NR1f/f mice have more DOWN-to-UP state transitions with lower power (p < 0.0001, CDF inset) and significantly decreased 0.5-10 Hz power during state transitions compared with PV-Cre mice (PV-Cre: 11.04 ± 2.14; PV-Cre/NR1f/f: 6.76 ± 0.35; Wald χ2 = 12.24, p = 0.0015, GEE; bottom, CI from bootstrap analysis: [0.595, 0.632]). F, Left, Top, Comparison of the probability distributions of the relative power of the 30-60 Hz frequency band shows that PV-Cre/NR1f/f mice have more DOWN states with high power in the 30-60 Hz band (p < 0.0001, CDF inset) and significantly increased power in the 30-60 Hz band during DOWN states compared with PV-Cre (PV-Cre:1.25 × 10⁻⁴ ± 0.15 × 10⁻⁴; PV-Cre/NR1f/f: 1.90 × 10⁻⁴ ± 0.21 × 10⁻⁴; F(1,7) = 198.8, p = 0.0050, LMM; bottom, CI from bootstrap analysis: [1.493, 1.550]). Right, Top, Comparison of the probability distributions of the relative power of the 100-150 Hz frequency band shows that PV-Cre/NR1f/f mice have more DOWN states with high power in the 100-150 Hz band (p < 0.0001, CDF inset) and significantly increased power in 100-150 Hz band during DOWN states compared with PV-Cre (PV-Cre: 1.24 × 10⁻⁴ ± 0.11 × 10⁻⁴; PV-Cre/NR1f/f: 1.83 × 10⁻⁴ ± 0.06 × 10⁻⁴; F(1,7) = 67.072, p = 0.0003, LMM; bottom, CI from bootstrap analysis: [1.458, 1.499]). G, Left, Top, Comparison of the probability distributions of the relative power of the 30-60 Hz frequency band shows that PV-Cre/NR1f/f mice have more UP states with high power in the 30-60 Hz band (p < 0.0001, CDF inset) and significantly increased power in the 30-60 Hz band during UP states compared with PV-Cre mice (PV-Cre: 1.26 × 10⁻⁴ ± 0.16 × 10⁻⁴; PV-Cre/NR1f/f: 2.01 × 10⁻⁴ ± 0.18 × 10⁻⁴; F(1,7) = 197.338, p = 0.0002, LMM; bottom, CI from bootstrap analysis: [1.568, 1.645]). Right, Top, Comparison of the probability distributions of the relative power of the 100-150 Hz frequency band shows that PV-Cre/NR1f/f mice have more UP states with high power in the 100-150 Hz band (p < 0.0001, CDF inset) and significantly increased power in the 100-150 Hz band during UP states compared with PV-Cre mice (PV-Cre: 1.24 × 10⁻⁴ ± 0.14 × 10⁻⁴; PV-Cre/NR1f/f: 1.94 × 10⁻⁴ ± 0.08 × 10⁻⁴; F(1,7) = 77.880, p = 0.0002, LMM; bottom, CI from bootstrap analysis: [1.543, 1.586]). H, Mean transition-triggered LFP traces (4 s) of the DOWN-to-UP state transitions (time = 0 s). I, Left, Comparison of the probability distribution of the state duration of the DOWN states show that PV-Cre/NR1f/f mice have more DOWN states with long duration (p < 0.0001, CDF inset). However, the mean DOWN state duration does not differ (PV-Cre: 0.63 ± 0.06 s; PV-Cre/NR1f/f: 0.69 ± 0.06 s; F(1,7) = 2.367, p = 0.1680, LMM). J, Left, Comparison of the probability distribution of the state duration of the UP states shows that PV-Cre/NR1f/f mice have more UP states with shorter duration (p < 0.0001, CDF inset) and significantly decreased UP state duration compared with PV-Cre mice (PV-Cre: 0.62 ± 0.03; PV-Cre/NR1f/f: 0.45 ± 0.03; F(1,6) = 223.11, p < 0.0001, LMM; right, CI from bootstrap analysis: [0.68, 0.78]). E-G, I, J, The Kolmogorov–Smirnov test was used to assess significance between CDFs, and complemented with an LMM or GEE (in case of non-normality of residuals from LMM model) and a bootstrap analysis to assess significance between PV-Cre and PV-Cre/NR1f/f mice while accounting for intragroup variability. E–G, A Bonferroni adjustment was applied to correct for multiple comparisons. Complementary statistical information can be found in Extended Data Figure 4-1.
Figure 5.
Figure 5.
Mice with lack of NMDAR activity in PV neurons display asynchronous oscillatory activity associated with high firing rate and high-frequency (>30 Hz) power during DOWN and UP states. A–L, PV-Cre (n = 4; gray) and PV-Cre/NR1f/f mice (n = 3; red). A, Left, Comparison of the probability distribution of the spectral entropy of high LFP frequencies (30-150 Hz) shows a significantly different distribution between PV-Cre and PV-Cre/NR1f/f mice (p < 0.0001, CDF; right), with the PV-Cre/NR1f/f mice having more DOWN states with low and high spectral entropy, respectively, compared with PV-Cre mice. However, the mean spectral entropy does not differ (PV-Cre: 5.58 ± 0.08; PV-Cre/NR1f/f: 5.57 ± 0.15; F(1,7) = 0.005, p = 0.9480, LMM). B, Left, Comparison of the probability distribution of the spectral entropy of high LFP frequencies (30-150 Hz) shows a significantly different distribution between PV-Cre and PV-Cre/NR1f/f mice (p < 0.0001, CDF; right), with the PV-Cre/NR1f/f mice having more UP states with low and high spectral entropy, respectively, compared with PV-Cre mice. However, the mean spectral entropy does not differ (PV-Cre: 5.47 ± 0.06; PV-Cre/NR1f/f: 5.57 ± 0.13; F(1,7) = 0.138, p = 0.7220, LMM). C, Left, Comparison of the probability distribution of the HF index (calculated from the power ratio: 200-300 Hz/30-150 Hz) shows a significantly different distribution between PV-Cre and PV-Cre/NR1f/f mice (p < 0.0001, CDF; right), with the PV-Cre/NR1f/f mice having more DOWN states with low and high HF index, respectively, compared with PV-Cre mice. However, the mean HF index does not differ (PV-Cre: 0.076 ± 0.010; PV-Cre/NR1f/f: 0.082 ± 0.022; F(1,7) = 0.490, p = 0.5070, LMM). D, Left, Comparison of the probability distribution of the HF index shows a significantly different distribution between PV-Cre and PV-Cre/NR1f/f mice (p < 0.0001, CDF; right), with the PV-Cre/NR1f/f mice having more UP states with low and high HF index, respectively, compared with PV-Cre mice. However, the mean HF index does not differ (PV-Cre: 0.065 ± 0.001; PV-Cre/NR1f/f: 0.082 ± 0.024; F(1,7) = 0.819, p = 0.3960, LMM). E-J, Projection (as color maps) of the firing rate (E,F), power of 100-150 Hz LFP (G,H), and power of 30-60 Hz LFP (I,J) over spectral entropy (z-scored) versus HF index (z-scored) (PV-Cre: n = 9493; PV-Cre/NR1f/f: n = 5971 DOWN + UP events). The data points (dots) are randomly plotted. Dashed lines indicate 1.96 SD. The high spectral entropy/high HF index events are specifically in PV-Cre/NR1f/f mice associated with high firing rate and high-frequency (>30 Hz) power. E, F, The high spectral entropy/high HF index events in PV-Cre/NR1f/f mice are marked by a high firing rate. G, H, The high spectral entropy/high HF index events in PV-Cre/NR1f/f mice are marked by high 100-150 Hz LFP power. I, J, Low spectral entropy/low HF index in both PV-Cre and PV-Cre/NR1f/f mice are marked by high 30-60 Hz (within γ range) power. However, during UP states, PV-Cre/NR1f/f mice in addition display high spectral entropy/high HF index events marked by increased 30-60 Hz LFP power. K, L, Relationship between high-frequency (>30 Hz) power and the neuronal firing rate in UP state events with low HF index (<1.96 SD, i.e., the upper limit of the 95% CI) (K), and UP states events with high HF index (>1.96 SD) (L). There is a significant and strong positive correlation between the firing rate and the power of both the broadband γ (30-60 Hz; r2 = 0.79, p = 0.0071) and the HFB (100-150 Hz; r2 = 0.81, p = 0.0060) band in the events with HF index (>1.96 SD), but not in the events with low HF index (<1.96 SD). Line indicates linear regression. Dashed line indicates 95% CI. For the CDFs (A–D), the Kolmogorov–Smirnov test was used to assess significance, and complemented with an LMM analysis to assess significance between PV-Cre and PV-Cre/NR1f/f mice while accounting for intragroup variability. K, L, A linear regression was used, and a Pearson correlation coefficient was calculated. Complementary statistical information can be found in Extended Data Figure 5-1.
Figure 6.
Figure 6.
Opto-tagging of ChR2-expressing mPFC PV interneurons. A, Example spiking activity of single units (top; n = 27) and raw LFP (bottom) recorded (20 s) in the mPFC of a PV-Cre mouse injected with AAV-DIO-ChR2-mCherry. Blue light application (blue shading; 3 s, 473 nm, 46 mW/mm2, 3 ms pulses, 40 Hz) modulates the activity of mPFC neurons. B, Mean FR of the neurons in A across 90 trials (9 s peristimulus time-histogram [PSTH]). C, PSTH (9 s) demonstrating increased FR of a light-activated unit in A in response to blue light application. D, PSTH (9 s) demonstrating decreased FR of an mPFC unit in A in response to light activation of local PV interneurons. E-G, Blue light application did not modulate the firing rates in PV-Cre mice injected with AAV-DIO-eYFP. Experimental settings as in A. E, Mean FR of mPFC neurons (n = 28) across 90 trials in an example PV-Cre mouse injected with AAV-DIO-eYFP. H, Spiking activity of the five light-responsive mPFC PV interneurons (PV-Cre + PV-Cre/NR1f/f mice) in response to application of 3 s blue light (blue shading; 473 nm, 46 mW/mm2, 3 ms pulses). Light frequencies used: 8, 16, 24, 32, 40, 48, and 80 Hz. Only trials with mean FR > 0.1 spike/s during baseline (t = −3 to 0 s) are included. I, J, Mean FR of the five light-responsive units in H. All five units showed significantly increased spiking in response to blue light application. K, Average spike waveform of the five light-responsive units in H. Spontaneous (gray) and light-evoked (blue) spike waveforms exhibit very high similarity. r = waveform similarity. *p < 0.05; **p < 0.01; ***p < 0.001; two-tailed paired t test.
Figure 7.
Figure 7.
Units classification based on opto-tagging and spike waveform analysis. A-G, PV-Cre (n = 4; gray) and PV-Cre/NR1f/f mice (n = 3; red). A, Spike waveform features (the mean peak-to-valley amplitude ratio [the ratio between the amplitude of the initial peak and the following trough], and mean half-valley width of the spike waveform) for all individual units (n = 316) recorded in mice injected with AAV-DIO-ChR2-mCherry. The firing rate (FR) variation (represented by color bar) elicited by light application was used to identify light-activated units (n = 5 units). B, For the objective classification of units into WS versus NS, a GMM was fit to the (1) peak-to-valley amplitude ratio and to the (2) half-valley width of the mean spike waveform of the individual units. This identified the NS probability (represented by color bar) for the individual units. C, Classification of WS and NS units after GMM clustering. Units with an NS probability >0.9 were classified as NS (“all NS,” n = 63), and units with an NS probability <0.3 were classified as WS (n = 155). Units with an intermediate NS probability were unclassified (n = 98 units) and not included in further analysis. D, A GMM was fit to the peak (normalized amplitude) of the waveform to identify putative PV interneurons within the NS population. NS units with a mean peak amplitude (normalized) >0.8 were classified as putative PV interneurons (n = 14), and units with mean peak amplitude (normalized) <0.3 were classified as NS interneurons (n = 49). E, Confirmation of the classification of putative PV interneurons by calculation of the spike waveform similarity index (mean correlation between the unit spike waveform and the average spike waveform of the light-activated PV interneurons) for each unit. The putative PV interneurons identified in D (n = 14; red outline) exhibit very high spike waveform similarity (r > 0.95) with light-activated PV interneurons (n = 5; black outline). F, Mean normalized spike waveforms for the classified cell types. WS neurons (n = 155 units), putative PV interneurons (n = 14 units), NS interneurons (n = 49 units), and light-activated PV interneurons (n = 5 units). G, Mean normalized spike waveforms for the classified WS (left), putative PV (middle), and NS (right) units.
Figure 8.
Figure 8.
Mice with lack of NMDAR activity in PV neurons display altered temporal dynamics of single-unit activity during DOWN-to-UP state transitions. A–I, PV-Cre (n = 4; gray) and PV-Cre/NR1f/f mice (n = 3; red). A, Firing rate (FR) dynamics of WS neurons during DOWN-to-UP state transition (−500 to 500 ms, 0 ms = transition [dashed line]). PV-Cre (gray; n = 65 units) and PV-Cre/NR1f/f mice (red; n = 89 units). Top, PETH showing mean FR (z-scored) of single WS units. Units are sorted according to their mean FR (z-scored) during the UP state (0-500 ms). Bottom, Mean FR (z-scored) for all WS units. B, C, Firing properties of WS neurons during DOWN-to-UP state transition (−500 to 500 ms). B, The WS FR (z-scored) is significantly higher in PV-Cre/NR1f/f mice than in PV-Cre mice during DOWN states. DOWN: PV-Cre: −0.95; PV-Cre/NR1f/f: −0.74; t = 4.575, p <0.0001; UP: PV-Cre: 1.17; PV-Cre/NR1f/f: 1.01; t = 0.7078, p = 0.4802. C, Left, FWHM of the mean firing curve of individual WS neurons showing significantly increased spike time variability of WS in PV-Cre/NR1f/f mice compared with in PV-Cre mice. Right, Peak latency of the spiking of individual WS neurons. FWHM: PV-Cre: 100.9 ms; PV-Cre/NR1f/f: 130.9 ms; U = 1972, p = 0.0007; peak latency: PV-Cre: 215 ms; PV-Cre/NR1f/f: 235 ms; U = 2391, p = 0.0661. D-F, Same as in A–C, but for PV interneurons. PV-Cre (gray; n = 6 units) and PV-Cre/NR1f/f mice (red; n = 10 units). E, The PV FR (z-scored) during DOWN (left) and UP states (right). DOWN: PV-Cre: −0.87; PV-Cre/NR1f/f: −0.41; U = 18, p = 0.2198; UP: PV-Cre: 1.10; PV-Cre/NR1f/f: 0.81; U = 20, p = 0.3132. F, Left, FWHM of the mean firing curve of individual PV interneurons. Right, The peak latency of the spiking of individual PV interneurons is significantly increased in PV-Cre/NR1f/f mice compared with that in PV-Cre mice. FWHM: PV-Cre: 133.2 ms; PV-Cre/NR1f/f: 106.3 ms; U = 20, p = 0.3132; peak latency: PV-Cre: 202.5 ms; PV-Cre/NR1f/f: 262.5 ms; U = 3, p = 0.0016. G-I, Same as in A–C, but for NS putative interneurons. PV-Cre (gray; n = 29 units) and PV-Cre/NR1f/f mice (red; n = 20 units). H, The NS FR (z-scored) during DOWN (left) and UP states (right). DOWN: PV-Cre: −0.55; PV-Cre/NR1f/f: −0.48; t = 1.452, p = 0.1532; UP: PV-Cre: 0.74; PV-Cre/NR1f/f: 0.61; t = 1.06, p = 0.2944. I, Left, FWHM of the mean firing curve of individual NS interneurons. Right, Peak latency of the spiking of individual NS interneurons. FWHM: PV-Cre: 102.8 ms; PV-Cre/NR1f/f: 126.5 ms; U = 244, p = 0.3581; peak latency: PV-Cre: 220 ms; PV-Cre/NR1f/f: 237 ms; U = 271, p = 0.7052. A, D, G, Data are mean ± SEM (shaded area). Violin plots: Black line indicates median. Dots indicate individual neurons. Two-tailed unpaired t test was used to assess significance if data passed the D'Agostino & Pearson normality test; if not, the Mann–Whitney test was used. Descriptive statistics for individual mice can be found in Extended Data Figure 8-1.
Figure 9.
Figure 9.
Distinct spectral characteristics of the LFP induced by ketamine. A, Representative unfiltered mPFC LFP traces (60 min) from a PV-Cre (top) and a PV-Cre/NR1f/f (bottom) mouse recorded under urethane anesthesia. Ketamine (KET) was locally applied at t = 0 (dashed line). In PV-Cre mice, ketamine application switched the LFP oscillations from predominantly low frequencies of high amplitude to higher frequencies of low amplitude. In contrast, ketamine application did not cause any major changes in the mPFC LFP oscillations in PV-Cre/NR1f/f mice. B, C, F, G, J, K, PV-Cre (n = 3; gray) and PV-Cre/NR1f/f mice (n = 3; red). B, Mean PSD of the LFP during baseline (−30 to 0 min), 0-15 min, and 15-30 min after ketamine application. C, Ketamine induced power change (from baseline) in different frequency bands (−30 to 0 vs 0-30 min). Ketamine application decreased the power in the low-δ band (0.5-1.5 Hz) and increased the power in the β (12-30 Hz), broadband γ (30-80 Hz), and HFB (100-150 Hz) to a significantly larger extent in PV-Cre than PV-Cre/NR1f/f mice. Low-δ: PV-Cre: −45.22%; PV-Cre/NR1f/f: −12.49%; U = 1185, p = 0.0005; high-δ: PV-Cre: 18.40%; PV-Cre/NR1f/f: 17.10%; U = 3980 p = 1; theta: PV-Cre: 22.5%; PV-Cre/NR1f/f: 17.20%; U = 4001, p = 1; β: PV-Cre: 98.3%; PV-Cre/NR1f/f: 15%; U = 3030, p = 0.0200; broadband γ: PV-Cre: 408.2%; PV-Cre/NR1f/f: 24%; U = 827, p = 0.0005; HFB: PV-Cre: 251.4%; PV-Cre/NR1f/f: 21.2%; U = 1054, p = 0.0005. D, Evolution of the autocorrelograms of the LFP traces in A through time (60 min), before (−30 to 0 min), and after (0-30 min) ketamine application (t = 0; white line). Color bar represents the LFP autocorrelation coefficients. Ketamine lowers the LFP autocorrelation in PV-Cre mice, indicating desynchronized LFP oscillations, while the LFP in PV-Cre/NR1f/f mice at large does not change. E-G, Direct comparison of LFP activities after ketamine application between PV-Cre mice and PV-Cre/NR1f/f mice. E, Top, 15 s of the unfiltered LFP traces in A after ketamine application. Bottom, Spectrograms (0-150 Hz) of the LFP traces, color bar represents LFP power. Ketamine application triggered a state with persistent high-frequency (>30 Hz) activity of low amplitude in the LFP oscillations in PV-Cre mice, while the low-frequency activity of high amplitude remained in PV-Cre/NR1f/f mice after ketamine application (see also D). F, Mean PSD (0-150 Hz) of the LFP after ketamine application (0-30 min), demonstrating decreased power in lower frequencies and increased power in higher frequencies in PV-Cre, but not PV-Cre/NR1f/f mice. G, Power of the different frequency bands after ketamine application (0-30 min). PV-Cre mice display significantly higher power in most frequency bands compared with PV-Cre/NR1f/f mice but significantly lower power in the low-δ (0.5-1.5 Hz) band. Low-δ: PV-Cre: 0.27 ± 0.06; PV-Cre/NR1f/f: 0.48 ± 0.03; F(1,6) = 15.540, p = 0.0462; high-δ: PV-Cre: 0.053 ± 0.032; PV-Cre/NR1f/f: 0.038 ± 0.004; Wald χ2 = 6.43, p = 0.0673; theta: PV-Cre: 0.043 ± 0.019; PV-Cre/NR1f/f: 0.032 ± 0.011; Wald χ2 = 6.43, p = 1; β: PV-Cre: 0.0104 ± 0.0027; PV-Cre/NR1f/f: 0.0068 ± 0.0040; F(1,6) = 0.182, p = 1; broadband γ: PV-Cre: 0.0336 ± 0.0194; PV-Cre/NR1f/f: 0.0068 ± 0.0011; Wald χ2 = 13.354, p = 0.0015; HFB: PV-Cre: 0.0018 ± 0.0001; PV-Cre/NR1f/f: 0.0007 ± 0.0003; Wald χ2 = 17.359, p = 0.0002. H-K, Phase amplitude comodulation after ketamine application (0-30 min). H, Representative unfiltered LFP traces (top), filtered 0.5-2 Hz (middle), and broadband γ (30-80 Hz; bottom). I, Representative phase-amplitude comodulograms of a PV-Cre (left) and a PV-Cre/NR1f/f mouse (right) after ketamine application (0-30 min). Ketamine decreases the modulation of broadband γ amplitude by the 0.5-2 Hz phase in PV-Cre, but not in PV-Cre/NR1f/f mice. Color bar represents the MI. J, Mean broadband γ (30-80 Hz) amplitude at different phases of the 0.5-2 Hz cycles after ketamine application (0-30 min). K, Left, Comparison of the probability distribution of the MI between broadband γ (30-80 Hz) amplitude and the 0.5-2 Hz phase after ketamine application (0-30 min) shows that most epochs (30 s) in PV-Cre mice have minimal MI (p < 0.0001, CDF inset) and the PV-Cre mice have significantly decreased comodulation between broadband γ amplitude and 0.5-2 Hz phase compared with PV-Cre/NR1f/f mice (PV-Cre: 0.0009 ± 0.0001; PV-Cre/NR1f/f: 0.0100 ± 0.0023; Wald χ2 = 195.638, p < 0.00001, LMM; right, CI from bootstrap analysis: [8.77, 15.29]). C, G, Black lines indicate median. Dots indicate 30 s epochs. Dashed line indicates baseline. K (violin plots), Solid line indicates mean. Dashed line indicates median. K (bootstrap plot), Solid line indicates mean. Dashed line indicates 95% CI. Two-tailed unpaired t test was used to assess significance if data passed the D'Agostino & Pearson normality test; if not, the Mann–Whitney test was used. The Kolmogorov–Smirnov test was used to assess significance between CDFs, and complemented with an LMM and a bootstrap analysis to assess significance between PV-Cre and PV-Cre/NR1f/f mice while accounting for intragroup variability. Complementary statistical information can be found in Extended Data Figure 9-1.
Figure 10.
Figure 10.
Firing patterns and spike-LFP entrainment during baseline and after ketamine application. A, B, Representative (1 s) single-unit activity (top), filtered LFP in the 30-80 Hz band (middle), and raw LFP traces (bottom) for a PV-Cre (A) and a PV-Cre/NR1f/f mouse (B) after ketamine application. C, D, F, G, PV-Cre (n = 3; gray) and PV-Cre/NR1f/f mice (n = 3; red). C, FR properties of WS neurons (PV-Cre: n = 17 units; PV-Cre/NR1f/f: n = 69 units) after ketamine application (0-30 min). Left, The FR of WS neurons is significantly higher in PV-Cre mice than in PV-Cre/NR1f/f mice. Right, The CV of the ISI does not differ between PV-Cre and PV-Cre/NR1f/f mice. FR: PV-Cre: 3.28; PV-Cre/NR1f/f: 1.52; U = 189, p < 0.0001; CV: PV-Cre: 1.03; PV-Cre/NR1f/f: 0.97; U = 547, p = 0.6751. D, FR properties of NS+PV putative interneurons (PV-Cre: n = 10 units; PV-Cre/NR1f/f: n = 17 units) after ketamine application (0-30 min). Left, The FR of NS+PV interneurons is significantly higher in PV-Cre mice than in PV-Cre/NR1f/f mice after ketamine application. Right, The CV of the ISI does not differ between PV-Cre and PV-Cre/NR1f/f mice. FR: PV-Cre: 5.27; PV-Cre/NR1f/f: 1.56; U = 38, p = 0.0175; CV: PV-Cre: 1.05; PV-Cre/NR1f/f: 0.95; U = 64 p = 0.3093. E, Histograms of the spike modulation by broadband γ (30-80 Hz) phase. Four representative single neurons: light green represents nonmodulated WS; green represents modulated WS; light pink represents nonmodulated PV; pink represents modulated PV. F, G, Spike-LFP entrainment in PV-Cre (left) and PV-Cre/NR1f/f (middle) mice during baseline (−30 to 0 min) (F) and after ketamine application (0-30 min) (G). F, The proportion of neurons significantly (p < 0.01) modulated by different LFP frequencies (21-242 Hz; log scale). The spiking in PV-Cre mice is predominantly modulated by higher frequencies, and in PV-Cre/NR1f/f mice by lower frequencies. WS (green): PV-Cre: n = 22 units; PV-Cre/NR1f/f: n = 90 units; NS (blue): PV-Cre: n = 7 units; PV-Cre/NR1f/f: n = 12 units; PV (pink): PV-Cre: n = 3 units; PV-Cre/NR1f/f: n = 5 units. Right, Difference in the proportion of neurons (WS + NS + PV) significantly (p < 0.01) modulated by different LFP frequencies (21-242 Hz) between PV-Cre and PV-Cre/NR1f/f mice. The modulation of spiking by higher LFP frequencies is significantly stronger in PV-Cre than in PV-Cre/NR1f/f mice. G, Ketamine shifts the modulation of spiking in PV-Cre mice to higher LFP frequencies (>200 Hz) while the spiking in PV-Cre/NR1f/f mice at large is not affected. Right, After ketamine application, the modulation of frequencies >200 Hz is significantly stronger in PV-Cre than in PV-Cre/NR1f/f mice. C, D, Black line indicates median. Dots indicate individual neurons. F, G, Bars are stacked. Two-tailed unpaired t test was used to assess significance if data passed the D'Agostino & Pearson normality test; if not, the Mann–Whitney test was used. Complementary statistical information can be found in Extended Data Figure 10-1.

Similar articles

Cited by

References

    1. Ährlund-Richter S, Xuan Y, van Lunteren JA, Kim H, Ortiz C, Pollak Dorocic I, Meletis K, Carlén M (2019) A whole-brain atlas of monosynaptic input targeting four different cell types in the medial prefrontal cortex of the mouse. Nat Neurosci 22:657–668. 10.1038/s41593-019-0354-y - DOI - PubMed
    1. Bakker R, Tiesinga P, Kötter R (2015) The scalable brain atlas: instant web-based access to public brain atlases and related content. Neuroinformatics 13:353–366. 10.1007/s12021-014-9258-x - DOI - PMC - PubMed
    1. Bartoli E, Bosking W, Chen Y, Li Y, Sheth SA, Beauchamp MS, Yoshor D, Foster BL (2019) Functionally distinct gamma range activity revealed by stimulus tuning in human visual cortex. Curr Biol 29:3345–3358.e7. 10.1016/j.cub.2019.08.004 - DOI - PMC - PubMed
    1. Belluscio MA, Mizuseki K, Schmidt R, Kempter R, Buzsáki G (2012) Cross-frequency phase-phase coupling between theta and gamma oscillations in the hippocampus. J Neurosci 32:423–435. 10.1523/JNEUROSCI.4122-11.2012 - DOI - PMC - PubMed
    1. Billingslea EN, Tatard-Leitman VM, Anguiano J, Jutzeler CR, Suh J, Saunders JA, Morita S, Featherstone RE, Ortinski PI, Gandal MJ, Lin R, Liang Y, Gur RE, Carlson GC, Hahn CG, Siegel SJ (2014) Parvalbumin cell ablation of NMDA-R1 causes increased resting network excitability with associated social and self-care deficits. Neuropsychopharmacology 39:1603–1613. 10.1038/npp.2014.7 - DOI - PMC - PubMed

Publication types

Substances

LinkOut - more resources