Nonlinear convergence boosts information coding in circuits with parallel outputs
- PMID: 33593894
- PMCID: PMC7923546
- DOI: 10.1073/pnas.1921882118
Nonlinear convergence boosts information coding in circuits with parallel outputs
Abstract
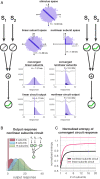
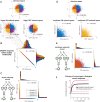
Neural circuits are structured with layers of converging and diverging connectivity and selectivity-inducing nonlinearities at neurons and synapses. These components have the potential to hamper an accurate encoding of the circuit inputs. Past computational studies have optimized the nonlinearities of single neurons, or connection weights in networks, to maximize encoded information, but have not grappled with the simultaneous impact of convergent circuit structure and nonlinear response functions for efficient coding. Our approach is to compare model circuits with different combinations of convergence, divergence, and nonlinear neurons to discover how interactions between these components affect coding efficiency. We find that a convergent circuit with divergent parallel pathways can encode more information with nonlinear subunits than with linear subunits, despite the compressive loss induced by the convergence and the nonlinearities when considered separately.
Keywords: efficient coding; information theory; neural computation; retina; sensory processing.
Conflict of interest statement
The authors declare no competing interest.
Figures


Similar articles
-
Crossover inhibition in the retina: circuitry that compensates for nonlinear rectifying synaptic transmission.J Comput Neurosci. 2009 Dec;27(3):569-90. doi: 10.1007/s10827-009-0170-6. Epub 2009 Jul 28. J Comput Neurosci. 2009. PMID: 19636690 Free PMC article.
-
Information processing in the primate retina: circuitry and coding.Annu Rev Neurosci. 2007;30:1-30. doi: 10.1146/annurev.neuro.30.051606.094252. Annu Rev Neurosci. 2007. PMID: 17335403 Review.
-
Theoretical considerations of local neuron circuits and their triadic synaptic arrangements (TSA) in subcortical sensory nuclei.J Neurosci Res. 1977;3(1):1-10. doi: 10.1002/jnr.490030102. J Neurosci Res. 1977. PMID: 202723
-
Neural Information Processing and Computations of Two-Input Synapses.Neural Comput. 2022 Sep 12;34(10):2102-2131. doi: 10.1162/neco_a_01534. Neural Comput. 2022. PMID: 36027799
-
Parallel processing in the mammalian retina.Nat Rev Neurosci. 2004 Oct;5(10):747-57. doi: 10.1038/nrn1497. Nat Rev Neurosci. 2004. PMID: 15378035 Review.
Cited by
-
Efficient population coding depends on stimulus convergence and source of noise.PLoS Comput Biol. 2021 Apr 26;17(4):e1008897. doi: 10.1371/journal.pcbi.1008897. eCollection 2021 Apr. PLoS Comput Biol. 2021. PMID: 33901195 Free PMC article.
-
Inducible Pluripotent Stem Cells to Model and Treat Inherited Degenerative Diseases of the Outer Retina: 3D-Organoids Limitations and Bioengineering Solutions.Cells. 2021 Sep 20;10(9):2489. doi: 10.3390/cells10092489. Cells. 2021. PMID: 34572137 Free PMC article. Review.
-
Temporal resolution of spike coding in feedforward networks with signal convergence and divergence.bioRxiv [Preprint]. 2024 Oct 28:2024.07.08.602598. doi: 10.1101/2024.07.08.602598. bioRxiv. 2024. Update in: PLoS Comput Biol. 2025 Apr 21;21(4):e1012971. doi: 10.1371/journal.pcbi.1012971. PMID: 39026834 Free PMC article. Updated. Preprint.
-
Brains are Probabilistic, Electrophysiologically Intricate and Triune: A Biased- Random Walk Perspective on Computational Neuroscience.Int J Psychol Res (Medellin). 2024 Aug 21;17(2):100-112. doi: 10.21500/20112084.7397. eCollection 2024 Jul-Dec. Int J Psychol Res (Medellin). 2024. PMID: 39927244 Free PMC article.
-
Temporal resolution of spike coding in feedforward networks with signal convergence and divergence.PLoS Comput Biol. 2025 Apr 21;21(4):e1012971. doi: 10.1371/journal.pcbi.1012971. eCollection 2025 Apr. PLoS Comput Biol. 2025. PMID: 40258062 Free PMC article.
References
-
- Zhaoping L., Theoretical understanding of the early visual processes by data compression and data selection. Netw. Comput. Neural Syst. 17, 301–334 (2006). - PubMed
-
- Nirenberg S., Carcieri S. M., Jacobs A. L., Latham P. E., Retinal ganglion cells act largely as independent encoders. Nature 411, 698–701 (2001). - PubMed
-
- Koch K., et al. , Efficiency of information transmission by retinal ganglion cells. Curr. Biol. 14, 1523–1530 (2004). - PubMed
Publication types
MeSH terms
Grants and funding
LinkOut - more resources
Full Text Sources
Other Literature Sources
Miscellaneous

