. 2021 Feb 23;118(8):e2011585118.
doi: 10.1073/pnas.2011585118.

Climate control on terrestrial biospheric carbon turnover

Affiliations

Climate control on terrestrial biospheric carbon turnover

Timothy I Eglinton et al. Proc Natl Acad Sci U S A. .

Abstract

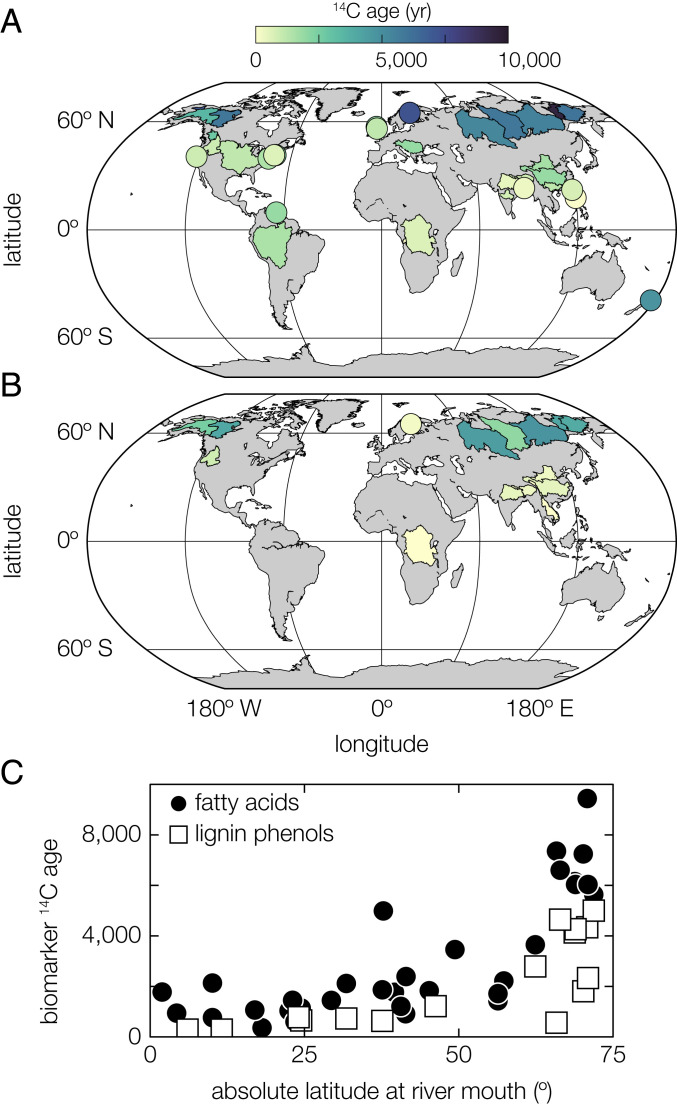
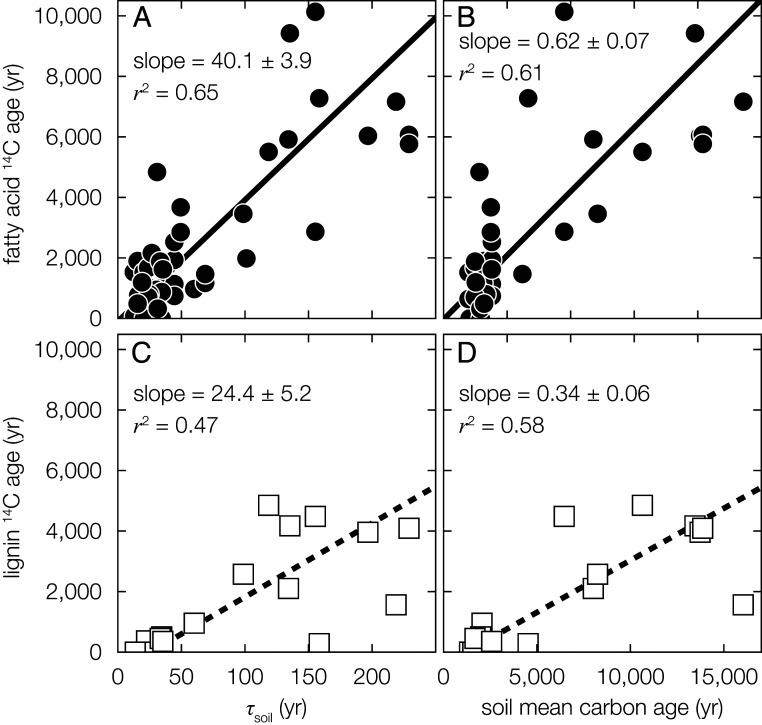
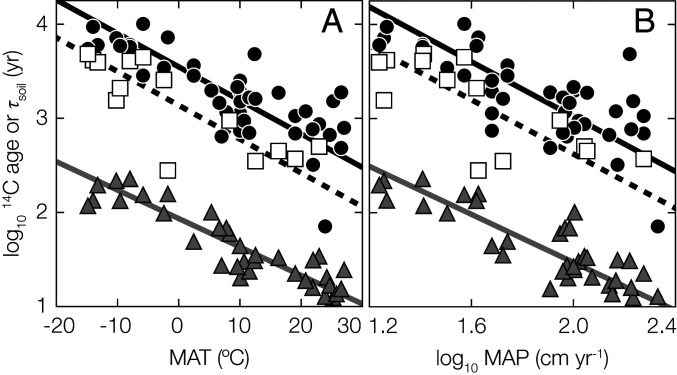
Terrestrial vegetation and soils hold three times more carbon than the atmosphere. Much debate concerns how anthropogenic activity will perturb these surface reservoirs, potentially exacerbating ongoing changes to the climate system. Uncertainties specifically persist in extrapolating point-source observations to ecosystem-scale budgets and fluxes, which require consideration of vertical and lateral processes on multiple temporal and spatial scales. To explore controls on organic carbon (OC) turnover at the river basin scale, we present radiocarbon (14C) ages on two groups of molecular tracers of plant-derived carbon-leaf-wax lipids and lignin phenols-from a globally distributed suite of rivers. We find significant negative relationships between the 14C age of these biomarkers and mean annual temperature and precipitation. Moreover, riverine biospheric-carbon ages scale proportionally with basin-wide soil carbon turnover times and soil 14C ages, implicating OC cycling within soils as a primary control on exported biomarker ages and revealing a broad distribution of soil OC reactivities. The ubiquitous occurrence of a long-lived soil OC pool suggests soil OC is globally vulnerable to perturbations by future temperature and precipitation increase. Scaling of riverine biospheric-carbon ages with soil OC turnover shows the former can constrain the sensitivity of carbon dynamics to environmental controls on broad spatial scales. Extracting this information from fluvially dominated sedimentary sequences may inform past variations in soil OC turnover in response to anthropogenic and/or climate perturbations. In turn, monitoring riverine OC composition may help detect future climate-change-induced perturbations of soil OC turnover and stocks.

Keywords: carbon cycle; carbon turnover times; fluvial carbon; plant biomarkers; radiocarbon.


Conflict of interest statement

The authors declare no competing interest.

Figures

Fig. 1.
Fig. 1.
Riverine biomarker 14C ages. The catchment areas of all rivers analyzed in this study are color coded by (A) plant-wax fatty-acid and (B) lignin-phenol 14C ages (SI Appendix, Table S1). Rivers with catchment areas smaller than 30,000 km2 are shown as colored circles for clarity. The legend above (A) applies to both panels. (C) Biomarker ages as a function of the absolute latitude at the river mouth, showing both fatty acids (black circles) and lignin phenols (white squares).
Fig. 2.
Fig. 2.
Multivariate statistical analysis. (A) Matrix of Pearson correlation coefficients (r values) between environmental control variables (x-axis) and POC and biomarker 14C and δ13C responses (y-axis) (SI Appendix, Table S4). Box sizes and colors correspond to the strength of the correlation (sizes: magnitude only; colors: magnitude and sign). Correlations that are significant at the P = 0.05 level are outlined with a thick, black border. “Sample type” refers to the following: suspended sediment, bank/bedload sediment, or shelf-deposit sediment. (B) RDA triplot showing the RDA1 and RDA2 canonical axes (SI Appendix, Table S5); labels show the percent of total sample variance explained by each axis. Environmental control variable loadings are plotted as gray arrows, POC and biomarker 14C and δ13C response variable loadings are plotted as red arrows, and individual sample scores are plotted as black circles. Environmental and response variable loadings are scaled for visual clarity. Numbers and roman numerals correspond to control and response variables, respectively, as listed in (A). Only control variables that are statistically significantly correlated with at least one response variable are included in the analysis (SI Appendix, Table S4). TSS, total suspended sediment; POC, particulate organic carbon; CV, coefficient of variation; cont. perm., continuous permafrost cover; discont. perm., discontinuous permafrost cover; MAP, mean annual precipitation; NPP, net primary production.
Fig. 3.
Fig. 3.
Relationships between τsoil, soil mean carbon age, and biomarker 14C age. (A and B) Plant-wax fatty-acid and (C and D) lignin-phenol 14C ages as a function of weighted-catchment τsoil (Left, ref. 5), and soil mean carbon age (0 to 100 cm, Right, ref. 34). Solid and dashed black lines are reduced major-axis regression lines; reported values are the corresponding reduced major-axis regression slopes and r2 values (Materials and Methods). Uncertainty (±1σ) is always smaller than marker points.
Fig. 4.
Fig. 4.
Environmental controls on τsoil and biomarker 14C ages. Logarithmic plant-wax fatty-acid 14C ages (black circles), lignin-phenol 14C ages (white squares), and catchment τsoil [gray triangles (5)] as functions of (A) MAT and (B) logarithmic MAP (SI Appendix, Tables S1 and S3). Solid black, dashed black, and gray lines are fatty-acid–, lignin-phenol–, and τsoil-reduced major-axis regression lines. Relationship slopes and r2 values are as follows: (A) fatty-acid 14C ages: slope = −0.036 ± 0.004, r2 = 0.62; lignin-phenol 14C ages: slope = −0.036 ± 0.006, r2 = 0.67; and τsoil: slope = −0.030 ± 0.002, r2 = 0.83. (B) Fatty-acid 14C ages: slope = −1.46 ± 0.17, r2 = 0.55; lignin-phenol 14C ages: slope = −1.44 ± 0.30, r2 = 0.56; and τsoil: slope = −1.13 ± 0.11, r2 = 0.72. Uncertainty (±1σ) is always smaller than marker points.

Similar articles

Cited by

References

    1. Friedlingstein P., et al. ., Global carbon budget 2019. Earth Syst. Sci. Data 11, 1783–1838 (2019).
    1. Sulman B. N., et al. ., Multiple models and experiments underscore large uncertainty in soil carbon dynamics. Biogeochem. 141, 109–123 (2018).
    1. Jones C., et al. ., Twenty-first-century compatible CO2 emissions and airborne fraction simulated by CMIP5 earth system models under four representative concentration pathways. J. Clim. 26, 4398–4413 (2013).
    1. Carvalhais N., et al. ., Global covariation of carbon turnover times with climate in terrestrial ecosystems. Nature 514, 213–217 (2014). - PubMed
    1. Bloom A. A., Exbrayat J. F., van der Velde I. R., Feng L., Williams M., The decadal state of the terrestrial carbon cycle: Global retrievals of terrestrial carbon allocation, pools, and residence times. Proc. Natl. Acad. Sci. U.S.A. 113, 1285–1290 (2016). - PMC - PubMed

Publication types

LinkOut - more resources