. 2021 Feb 23;118(8):e2014926118.
doi: 10.1073/pnas.2014926118.

Competitive binding of independent extension and retraction motors explains the quantitative dynamics of type IV pili

Affiliations

Competitive binding of independent extension and retraction motors explains the quantitative dynamics of type IV pili

Matthias D Koch et al. Proc Natl Acad Sci U S A. .

Abstract

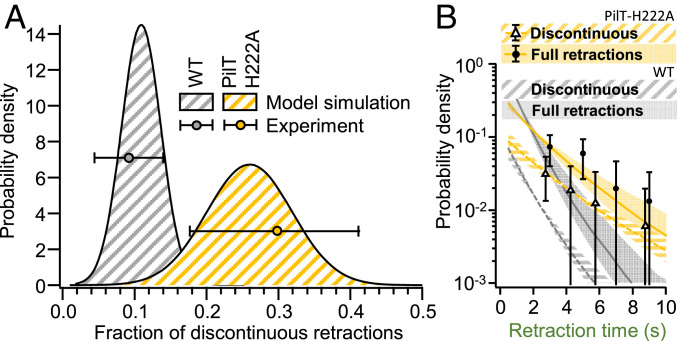
Type IV pili (TFP) function through cycles of extension and retraction. The coordination of these cycles remains mysterious due to a lack of quantitative measurements of multiple features of TFP dynamics. Here, we fluorescently label TFP in the pathogen Pseudomonas aeruginosa and track full extension and retraction cycles of individual filaments. Polymerization and depolymerization dynamics are stochastic; TFP are made at random times and extend, pause, and retract for random lengths of time. TFP can also pause for extended periods between two extension or two retraction events in both wild-type cells and a slowly retracting PilT mutant. We developed a biophysical model based on the stochastic binding of two dedicated extension and retraction motors to the same pilus machine that predicts the observed features of the data with no free parameters. We show that only a model in which both motors stochastically bind and unbind to the pilus machine independent of the piliation state of the machine quantitatively explains the experimentally observed pilus production rate. In experimental support of this model, we show that the abundance of the retraction motor dictates the pilus production rate and that PilT is bound to pilus machines even in their unpiliated state. Together, the strong quantitative agreement of our model with a variety of experiments suggests that the entire repetitive cycle of pilus extension and retraction is coordinated by the competition of stochastic motor binding to the pilus machine, and that the retraction motor is the major throttle for pilus production.

Keywords: competitive binding; molecular motor; pilus dynamics; type IV pili.


Conflict of interest statement

The authors declare no competing interest.

Figures

Fig. 1.
Fig. 1.
The quantitative measurement of pilus dynamics using Alexa488 coupled to thiol-reactive maleimide and the PilA-A86C Cysteine knock-in mutant on an agarose pad. (A) The movie frames showing the extension and retraction of a long pilus (white arrow, Lp = 5 μm). (Scale bar, 2 μm.) (B) The movie frames showing the typical extension and retraction of several short pili (white arrows, Lp ≤ 1 μm). (Scale bar, 2 μm.) (C) The comparison of the fraction of cells in a single image that have at least one pilus when analyzed in just a single frame (static) or a movie (dynamic) of 30 s in length. The boxes represent the median and 25%/75% quantiles. (D) The distribution of pilus production rate per cell (markers) and exponential fit (line). The error bars are the SD obtained by bootstrapping. (E) The distribution of the maximum extension lengths of individual pili. The error bars are the SD obtained by bootstrapping. Gray shaded area: 95% CI from model simulation for comparison (MCS, see below and Materials and Methods). No significant difference between the distributions of the simulations and experiments (P > 0.05) was found. (F) The pilus extension and retraction velocity. The boxes represent the median and 25%/75% quantiles.
Fig. 2.
Fig. 2.
Pilus retraction does not require mechanical stimulation. (A) A schematic of surface-contact–free (“liquid-trapped”) assay: single cells are held about 5 μm above the surface and aligned with the focal plane by line-scanning optical tweezers. (B) The image sequence of an individual pilus extending and retracting without surface contact (also see Movie S10). (C) A time trace of pilus length for seven individual pili (roman numerals) extending and retracting from the same pole of the same cell without surface contact. (D) The fraction of retracting pili for cells with and without surface contact. (E) The dwell times between stop of extension and start of retraction of individual pili for cells with and without surface contact. (F) The maximum length of individual pili for cells with and without surface contact. (E and F) No significant difference between the distribution of the simulations and experiments (P > 0.05) was found. See Materials and Methods for details of the statistical testing. (See SI Appendix, Table S4 for sample sizes and number of replicates).
Fig. 3.
Fig. 3.
Competitive substrate binding model predicts rare multistep extension and retraction events with short intervening stalls. (A) The model schematic. The extension motor (Ext, purple) and retraction motor (Ret, green) bind with probability P(Ext, on) and P(Ret, on), respectively. (I) and (II) denote, respectively, unpiliated and piliated pilus machine without bound extension or retraction motor. (B) A time trace of pilus length for a typical pilus extension/retraction event: extension time Text, dwell time Td, and retraction time Tret. (C) A time trace of pilus length for a discontinuous extension event. (D) A time trace of pilus length for a discontinuous retraction event. B–D Also see SI Appendix, Fig. S2 and Movies S3–S5. (E) A Histogram of extension times of individual pili. (F) A Histogram of dwell times between stop of pilus extension and start of the subsequent pilus retraction. (G) A Histogram of the time individual pili spent retracting (full retractions are limited by the length of pili). (EG) The error bars are the SD obtained by bootstrapping. The shaded areas are 95% CIs from model simulations (MCS, see SI Appendix, Materials and Methods). No significant difference between simulations and experiments (P > 0.05) was found. See SI Appendix, Materials and Methods for details of the statistical testing. (See SI Appendix, Table S4 for sample sizes and number of replicates).
Fig. 4.
Fig. 4.
The increase of the fraction of discontinuous retractions for the slowly retracting mutant PilT-H222A is accurately predicted by the model. (A) The fraction of discontinuous retractions increases about threefold from WT to PilT-H222A. The shaded areas indicate distributions of the fraction of discontinuous retraction events obtained by simulation. The markers indicate the experimentally obtained fraction of discontinuous retractions with SD obtained by bootstrapping. No significant difference between simulations and experiments (P > 0.05) was found. (B) The distribution of retraction times of individual pili for PilT-H222A (yellow = model prediction, markers = experimental data) and WT (gray) for comparison. The error bars are the SD obtained by bootstrapping. The shaded areas are 95% CIs from model simulation ([MCS], see Materials and Methods). No significant difference between simulations and experiments (P > 0.05) was found. (See SI Appendix, Table S4 for sample sizes and number of replicates).
Fig. 5.
Fig. 5.
Comparison of the pilus production rate predicted by different models for the switch between extension and restriction. (A) An example of Monte Carlo simulation for binding and unbinding of the extension and retraction motor showing a single pilus extension event. Note that the retraction motor stays attached after the pilus is retracted fully. (B) The maximum projection of 60 superresolved movie frames recorded at 1 Hz frame rate showing directions of all pili that have been extended by the cell. The roman numerals label individual pilus machines. The thick, transparent curve represents the line scan area used to analyze pili. (C) A distribution of the pilus production rate per machine. The experimental data are shown as black markers with error bars. The Monte Carlo simulations are shown for the stochastic model (Model 1, gray), the pilus-dependent model (Model 2, pink), and the pilus-sensing model (Model 3, blue). The error bars are the SD obtained by bootstrapping. The shaded areas are 95% CIs from model simulation (MCS, see Materials and Methods), and bold lines are their means. (See SI Appendix, Table S4 for sample sizes and number of replicates).
Fig. 6.
Fig. 6.
Overexpression of the retraction motor PilT limits pilus production but not pilus length. (A) The fraction of cells that make pili and (B) the maximum length of individual pili as a function of arabinose induction. PilT was induced ectopically from a high-copy number plasmid under control of the arabinose promoter Pbad. The native copy of PilT was inactivated by a transposon insertion. The boxplots represent the median and 25%/75% quantiles. (ns): not significant, P > 0.05. (***) P < 0.001. See Materials and Methods for details of the statistical testing. (See SI Appendix, Table S4 for sample sizes and number of replicates).
Fig. 7.
Fig. 7.
PilT localizes to poles with active pilus dynamics even in the absence of pili. (A) N-terminally tagged mRuby3-PilT localizes to most poles of P. aeruginosa. An overlay of phase image and red fluorescence channel (mRuby3). (B) Simultaneous imaging of PilT localization (Left, integrated projection) and pilus activity (Right, maximum projection) shows that active poles with pili (filled triangle) localize PilT while inactive poles without pili (open triangle) do not. (C) The quantification of PilT localization using a line scan through the long axis of the cell. (D) The relative brightness of the cell pole with respect to the cytoplasm for active and inactive poles, comparing only times when no pilus is present at the active pole. The boxplots represent the median and 25%/75% quantiles. (E) The C-terminally tagged PilO-Cherry localizes to the poles of P. aeruginosa. (F) An overlay of PilO localization (red) and pilus activity (green, maximum projection). The white arrows point to extended pili. (G) The fraction of poles that localize PilO and that make dynamic pili. The boxplots represent the median and 25%/75% quantiles. (H) The consecutive time-lapse images (every 1 s) of PilT (red) and pilus activity (green). PilT localized (red arrow) to the piliated pole immediately before the pilus started retracting (between frame two and three) and remained bound after the pilus was fully retracted (frames five and six). The color channels were acquired sequentially: first green, then red. (All scale bars are 2 μm.) (See SI Appendix, Table S4 for sample sizes and number of replicates).

Similar articles

Cited by

References

    1. Denise R., Abby S. S., Rocha E. P. C., Diversification of the type IV filament superfamily into machines for adhesion, protein secretion, DNA uptake, and motility. PLoS Biol. 17, e3000390 (2019). - PMC - PubMed
    1. Burrows L. L., Pseudomonas aeruginosa twitching motility: Type IV pili in action. Annu. Rev. Microbiol. 66, 493–520 (2012). - PubMed
    1. Craig L., Forest K. T., Maier B., Type IV pili: Dynamics, biophysics and functional consequences. Nat. Rev. Microbiol. 17, 429–440 (2019). - PubMed
    1. Merz A. J., So M., Sheetz M. P., Pilus retraction powers bacterial twitching motility. Nature 407, 98–102 (2000). - PubMed
    1. Persat A., Inclan Y. F., Engel J. N., Stone H. A., Gitai Z., Type IV pili mechanochemically regulate virulence factors in Pseudomonas aeruginosa. Proc. Natl. Acad. Sci. U.S.A. 112, 7563–7568 (2015). - PMC - PubMed

Publication types

MeSH terms

LinkOut - more resources