. 2021 Feb 23;118(8):e2016897118.
doi: 10.1073/pnas.2016897118.

Nile Red fluorescence spectroscopy reports early physicochemical changes in myelin with high sensitivity

Affiliations

Nile Red fluorescence spectroscopy reports early physicochemical changes in myelin with high sensitivity

Wulin Teo et al. Proc Natl Acad Sci U S A. .

Abstract

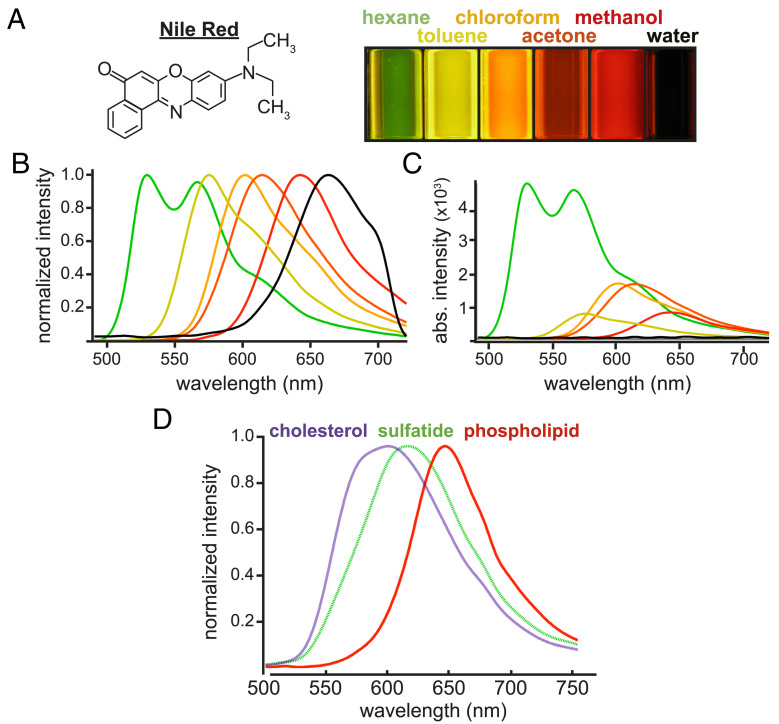
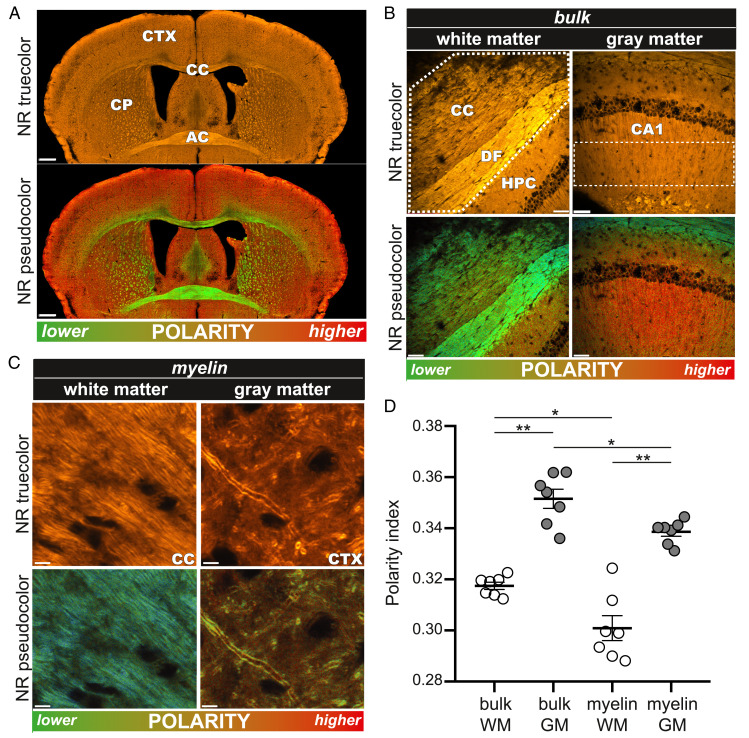
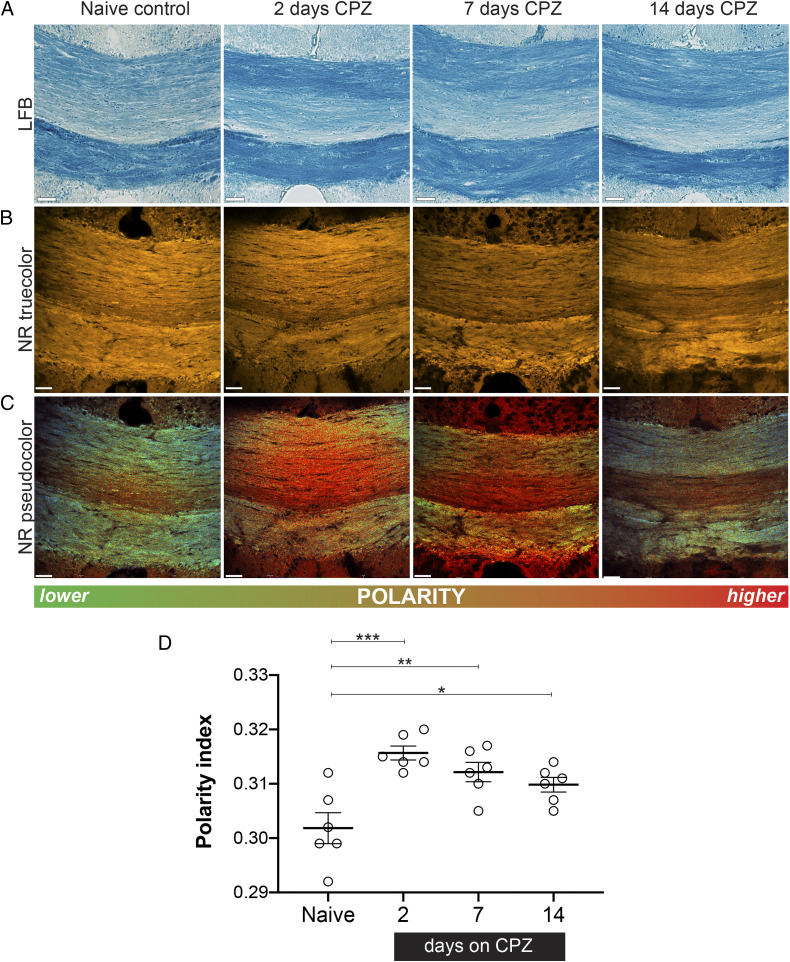
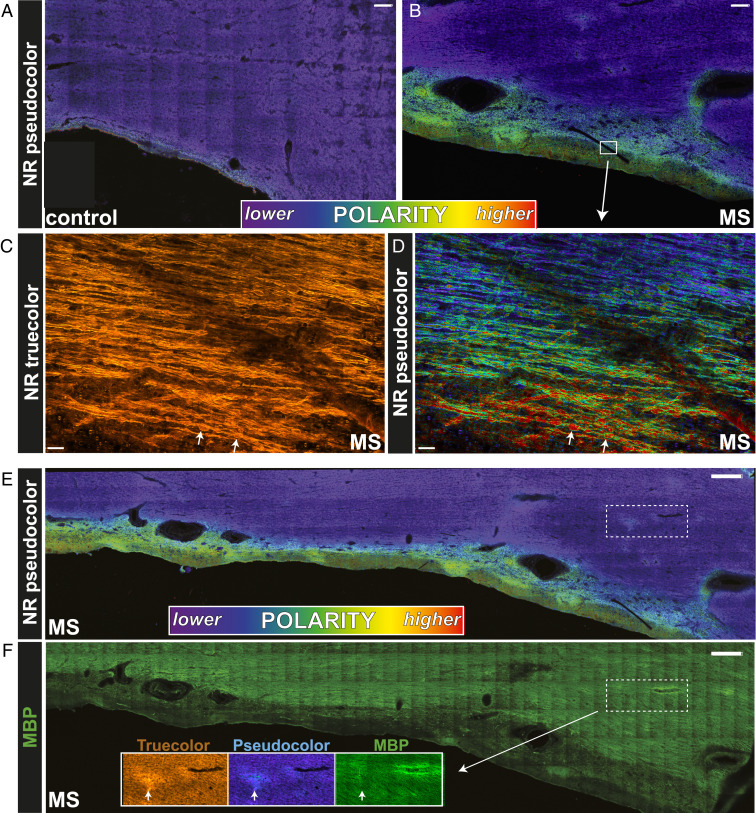
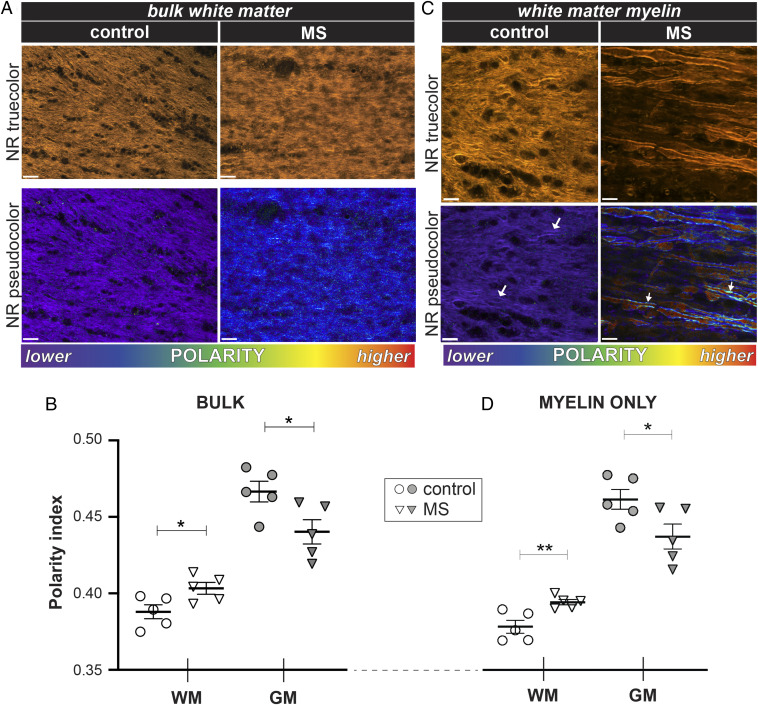
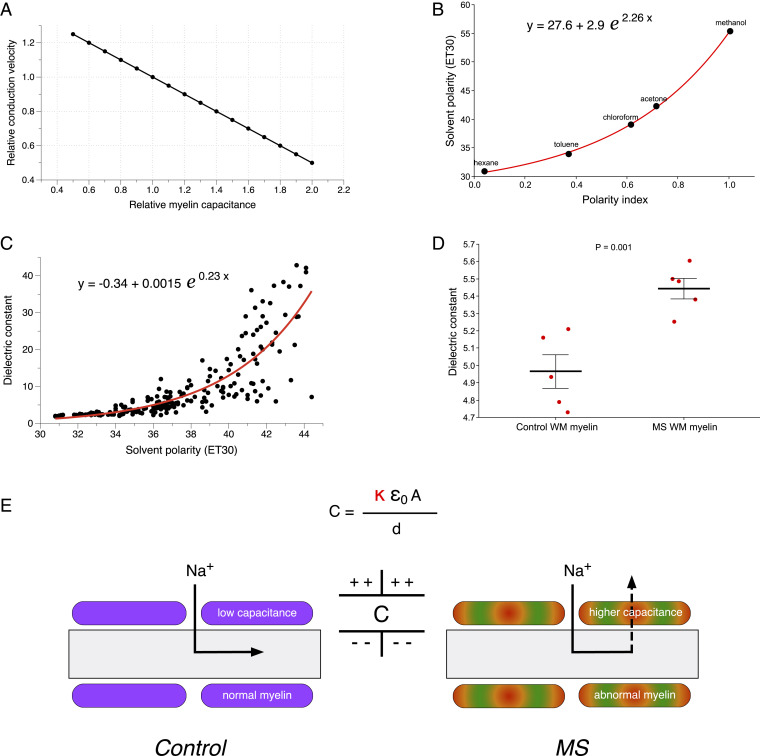
The molecular composition of myelin membranes determines their structure and function. Even minute changes to the biochemical balance can have profound consequences for axonal conduction and the synchronicity of neural networks. Hypothesizing that the earliest indication of myelin injury involves changes in the composition and/or polarity of its constituent lipids, we developed a sensitive spectroscopic technique for defining the chemical polarity of myelin lipids in fixed frozen tissue sections from rodent and human. The method uses a simple staining procedure involving the lipophilic dye Nile Red, whose fluorescence spectrum varies according to the chemical polarity of the microenvironment into which the dye embeds. Nile Red spectroscopy identified histologically intact yet biochemically altered myelin in prelesioned tissues, including mouse white matter following subdemyelinating cuprizone intoxication, as well as normal-appearing white matter in multiple sclerosis brain. Nile Red spectroscopy offers a relatively simple yet highly sensitive technique for detecting subtle myelin changes.

Keywords: cuprizone; fluorescence spectroscopy; lipids; multiple sclerosis; spectral confocal microscopy.


Conflict of interest statement

The authors declare no competing interest.

Figures

Fig. 1.
Fig. 1.
NR fluorescence varies with polarity of its environment. (A) Cuvettes of NR (10 µM) dissolved in solvents of varying polarity (nonpolar hexane to highly polar water) and excited with 380 nm light demonstrate a substantial color shift of emitted fluorescence; more polar solvents resulted in less intense and longer-wavelength emission. (B) Normalized fluorescence emission spectra from the six solvents. (C) Unnormalized emission spectra underscore the inverse relationship between NR signal intensity and solvent polarity. (D) As with different solvents in A, less-polar lipids (cholesterol) elicited blue-shifted NR fluorescence, which progressed to longer wavelengths as the polarity of the lipid increased. This strong solvatochromic property of NR formed the basis of the spectroscopic tissue imaging method described in this study.
Fig. 2.
Fig. 2.
NR fluorescence spectroscopy illuminates the physicochemical state of healthy rodent myelin in white versus gray matter. (A, Top) A true-color image of a healthy mouse brain stained with NR. Contrast is generated by lipophilic NR, preferentially binding to the brain’s lipid-rich compartments, especially myelin-rich corpus callosum (CC) and anterior commissure (AC). (A, Bottom) The pseudocolor image designed to map tissue polarity to a different display color more clearly reveals substantial contrast between gray and white matter regions. (B) Higher-magnification true-color (Top) and pseudocolor (Bottom) images illustrate marked polarity differences in CC and adjacent hippocampus in healthy rodent. (C) NR labeling provides excellent spatial resolution so that individual myelin sheaths can be resolved. (D) The graph depicts the mean polarity index derived from NR spectra in various regions. White matter exhibited a consistently lower polarity than gray matter. Each marker represents the average value of multiple images of the same subject. The significance was determined by one-way ANOVA. CP, caudate putamen; CTX, cortex; DF, dorsal fornix; HPC, hippocampus; CA1, stratum radiatum region of the hippocampus. (Scale bars: A, 500 µm; B, 50 µm; and C, 5 µm.) *P < 0.05; **P < 0.01.
Fig. 3.
Fig. 3.
Early myelin changes revealed by NR spectroscopy precede overt demyelination in the CPZ mouse model. (A) LFB staining indicates that no histologically detectable demyelination occurred during the 2-wk treatment with CPZ using this conventional myelin label. (B) True-color images of NR-labeled medial CC from control and after various exposure times to CPZ. By signal intensity alone, there is no detectable myelin loss after 14 d of intoxication. (C) Equivalent pseudocolor images reveal a significant polarity shift to higher values as early as 2 d of CPZ exposure, with partial recovery at later time points. (D) Quantitative depiction of mean polarity index as a function of CPZ exposure. The partial reversal toward normal at later times likely reflects the robust reparative mechanisms in the rodent. The significance was determined by one-way ANOVA, followed by a post hoc Dunnett test. (Scale bar, 50 µm.) *P < 0.05; **P < 0.01; and ***P < 0.001.
Fig. 4.
Fig. 4.
Myelin in NAWM from human MS autopsied tissue exhibited significant spectroscopic changes. (A) NR fluorescence is relatively uniform in the periventricular region of a non-MS control with a nonpolar character. (B) By contrast, in MS tissue there was a gradient of spectral shift from the ventricular surface into the parenchyma. High-magnification true-color (C) and pseudocolor (D) images of the white box in B clearly depict this pathological gradient. White arrows in C and D point to swollen axons, increasing with proximity to the ventricle. Interestingly, the axonal spheroids exhibited a striking red appearance in the pseudocolor images, indicating a unique spectral signature and polar character that differed markedly from intact healthy fibers. (E) Periventricular MS tissue exhibited subtle focal abnormalities away from the ventricle (dotted white box), which were not seen in controls (A). (F) A closer analysis of the focal abnormality revealed by NR spectroscopy illustrates myelin that was intact by conventional immunohistochemsitry (MBP+, green) yet exhibited subtle change by NR spectroscopy. (Scale bars: A and B, 250 µm; C and D, 50 µm; E and F, 500 µm.)
Fig. 5.
Fig. 5.
Myelin in MS is diffusely abnormal in both normal-appearing white and gray matter. (A) True-color and pseudocolored images of MS NAWM stained with NR and analyzed in bulk (i.e., cells and extracellular matrix in a single region of interest). Pseudocolored images of MS tissue revealed a shift to longer wavelengths, indicating increased polarity compared to non-MS controls. (B) The graph depicting mean polarity index calculated from NR spectra. White matter exhibited a more polar character in MS, whereas gray matter shifted in the opposite direction. (C) MS NAWM myelin showed marked heterogeneity compared to control (arrows), with a corresponding shift to higher mean polarity (D). As with bulk tissue analysis, gray matter myelin had a lower polarity index in MS. The significance was determined by unpaired two-tailed t test. (Scale bars: A, 25 µm; C, 10 µm.) *P < 0.05.
Fig. 6.
Fig. 6.
Effects of altered myelin capacitance on axonal conduction velocity: theoretical calculations. (A) The graph of conduction velocity as a function of myelin capacitance. With all other geometrical properties held constant, propagation velocity is sensitive to myelin capacitance with an inversely linear relationship (48). (B) There is a close exponential relationship between polarity index calculated from NR spectra and published polarities for the five solvents used in our study. (C) Similarly, an exponential function was fitted to published dielectric constants versus solvent polarity for a variety of organic solvents (49). (D) Together, these calibration curves allowed us to estimate myelin dielectric constants using NR spectra acquired from myelin regions. Myelin from NAWM in MS brain had a significantly greater mean dielectric constant. The P value was calculated using unpaired one-tailed t test. (E) A model proposing how variations in myelin capacitance due to changes in dielectric constant alone (κ) could significantly alter action currents and therefore conduction velocities in still-myelinated axons with normal geometry (A and d: area and thickness of myelin + internodal axolemma, respectively; ε0: permittivity of free space). Normal low-capacitance myelin will promote inward action currents to flow to the next node and excite it with minimal delay. In contrast, higher capacitance will cause more leakage of current across the internodal myelin, delaying activation of the next node or blocking conduction altogether.

Similar articles

Cited by

References

    1. Horrocks L. A., Composition of mouse brain myelin during development. J. Neurochem. 15, 483–488 (1968). - PubMed
    1. Snaidero N., et al. ., Antagonistic functions of MBP and CNP establish cytosolic channels in CNS myelin. Cell Rep. 18, 314–323 (2017). - PMC - PubMed
    1. Weil M. T., et al. ., Loss of myelin basic protein function triggers myelin breakdown in models of demyelinating diseases. Cell Rep. 16, 314–322 (2016). - PMC - PubMed
    1. O’Brien J. S., Sampson E. L., Lipid composition of the normal human brain: Gray matter, white matter, and myelin. J. Lipid Res. 6, 537–544 (1965). - PubMed
    1. Cuzner M. L., Davison A. N., The lipid composition of rat brain myelin and subcellular fractions during development. Biochem. J. 106, 29–34 (1968). - PMC - PubMed

Publication types

MeSH terms

Grants and funding

LinkOut - more resources