

Planktivores as trophic drivers of global coral reef fish diversity patterns
- PMID: 33593939
- PMCID: PMC7936278
- DOI: 10.1073/pnas.2019404118
Planktivores as trophic drivers of global coral reef fish diversity patterns
Abstract
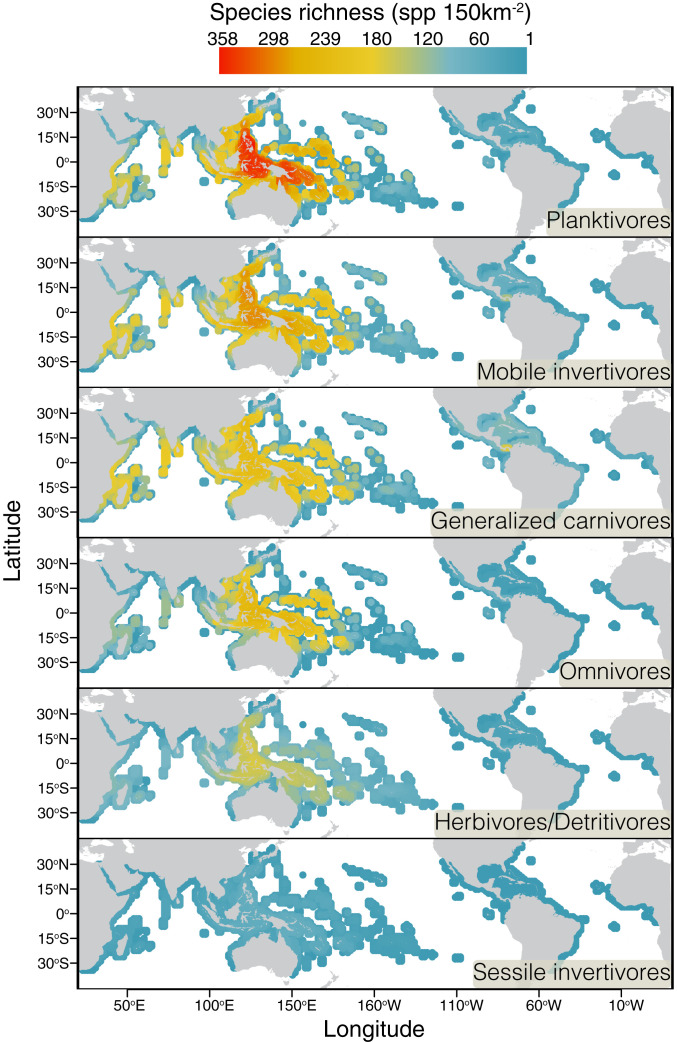
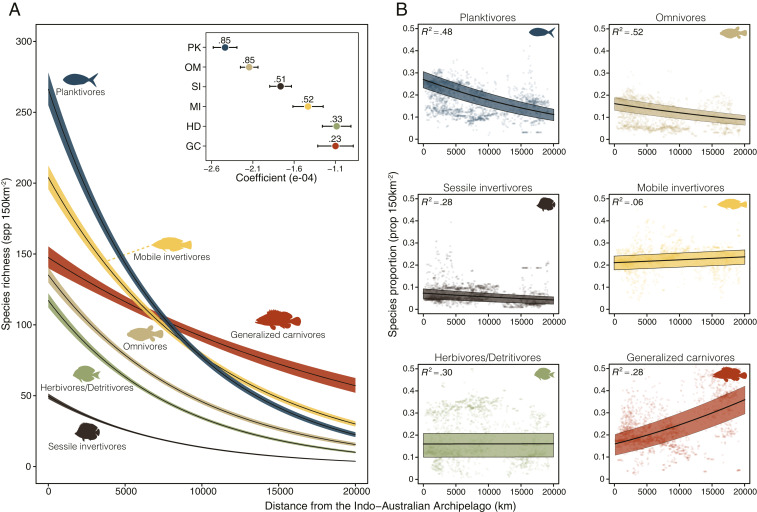
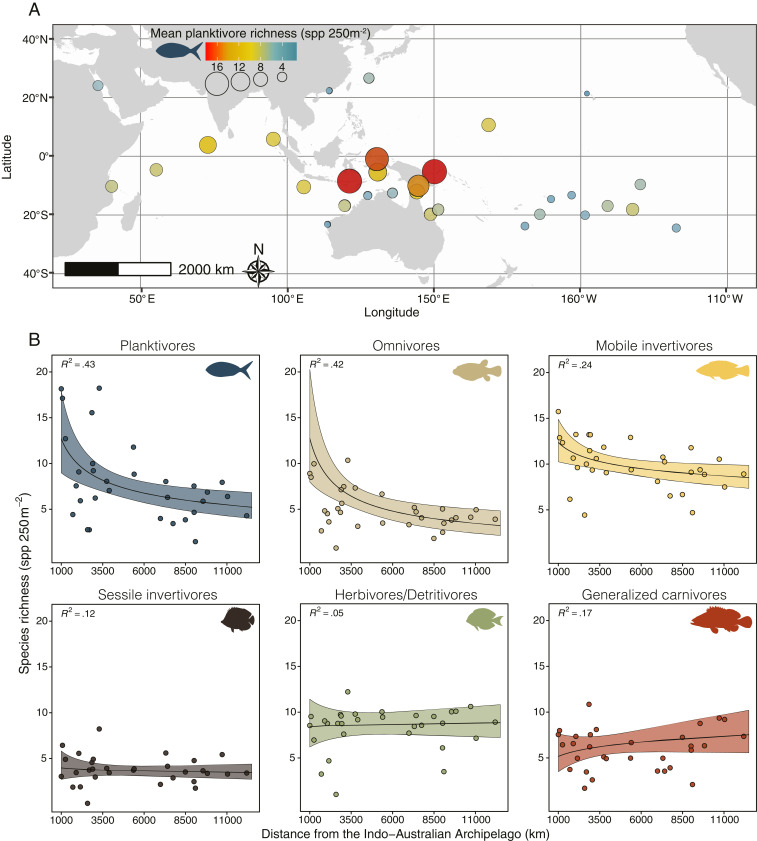
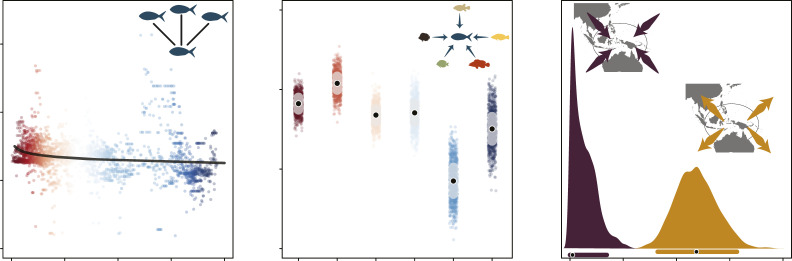
One of the most prominent features of life on Earth is the uneven number of species across large spatial scales. Despite being inherently linked to energetic constraints, these gradients in species richness distribution have rarely been examined from a trophic perspective. Here we dissect the global diversity of over 3,600 coral reef fishes to reveal patterns across major trophic groups. By analyzing multiple nested spatial scales, we show that planktivores contribute disproportionally to the formation of the Indo-Australian Archipelago (IAA) marine biodiversity hotspot. Besides being "hotter" at the hotspot, planktivorous fishes display the steepest decline in species numbers with distance from the IAA when compared to other trophic groups. Surprisingly, we did not detect differences in diversification, transition, and dispersal rates in extant species phylogenies that would explain this remarkable gradient in planktivorous fish richness. Thus, we identify two potential complementary drivers for this pattern. First, exceptional levels of partitioning among planktivorous coral reef fishes were driven by temporally stable oceanographic conditions and abundant planktonic resources in the IAA. Second, extinctions of planktivores outside the IAA have been particularly pronounced during Quaternary climate fluctuations. Overall, our results highlight trophic ecology as an important component of global species richness gradients.
Keywords: Indo-Australian Archipelago; extinction; macroecology; species richness; trophic groups.
Conflict of interest statement
The authors declare no competing interest.
Figures
Similar articles
-
The biogeography of tropical reef fishes: endemism and provinciality through time.Biol Rev Camb Philos Soc. 2017 Nov;92(4):2112-2130. doi: 10.1111/brv.12323. Epub 2017 Feb 23. Biol Rev Camb Philos Soc. 2017. PMID: 28231621 Review.
-
Coral reefs as drivers of cladogenesis: expanding coral reefs, cryptic extinction events, and the development of biodiversity hotspots.J Evol Biol. 2011 Dec;24(12):2543-62. doi: 10.1111/j.1420-9101.2011.02391.x. Epub 2011 Oct 10. J Evol Biol. 2011. PMID: 21985176
-
The hidden half: ecology and evolution of cryptobenthic fishes on coral reefs.Biol Rev Camb Philos Soc. 2018 Nov;93(4):1846-1873. doi: 10.1111/brv.12423. Epub 2018 May 7. Biol Rev Camb Philos Soc. 2018. PMID: 29736999 Review.
-
Physical, biological and anthropogenic drivers of spatial patterns of coral reef fish assemblages at regional and local scales.Sci Total Environ. 2023 Dec 15;904:166695. doi: 10.1016/j.scitotenv.2023.166695. Epub 2023 Sep 1. Sci Total Environ. 2023. PMID: 37660823
-
Quaternary coral reef refugia preserved fish diversity.Science. 2014 May 30;344(6187):1016-9. doi: 10.1126/science.1249853. Science. 2014. PMID: 24876495
Cited by
-
Rising from the Ashes: The Biogeographic Origins of Modern Coral Reef Fishes.Bioscience. 2022 Jul 20;72(8):769-777. doi: 10.1093/biosci/biac045. eCollection 2022 Aug. Bioscience. 2022. PMID: 35923187 Free PMC article.
-
Local human impacts disrupt depth-dependent zonation of tropical reef fish communities.Nat Ecol Evol. 2023 Nov;7(11):1844-1855. doi: 10.1038/s41559-023-02201-x. Epub 2023 Sep 25. Nat Ecol Evol. 2023. PMID: 37749400 Free PMC article.
-
Saving coral reefs: significance and biotechnological approaches for coral conservation.Adv Biotechnol (Singap). 2024 Nov 22;2(4):42. doi: 10.1007/s44307-024-00049-1. Adv Biotechnol (Singap). 2024. PMID: 39883363 Free PMC article. Review.
-
The complex structure of aquatic food webs emerges from a few assembly rules.Nat Ecol Evol. 2025 Apr;9(4):576-588. doi: 10.1038/s41559-025-02647-1. Epub 2025 Feb 28. Nat Ecol Evol. 2025. PMID: 40021903 Free PMC article.
-
Spatial subsidies drive sweet spots of tropical marine biomass production.PLoS Biol. 2021 Nov 2;19(11):e3001435. doi: 10.1371/journal.pbio.3001435. eCollection 2021 Nov. PLoS Biol. 2021. PMID: 34727097 Free PMC article.
References
-
- Bellwood D. R., Hughes T. P., Regional-scale assembly rules and biodiversity of coral reefs. Science 292, 1532–1535 (2001). - PubMed
-
- Mora C., Chittaro P. M., Sale P. F., Kritzer J. P., Ludsin S. A., Patterns and processes in reef fish diversity. Nature 421, 933–936 (2003). - PubMed
-
- Tittensor D. P., et al. ., Global patterns and predictors of marine biodiversity across taxa. Nature 466, 1098–1101 (2010). - PubMed
-
- Willig M. R., Kaufman D. M., Stevens R. D., Latitudinal gradients of biodiversity: Pattern, process, scale, and synthesis. Annu. Rev. Ecol. Evol. Syst. 34, 273–309 (2003).
-
- Hoeksema B. W., “Delineation of the Indo-Malayan centre of maximum marine biodiversity: The Coral Triangle” in Biogeography, Time, and Place: Distributions, Barriers, and Islands, Renema W., Ed. (Springer, Dordrecht, Netherlands, 2007), pp. 117–178.
Publication types
MeSH terms
LinkOut - more resources
Full Text Sources
Other Literature Sources
Research Materials
