. 2021 Feb 16;12(1):e03579-20.
doi: 10.1128/mBio.03579-20.

A Heterogeneously Expressed Gene Family Modulates the Biofilm Architecture and Hypoxic Growth of Aspergillus fumigatus

Affiliations

A Heterogeneously Expressed Gene Family Modulates the Biofilm Architecture and Hypoxic Growth of Aspergillus fumigatus

Caitlin H Kowalski et al. mBio. .

Abstract

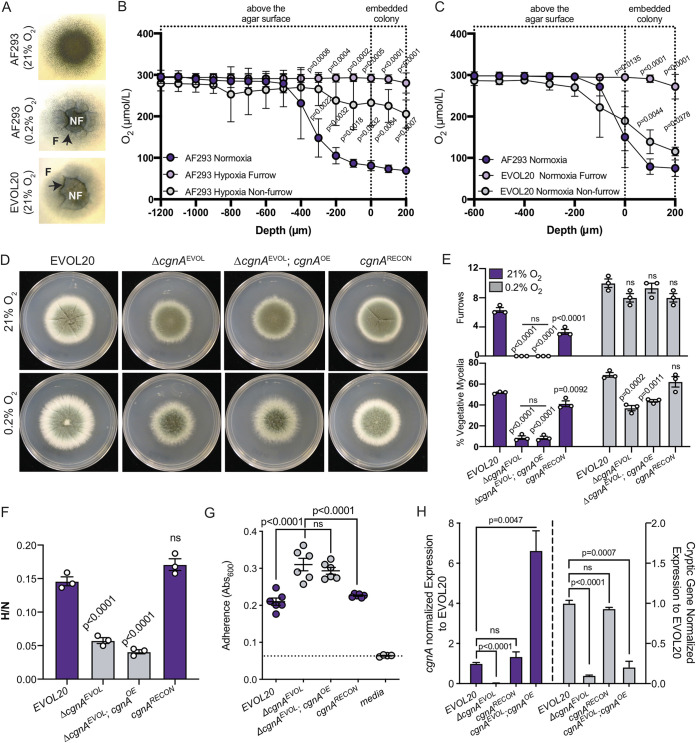
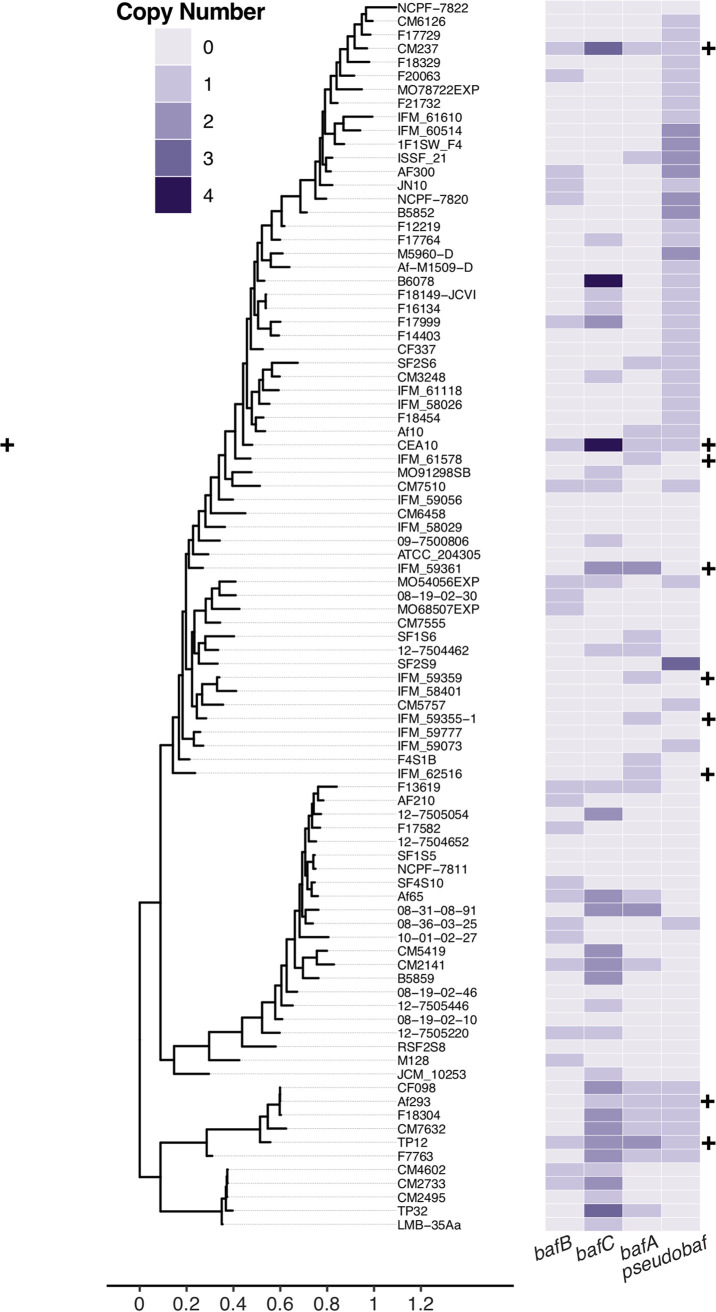
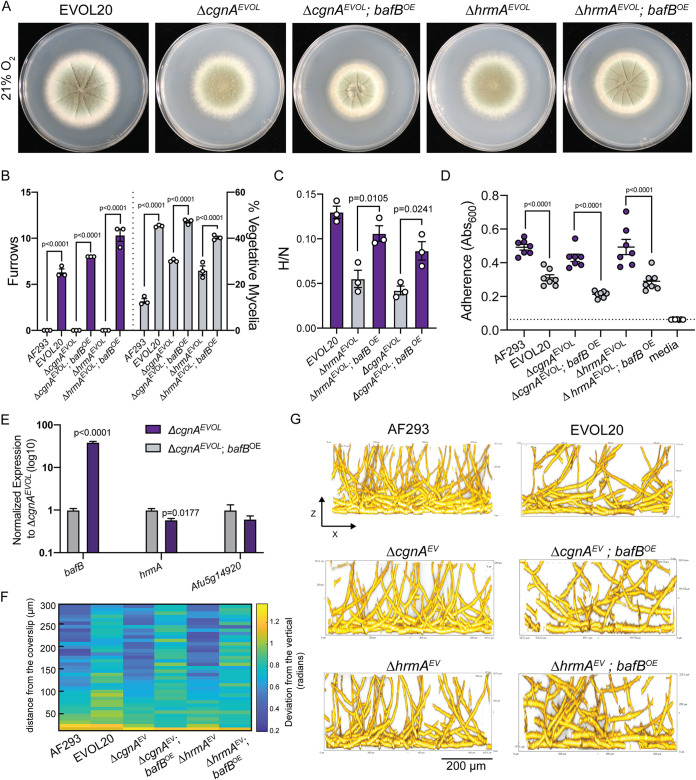
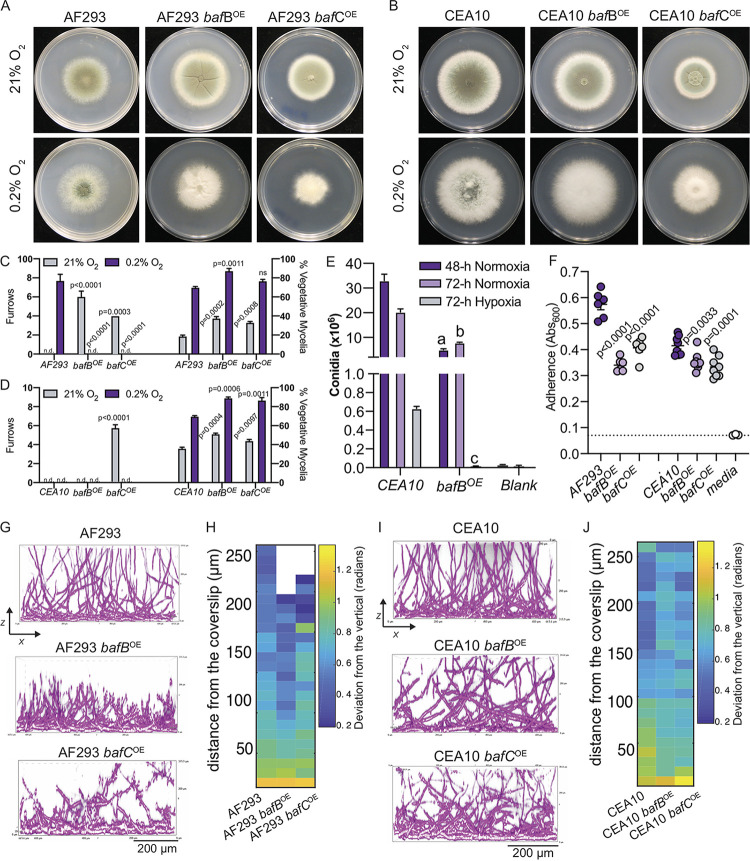
The genus Aspergillus encompasses human pathogens such as Aspergillus fumigatus and industrial powerhouses such as Aspergillus niger In both cases, Aspergillus biofilms have consequences for infection outcomes and yields of economically important products. However, the molecular components influencing filamentous fungal biofilm development, structure, and function remain ill defined. Macroscopic colony morphology is an indicator of underlying biofilm architecture and fungal physiology. A hypoxia-locked colony morphotype of A. fumigatus has abundant colony furrows that coincide with a reduction in vertically oriented hyphae within biofilms and increased low oxygen growth and virulence. Investigation of this morphotype has led to the identification of the causative gene, biofilm architecture factor A (bafA), a small cryptic open reading frame within a subtelomeric gene cluster. BafA is sufficient to induce the hypoxia-locked colony morphology and biofilm architecture in A. fumigatus Analysis across a large population of A. fumigatus isolates identified a larger family of baf genes, all of which have the capacity to modulate hyphal architecture, biofilm development, and hypoxic growth. Furthermore, introduction of A. fumigatusbafA into A. niger is sufficient to generate the hypoxia-locked colony morphology, biofilm architecture, and increased hypoxic growth. Together, these data indicate the potential broad impacts of this previously uncharacterized family of small genes to modulate biofilm architecture and function in clinical and industrial settings.IMPORTANCE The manipulation of microbial biofilms in industrial and clinical applications remains a difficult task. The problem is particularly acute with regard to filamentous fungal biofilms for which molecular mechanisms of biofilm formation, maintenance, and function are only just being elucidated. Here, we describe a family of small genes heterogeneously expressed across Aspergillus fumigatus strains that are capable of modifying colony biofilm morphology and microscopic hyphal architecture. Specifically, these genes are implicated in the formation of a hypoxia-locked colony morphotype that is associated with increased virulence of A. fumigatus Synthetic introduction of these gene family members, here referred to as biofilm architecture factors, in both A. fumigatus and A. niger additionally modulates low oxygen growth and surface adherence. Thus, these genes are candidates for genetic manipulation of biofilm development in aspergilli.

Keywords: Aspergillus fumigatus; biofilm; cryptic gene; genetics; hypoxia; morphology.


Figures

FIG 1
FIG 1
A cryptic gene within the hrmA-associated gene cluster is necessary for the hypoxia-evolved phenotypes of EVOL20. (A) 72-h colony biofilms used for oxygen measurements, with furrows (F) and nonfurrowing (NF) regions labeled. Images are representative of three independent biological samples. (B) Oxygen quantification of AF293 colony biofilms grown in normoxia (21% O2) or hypoxia (0.2% O2). In hypoxia-grown colonies oxygen was measured both in furrows (F) and in nonfurrows (NF). n = 3 independent biological replicates. Error bars indicate standard errors around the mean. Multiple one-way analyses of variance (ANOVA) were performed with Dunnett’s posttest at each depth. (C) Oxygen quantification for normoxia-grown colonies of AF293 and EVOL20. EVOL20 colonies were measured in furrowing (F) and nonfurrowing (NF) regions. n = 3 independent biological replicates. Error bars indicate standard errors around the mean. Multiple one-way ANOVAs were performed with Dunnett’s posttest at each depth. (D) 96-h colony biofilms in normoxia (21% O2) and hypoxia (0.2% O2). Images are representative of three independent biological samples. (E) Quantification of colony biofilm morphological features from three independent biological samples. One-way ANOVA with Dunnett’s posttest for multiple comparisons was performed relative to EVOL20 within each oxygen environment. (F) The ratio of fungal biomass in hypoxia (0.2% O2) relative to fungal biomass in normoxia (21% O2) (H/N) in shaking-flask cultures. One-way ANOVA with Dunnett’s posttest for multiple comparisons was performed relative to EVOL20. n = 3 independent biological samples. (G) Adherence to plastic measured through a crystal violet assay. Dashed line marks the mean value for media alone. One-way ANOVA with Dunnett’s posttest for multiple comparisons was performed relative to ΔcgnAEVOL. n = 6 independent biological replicates. (H) Gene expression measured by qRT-PCR for cgnA and the cryptic ORF. n = 3 independent biological replicates. One-way ANOVA with Tukey’s multiple-comparison test was performed.
FIG 2
FIG 2
Phylogeny of 92 A. fumigatus strains with copy number of the cryptic gene and its putative orthologs. The A. fumigatus strain maximum-likelihood phylogeny was constructed from 71,513 parsimony informative SNPs identified across the strains. The heat map indicates the abundance of bafA, bafB, and bafC, as well as a baf pseudogene (Pseudobaf) across the phylogeny based on the genome sequences from CEA10. Strains which have been previously identified as encoding hrmA are indicated by a plus (+) sign.
FIG 3
FIG 3
The putative ortholog of the cryptic gene, bafB, is sufficient to complement the loss of the HAC genes cgnA and bafA. (A) 96-h colony biofilms from 21% O2 where hypoxia-locked (H-MORPH) morphological features, furrows and vegetative mycelia, can be visualized. Images are representative of three independent biological samples. (B) Quantification of the H-MORPH features from colony biofilms of three independent biological samples. Student two-tailed nonparametric t tests were performed between each isogenic strain set. (C) Ratio of fungal biomass in hypoxia (0.2% O2) relative to fungal biomass in normoxia (21% O2) (H/N) in shaking-flask cultures. A Student two-tailed nonparametric t test was performed between isogenic strain sets. n = 3 independent biological samples. (D) Adherence to plastic measured through a crystal violet assay. Dashed line marks the mean value for media alone. A Student two-tailed nonparametric t test was performed between isogenic strain sets. n = 7 independent biological samples. (E) Gene expression measured by qRT-PCR for representative HAC genes as a result of bafB overexpression at 21% O2. n = 3 independent biological samples. (F) Heat map displaying the architecture of the fungal biofilms measured as the deviation of the hyphae from a vertical axis. Each column is representative of a minimum of three independent biological samples. (G) Representative images (n = 3 biological samples) of submerged biofilms on the orthogonal plane (xz) that are quantified in the heat map in panel F. Scale bar, 200 μm. Error bars indicate standard errors around the mean.
FIG 4
FIG 4
Introduction of the HAC cryptic gene bafA is sufficient to generate H-MORPH in AF293 and impacts biofilm architecture in the baf+ strain CEA10. (A) 96-h colony biofilms in normoxia (21% O2) and hypoxia (0.2% O2) of AF293 and AF293 with the overexpression of bafA. Images are representative of three independent biological samples. (B) 96-h colony biofilms in normoxia (21% O2) and hypoxia (0.2% O2) of CEA10 and CEA10 with the overexpression of bafA. Images are representative of three independent biological samples. (C) Quantification of the H-MORPH features from colony biofilms of three independent biological samples. Student two-tailed nonparametric t tests were performed between each isogenic strain set. (D) Representative images of submerged biofilms (n = 3 biological samples) on the orthogonal plane (xz). Scale bar, 200 μm. (E) Heat map displaying the architecture of the fungal biofilms measured as the deviation of the hyphae from a vertical axis. Each column is representative of a minimum of three independent biological samples. (F) Adherence to plastic measured through a crystal violet assay. Dashed line marks the mean value for media alone. A Student two-tailed nonparametric t test was performed between isogenic strain sets. n = 6 independent biological samples. (G) Ratio of fungal biomass in hypoxia (0.2% O2) relative to fungal biomass in normoxia (21% O2) (H/N) in shaking-flask cultures. Student two-tailed nonparametric t test performed between isogenic strain sets. n = 4 independent biological samples. (H) Gene expression measured by qRT-PCR for bafA, bafB, and bafC in AF293 and CEA10. n = 4 independent biological samples. Error bars indicate standard errors around the mean.
FIG 5
FIG 5
Introduction of bafB and bafC impact colony and submerged biofilm morphology in independent strain backgrounds. (A) 96-h colony biofilms in normoxia (21% O2) and hypoxia (0.2% O2) of AF293 and AF293 with the overexpression of bafB or bafC. Images are representative of three independent biological samples. (B) 96-h colony biofilms in normoxia (21% O2) and hypoxia (0.2% O2) of CEA10 and CEA10 with the overexpression of bafB or bafC. Images are representative of three independent biological samples. (C) Quantification of the H-MORPH features from colony biofilms of AF293, AF293 bafBOE, and AF293 bafCOE with three independent biological samples. One-way ANOVAs with Dunnett’s posttest for multiple comparisons relative to AF293 were performed. (D) Quantification of the H-MORPH features from colony biofilms of CEA10, CEA10 bafBOE, and CEA10 bafCOE with three independent biological samples. One-way ANOVAs with Dunnett’s posttest for multiple comparisons relative to CEA10 were performed. (E) Quantification of conidiation from three independent biological samples of CEA10 and CEA10 bafBOE in normoxia (21% O2) or hypoxia (0.2% O2). Student two-tailed nonparametric t tests were performed between CEA10 and CEA10 bafBOE for each time point. (a, P = 0.0004; b, P = 0.0006; c, P < 0.0001). (F) Adherence to plastic measured through a crystal violet assay. Dashed line marks the mean value for media alone. A one-way ANOVA with Dunnett’s posttest for multiple comparisons was performed between isogenic strain sets relative to AF293 or CEA10. n = 6 independent biological samples for AF293 strains and n = 8 independent biological samples for CEA10 strains. (G) Representative images of submerged biofilms (n = 3 biological samples) on the orthogonal plane (xz) of AF293, AF293 bafBOE, and AF293 bafCOE. Scale bar, 200 μm. (G) Representative images of submerged biofilms (n = 3 biological samples) on the orthogonal plane (xz) of CEA10, CEA10 bafBOE, and CEA10 bafCOE. Scale bar, 200 μm. (I) Heat map displaying the architecture of the fungal biofilms measured as the deviation of the hyphae from a vertical axis. Each column is representative of a minimum of three independent biological samples.
FIG 6
FIG 6
Introduction of A. fumigatus bafA is sufficient to generate H-MORPH in A. niger. (A) 96-h colony biofilms in normoxia (21% O2) and hypoxia (0.2% O2) of A. niger reference strain A1144 and two independent strains of A1144 with the overexpression of A. fumigatus bafA (AfbafAOE). Images are representative of three independent biological samples. (B) Quantification of the H-MORPH features from colony biofilms of three independent biological samples in normoxia (21% O2). One-way ANOVA with Dunnett’s posttest was performed for multiple comparisons relative to A1144. (C) Representative images of submerged biofilms (n = 3 biological samples) on the orthogonal plane (xz). Scale bar, 200 μm. (D) Heat map displaying the architecture of the fungal biofilms measured as the deviation of the hyphae from a vertical axis. Each column is representative of a minimum of three independent biological samples. (E) The ratio of fungal biomass in hypoxia (0.2% O2) relative to fungal biomass in normoxia (21% O2) (H/N) in shaking-flask cultures. A Student two-tailed nonparametric t test was performed between isogenic strain sets. n = 3 independent biological samples. (F) Adherence to plastic measured through a crystal violet assay. A Student two-tailed nonparametric t test was performed between samples within each media type. n = 6 independent biological samples for minimal media and n = 7 independent biological samples for complex media (minimal media with yeast extract).

References

    1. Harding MW, Marques LL, Howard RJ, Olson ME. 2009. Can filamentous fungi form biofilms? Trends Microbiol 17:475–480. doi:10.1016/j.tim.2009.08.007. - DOI - PubMed
    1. Orazi G, O’Toole GA. 2019. “It takes a village”: mechanisms underlying antimicrobial recalcitrance of polymicrobial biofilms. J Bacteriol 202:e00630-19. doi:10.1128/JB.00530-19. - DOI - PMC - PubMed
    1. Donlan RM. 2002. Biofilms: microbial life on surfaces. Emerg Infect Dis 8:881–890. doi:10.3201/eid0809.020063. - DOI - PMC - PubMed
    1. Ha D-G, O’Toole GA. 2015. c-di-GMP and its effects on biofilm formation and dispersion: a Pseudomonas aeruginosa review. Microbiol Spectr 3:MB-0003-2014. doi:10.1128/microbiolspec.MB-0003-2014. - DOI - PMC - PubMed
    1. Tolker-Nielsen T. 2015. Biofilm development. Microbiol Spectr 3:MB-0001-2014. doi:10.1128/microbiolspec.MB-0001-2014. - DOI - PubMed

Publication types

MeSH terms