. 2021 Feb 16;12(1):e02492-20.
doi: 10.1128/mBio.02492-20.

Quantifying Absolute Neutralization Titers against SARS-CoV-2 by a Standardized Virus Neutralization Assay Allows for Cross-Cohort Comparisons of COVID-19 Sera

Affiliations

Quantifying Absolute Neutralization Titers against SARS-CoV-2 by a Standardized Virus Neutralization Assay Allows for Cross-Cohort Comparisons of COVID-19 Sera

Kasopefoluwa Y Oguntuyo et al. mBio. .

Abstract

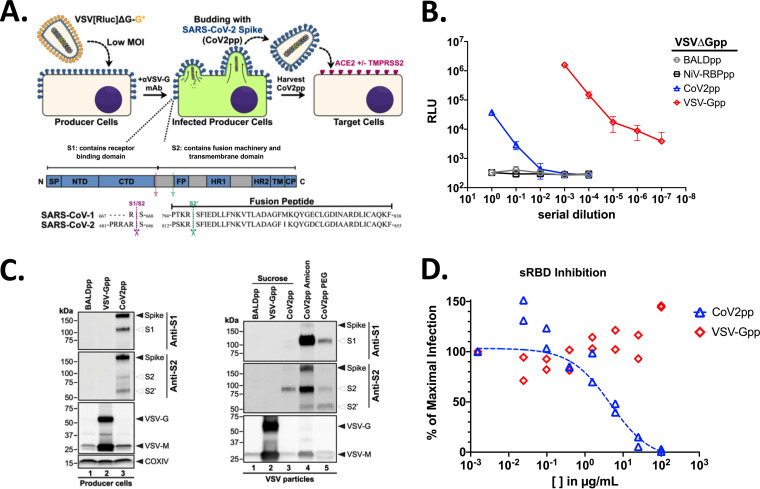
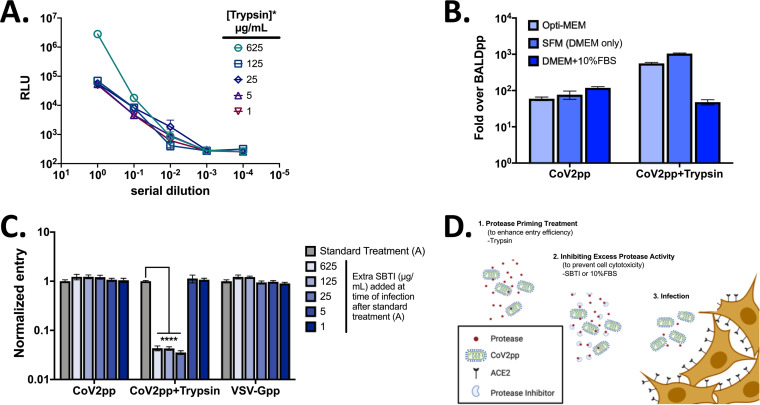
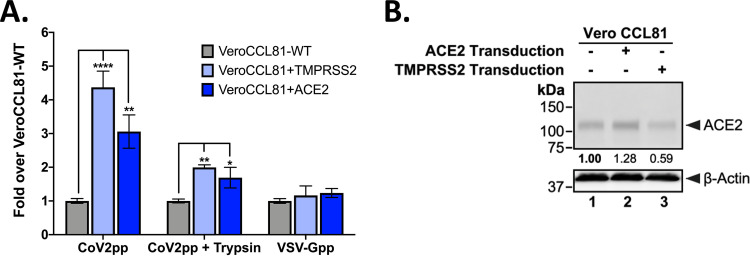
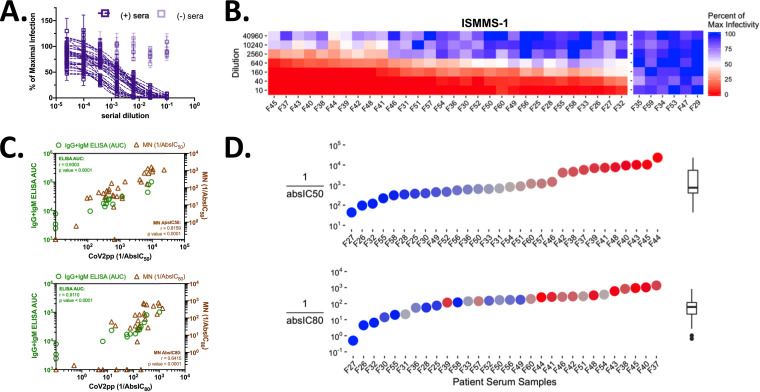
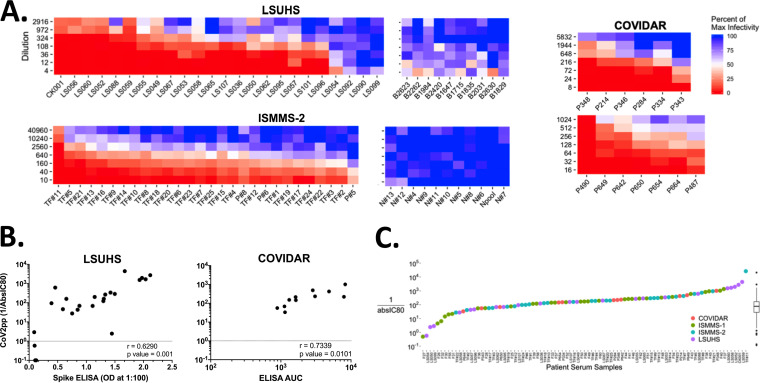
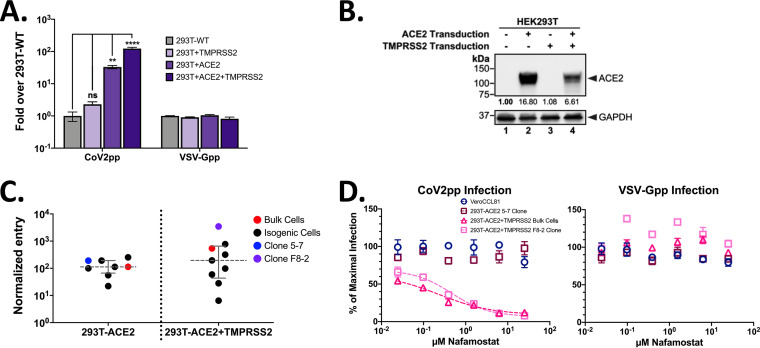
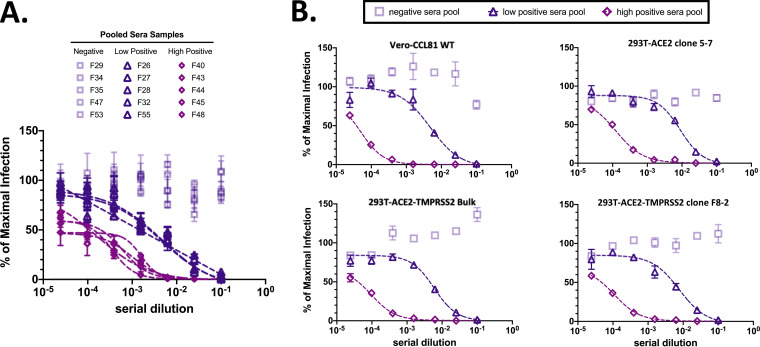
The global coronavirus disease 2019 (COVID-19) pandemic has mobilized efforts to develop vaccines and antibody-based therapeutics, including convalescent-phase plasma therapy, that inhibit viral entry by inducing or transferring neutralizing antibodies (nAbs) against the severe acute respiratory syndrome coronavirus 2 (SARS-CoV-2) spike glycoprotein (CoV2-S). However, rigorous efficacy testing requires extensive screening with live virus under onerous biosafety level 3 (BSL3) conditions, which limits high-throughput screening of patient and vaccine sera. Myriad BSL2-compatible surrogate virus neutralization assays (VNAs) have been developed to overcome this barrier. Yet, there is marked variability between VNAs and how their results are presented, making intergroup comparisons difficult. To address these limitations, we developed a standardized VNA using CoV2-S pseudotyped particles (CoV2pp) based on vesicular stomatitis virus bearing the Renilla luciferase gene in place of its G glycoprotein (VSVΔG); this assay can be robustly produced at scale and generate accurate neutralizing titers within 18 h postinfection. Our standardized CoV2pp VNA showed a strong positive correlation with CoV2-S enzyme-linked immunosorbent assay (ELISA) results and live-virus neutralizations in confirmed convalescent-patient sera. Three independent groups subsequently validated our standardized CoV2pp VNA (n > 120). Our data (i) show that absolute 50% inhibitory concentration (absIC50), absIC80, and absIC90 values can be legitimately compared across diverse cohorts, (ii) highlight the substantial but consistent variability in neutralization potency across these cohorts, and (iii) support the use of the absIC80 as a more meaningful metric for assessing the neutralization potency of a vaccine or convalescent-phase sera. Lastly, we used our CoV2pp in a screen to identify ultrapermissive 293T clones that stably express ACE2 or ACE2 plus TMPRSS2. When these are used in combination with our CoV2pp, we can produce CoV2pp sufficient for 150,000 standardized VNAs/week.IMPORTANCE Vaccines and antibody-based therapeutics like convalescent-phase plasma therapy are premised upon inducing or transferring neutralizing antibodies that inhibit SARS-CoV-2 entry into cells. Virus neutralization assays (VNAs) for measuring neutralizing antibody titers (NATs) are an essential part of determining vaccine or therapeutic efficacy. However, such efficacy testing is limited by the inherent dangers of working with the live virus, which requires specialized high-level biocontainment facilities. We therefore developed a standardized replication-defective pseudotyped particle system that mimics the entry of live SARS-CoV-2. This tool allows for the safe and efficient measurement of NATs, determination of other forms of entry inhibition, and thorough investigation of virus entry mechanisms. Four independent labs across the globe validated our standardized VNA using diverse cohorts. We argue that a standardized and scalable assay is necessary for meaningful comparisons of the myriad of vaccines and antibody-based therapeutics becoming available. Our data provide generalizable metrics for assessing their efficacy.

Keywords: COVID-19; SARS-CoV-2; convalescent-phase plasma; neutralizing antibodies; viral neutralization assay.


Figures

FIG 1
FIG 1
Production of VSVΔG-rLuc bearing the SARS-CoV-2 spike glycoprotein. (A) Overview of VSVΔG-rLuc-pseudotyped particles bearing CoV-2 spike (top), with annotated spike glycoprotein domains and cleavage sites (bottom). As mentioned in the text, we refer to SARS-CoV as SARS-CoV-1 for greater clarity. (B) The titers of VSV-ΔG[Rluc]-pseudotyped particles (VSVpp) bearing the Nipah virus receptor binding protein alone (NiV-RBPpp), SARS-CoV-2-S (CoV2pp), or VSV-G (VSV-Gpp) were determined on Vero-CCL81 cells using a 10-fold serial dilution. Symbols represent the means ± standard errors of the means (SEM) (error bars) from each titration performed in technical triplicates. (C) Expression of the indicated viral glycoproteins on producer cells and their incorporation into VSVpp. Western blots performed as described in Materials and Methods using anti-S1- or anti-S2-specific antibodies. (D) CoV2pp entry is inhibited by the soluble receptor binding domain (sRBD) derived from SARS-CoV-2-S. CoV2pp and VSV-Gpp infection of Vero-CCL81 cells was performed as described for panel B in the presence of the indicated amounts of sRBD. Neutralization curves were generated by fitting data points using a variable slope, a 4-parameter logistics regression curve (robust fitting method). The last point (no sRBD) was fixed to represent 100% maximal infection. The results of each replicate from an experiment performed in duplicate are shown. The calculated IC50 for sRBD neutralization of CoV2pp is 4.65 μg/ml.
FIG 2
FIG 2
CoV2pp entry is enhanced by trypsin treatment. (A) Optimizing trypsin treatment conditions. Supernatants containing CoV2pp were trypsin treated at the indicated concentrations for 15 min at room temperature prior to the addition of 625 μg/ml of SBTI. The titers of these particles were then determined on Vero-CCL81 cells in technical triplicates. Data are shown as means ± SEM. (B) Dilution in serum-free media (SFM, DMEM only) provides the highest signal/noise ratio for trypsin-treated CoV2pp entry. Particles were diluted 1:10 in Opti-MEM, SFM, or DMEM plus 10% FBS prior to infection of Vero-CCL81 cells and spinoculation as described in the legend of Fig. 1D. Cells infected without spinoculation show approximately 3×-lower signal/noise ratios (see Fig. S2 in the supplemental material). (C) Addition of soybean trypsin inhibitor at the time of infection reduces trypsin-treated particle entry. This assay was performed in technical triplicates for two independent experiments. Shown are the combined results, with error bars indicating SEM and **** indicating a P value of <0.0001. (D) Schematic showing an overall view of how protease priming and SBTI treatment works to enhance CoV2pp entry.
FIG 3
FIG 3
Trypsin-treated CoV2pp depend on ACE2 and TMPRSS2 for entry. (A) Parental and TMPRSS2- or ACE2-transduced Vero-CCL81 cells were infected with the indicated pseudotyped viruses. All particles were diluted in serum-free media in order to be within the linear range for the assay. Normalized infectivity data are presented as fold values over those for Vero-CCL81 WT cells for the various VSVpp shown. VSV-Gpp served as an internal control for the intrinsic permissiveness of various cell lines to VSV-mediated gene expression. Data are presented as means ± SEM from two independent experiments done in technical triplicates. *, P < 0.05; **, P < 0.01; ****, P < 0.0001. (B) Western blot of wild-type and transduced Vero CCL81 cells. The numbers below each column show that the relative ACE2 abundance was measured by densitometry and normalized as described in Materials and Methods.
FIG 4
FIG 4
CoV2pp viral neutralization assay and absIC50/absIC80 values versus those after spike binding of patient sera. (A) Thirty-six patient sera screened for CoV2pp neutralization. CoV2pp were used to infect Vero-CCL81 cells in the presence of a 4-fold serial dilution of patient sera, as described in Materials and Methods. Samples in light purple do not neutralize CoV2pp. Neutralization curves were fit using a variable-slope, 4-parameter logistics regression curve with a robust fitting method. (B) The same 36 samples are shown as a neutralization heat map, which was generated in R as described in Materials and Methods. Here, red represents complete neutralization, and blue represents no neutralization. Samples are sorted by the average from the first four dilutions, with the most neutralizing samples on the left. (C) Correlation of CoV2pp neutralization titers to spike binding (ELISA AUC, green circles) and live-virus microneutralization (MN, brown triangles) activity. The absolute IC50 (absIC50, top) and IC80 (absIC80, bottom) for CoV2pp neutralizations and live-virus MNs were calculated in R using a 4-parameter logistic regression model as described in Materials and Methods. Presented are the added IgG and IgM ELISA AUCs. AUC determinations and live-virus neutralizations were performed as described in Materials and Methods. Presented are the r and P values from a simple linear regression. (D) Positive serum samples and their CoV2pp reciprocal absIC50 (top) and absIC80 (bottom) values. The IC50 graph is colored and ordered to display samples with low, average, or high IC50s as blue, gray, or red circles, respectively. The IC80 graph below retains the coloring from the IC50 graph, but the samples are now ordered from left to right to show samples with the lowest to highest IC80 values. Tukey box and whisker plots show medians with interquartile ranges (IQR) and whiskers extending to 1.5× the IQR. All points outside that range are depicted.
FIG 5
FIG 5
CoV2pp viral neutralization assay validated against patient sera by external groups. (A) Patient serum neutralization of CoV2pp for 88 samples run by three different independent groups. This is visualized as in Fig. 4B, where red represents complete neutralization and blue represents no neutralization. (B) Correlations of CoV2pp reciprocal absIC80s to those of spike ELISAs. The absIC80 was calculated as described in the legend of Fig. 4C. For LSUHS ELISAs, the spike ectodomain was used and sera were diluted to a 1:100 dilution. For the COVIDAR ELISAs, a mixture of the sRBD and spike was utilized as previously described (116), and the AUC was calculated as described in Materials and Methods. (C) Summary absIC80s of 89 positive serum CoV2pp neutralizations. Samples from all 4 groups are depicted on the x axis. The absIC80 was calculated as described in the legend of Fig. 4C, and Tukey box and whisker plots are shown as described in the legend of Fig. 4D.
FIG 6
FIG 6
293T cells stably transduced with ACE2 and TMPRSS2 (293T-ACE2+TMPRSS2) are ultrapermissive for SARS-CoV-2pp infection. (A) Infection of 293T cell lines transduced to stably express TMPRSS2, ACE2, or both. Cell lines were generated as described in Materials and Methods. A single dilution of particles was used to infect cells prior to spinoculation as described in Materials and Methods. Infections were done in technical triplicates. Presented are the aggregated results from two independent replicates, and error bars show SEM. For statistics, ns indicates not significant, ** indicates a P value of <0.01, and **** indicates a P value of <0.0001. (B) Western blot of ACE2 expression in 293T cell lines. Blotting was performed as described in Materials and Methods, and the values below the columns represent the relative abundances of ACE2. (C) Normalized CoV2pp entry into single-cell clones. Entry was normalized to that of the wild-type parental cell line and further normalized to VSV-G entry. Presented are the averages from one experiment in technical triplicates. Error bars show the medians and interquartile ranges. Raw entry data for each cell clone are shown in Fig. S8A. (D) Entry inhibition of CoV2pp by nafamostat mesylate, a serine protease inhibitor. Nafamostat was mixed with CoV2pp (left panel) or VSV-Gpp (right panel) prior to addition to cells. Shown are the results from one experiment in technical triplicates. Data are presented as described in the legend of Fig. 4A, and error bars show SEM.
FIG 7
FIG 7
Ultrapermissive 293T-ACE2+TMPRSS2 cell clones retain the same phenotypic sensitivity to convalescent COVID-19 sera. (A) Selection of pooled serum samples. Results from Fig. 4A are reproduced here for the reader’s convenience. Presented is the subset of samples that were pooled for use in VNAs in the adjacent panel. (B) Vero CCL81 and transduced 293T cells were used for VNAs. Sera previously shown to be negative, weakly positive, or strongly positive for CoV2pp neutralization were selected to be pooled in equal volumes. These were subsequently used for VNAs, which were performed and presented as described in the legend of Fig. 4A. Notably, these VNAs were performed in the absence of exogenous trypsin or spinoculation.

Update of

Similar articles

Cited by

References

    1. Rehman SU, Shafique L, Ihsan A, Liu Q. 2020. Evolutionary trajectory for the emergence of novel coronavirus SARS-CoV-2. Pathogens 9:240. doi: 10.3390/pathogens9030240. - DOI - PMC - PubMed
    1. Peiris JSM, Guan Y, Yuen KY. 2004. Severe acute respiratory syndrome. Nat Med 10:S88–S97. doi: 10.1038/nm1143. - DOI - PMC - PubMed
    1. Center for Disease Control and Prevention. 2003. Revised U.S. surveillance case definition for severe acute respiratory syndrome (SARS) and update on SARS cases—United States and Worldwide, December 2003. Centers for Disease Control and Prevention, Atlanta, GA. - PubMed
    1. World Health Organization. 2020. Novel coronavirus (2019-nCoV): situation report, 19. WHO, Geneva, Switzerland.
    1. Petherick A. 2020. Developing antibody tests for SARS-CoV-2. Lancet 395:1101–1102. doi: 10.1016/S0140-6736(20)30788-1. - DOI - PMC - PubMed

Publication types

MeSH terms