. 2021 Feb 16;12(1):e02583-20.
doi: 10.1128/mBio.02583-20.

Molecular Signatures of Inflammatory Profile and B-Cell Function in Patients with Severe Fever with Thrombocytopenia Syndrome

Affiliations

Molecular Signatures of Inflammatory Profile and B-Cell Function in Patients with Severe Fever with Thrombocytopenia Syndrome

Angela Park et al. mBio. .

Abstract

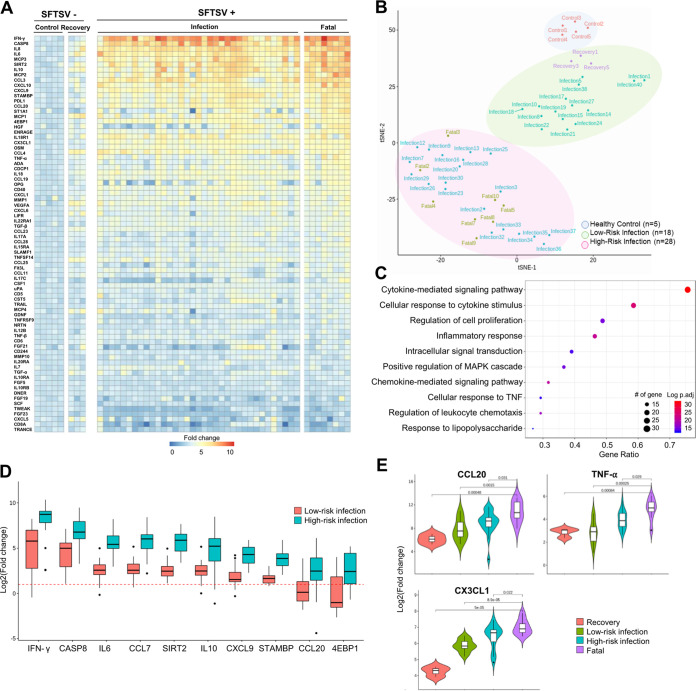
Dabie bandavirus (severe fever with thrombocytopenia syndrome virus [SFTSV]) induces an immunopathogenic disease with a high fatality rate; however, the mechanisms underlying its clinical manifestations are largely unknown. In this study, we applied targeted proteomics and single-cell transcriptomics to examine the differential immune landscape in SFTS patient blood. Serum immunoprofiling identified low-risk and high-risk clusters of SFTS patients based on inflammatory cytokine levels, which corresponded to disease severity. Single-cell transcriptomic analysis of SFTS patient peripheral blood mononuclear cells (PBMCs) at different infection stages showed pronounced expansion of B cells with alterations in B-cell subsets in fatal cases. Furthermore, plasma cells in which the interferon (IFN) pathway is downregulated were identified as the primary reservoir of SFTSV replication. This study identified not only the molecular signatures of serum inflammatory cytokines and B-cell lineage populations in SFTSV-induced fatalities but also plasma cells as the viral reservoir. Thus, this suggests that altered B-cell function is linked to lethality in SFTSV infections.IMPORTANCE SFTSV is an emerging virus discovered in China in 2009; it has since spread to other countries in East Asia. Although the fatality rates of SFTSV infection range from 5.3% to as high as 27%, the mechanisms underlying clinical manifestations are largely unknown. In this study, we demonstrated that SFTSV infection in fatal cases caused an excessive inflammatory response through high induction of proinflammatory cytokines and chemokines and the aberrant inactivation of adaptive immune responses. Furthermore, single-cell transcriptome sequencing (RNA-seq) analysis of SFTS patient PBMCs revealed that SFTSV targets the B-cell lineage population, especially plasma cells, as the potential viral reservoir in patients for whom the infection is fatal. Thus, SFTSV infection may inhibit high-affinity antibody maturation and secretion of plasma B cells, suppressing neutralizing antibody production and thereby allowing significant virus replication and subsequent fatality.

Keywords: SFTS; SFTSV; bandavirus; emerging virus; immunoprofiling; plasma B cell; proximity extension assay; single-cell RNA-seq.


Figures

FIG 1
FIG 1
Differential serum immunoprofiles of SFTSV patients. Shown is multiplex immune profiling of 76 inflammatory molecules using serum specimens derived from 5 healthy age-matched controls and 46 SFTSV+ patients (35 infection, 3 recovery, and 8 fatality). (A) Heat map of 76 inflammatory cytokines and chemokines in the SFTSV cohort (control and recovery) and SFTSV+ cohort (infection and fatality). Each box color represents fold change relative to the healthy control group. Each column represents a patient and each row represents a soluble factor measured by the immunoassay ordered in decreasing significance. (B) t-distributed stochastic neighbor embedding (t-SNE) plot showing unbiased clustering of the cohort based on cytokine and chemokine levels. Based on proximity, samples were subcategorized into healthy control, low-risk infection, and high-risk infection. The healthy control cluster includes 5 healthy age-matched controls, the low-risk infection cluster includes 3 recovery patients and 15 infection patients, and the high-risk infection cluster includes fatal cases and 20 infection patients. (C) Top 10 gene ontology (GO) biological pathway enrichment analysis for cytokines and chemokines induced in SFTSV+ patients. The x axis represents the ratio of enrichment (the number of observed genes divided by the number of expected genes from each GO in the gene list), and the y axis represents the enriched pathway in the GO database. The size of circles indicates the number of genes, and the color indicates adjusted log P value. (D) Fold changes of top 10 significantly altered cytokines and chemokines (P < 0.05) in low-risk and high-risk groups compared to the control group. The red dashed line represents the control value (basal level of 1). (E) Top three cytokines and chemokines associated specifically with fatal cases. P values are written above each bracket.
FIG 2
FIG 2
Changes in the host immune landscape upon SFTSV infection. (A) Schematic diagram of single-cell transcriptome study. Blood samples were collected from 8 patients: 3 healthy age-matched control patients (control group), 2 patients with SFTSV infection during the infection and after viral clearance (infection group and recovery group, respectively), and 3 patients who died from SFTSV infection (fatal group). PBMCs were isolated from blood for scRNA-seq analysis. (B) Quantification of SFTSV copy numbers in patient sera using qPCR. The viral copy numbers in sera were higher in the fatal group (3.5 to 4.8 log10 copies/ml) than in the infection group (2.8 to 3.5 log10 copies/ml). (C) Quantification of liver enzymes (ALT and AST), platelets, hemoglobin, and white blood cells (WBC). Blood samples were subjected to hematological examination using a Celltac hematology analyzer. The average values of ALT, AST, platelets, hemoglobin, and white blood cells were 17.7, 30, 262.7, 14.5, and 5.3 in the control group, 73, 174.5, 52.5, 13.1, and 1.5 in the infection group, 53, 131.5, 63, 10.6, and 3 in the recovery group, and 419.7, 419.7, 67, 13.7, and 1.9 in the fatal group. Asterisks indicate statistical significance between the control and infection groups or between the two groups indicated by the line determined by one-way ANOVA and subsequent Dunnett’s test (*, P < 0.05; **, P < 0.001; ***, P < 0.0001). (D) t-SNE visualization of PBMC populations. Individuals were divided into four groups based on infection status. Clusters are characterized by expression of markers defined in Fig. S2D. (E) Comparison analysis of canonical pathways significantly enriched in each infection group compared to the control group. A negative z score means inactivation of genes in a pathway compared to the control group, and a positive z score means activation of a gene in a pathway compared to the control group.
FIG 3
FIG 3
B-cell expansion and overt immune activation in fatal SFTSV infection. (A) Bar chart showing absolute count of each lymphocyte population in PBMCs. Colors in the bars represent total values for the respective cell populations. (B) Pie chart showing percentages of each lymphocyte population in total PBMCs. (C) Total number of significantly upregulated (white) or downregulated (black) genes in PBMCs of each patient group compared to the control group (P < 0.05 and fold change > 2). (D) Split violin plots showing highly expressed genes of each lymphocyte population in patients who died from SFTSV infection. Three gene markers are shown for each PBMC subtype.
FIG 4
FIG 4
B cells are the primary viral reservoir in fatal cases of SFTSV infection. (A) t-SNE plots of all four sample groups. Cells with SFTSV transcripts are colored red, while cells without SFTSV transcripts are colored gray. (B) t-SNE plots of different lymphocyte populations with SFTSV+ cells (red) and SFTSV cells (gray) in lethal SFTSV infections. (C) t-SNE plots of B-cell subtypes with SFTSV+ cells (red) and SFTSV cells (gray) in lethal SFTSV infections. (D) Heat map showing significantly different gene expression in infection, recovery, and fatal groups compared to the control group. Canonical pathways involved in each gene block are shown on the right side of the heat map. (E) The composition of the B-cell subset in each group is shown as percentages. Each colored bar indicates a different B-cell subset. (F) Volcano plot showing differentially expressed genes in the SFTSV+ B cells (red in panel B) versus SFTSV B cells (gray in panel B) in the fatal group. Selected upregulated genes are shown in red, and selected downregulated genes are shown in blue. The viral N mRNA is not shown in the plot because it is above the upper range of the P value. (G) Differential expression pathways of SFTSV-infected B cells versus noninfected B cells in lethal SFTSV infections are graphed with their activation z scores. Activation z score below zero indicates pathway inactivation, while score above zero indicates pathway activation. (H) Violin plots showing top four genes from each canonical pathway enriched in SFTSV+ B cells compared to SFTSV B cells. Statistically significant gene expression is observed only if a violin-shaped fitting area can be calculated.
FIG 5
FIG 5
High susceptibility of B cells to in vitro SFTSV infection. Whole blood from healthy donors (n = 6) was infected with SFTSV strain CB1/2014 or serum-free medium (control) at MOI 1 conditions (5% CO2, 37°C). After 48 h of infection, red blood cells were removed by lysing in red blood cell lysis buffer (Thermo Fisher Sciences, USA) and then SFTSV infection of each cell subset was assessed by intracellular staining with anti-SFTSV N antibody (in-house monoclonal antibody). (A) CD19+ B cells, CD3+ T cells, CD14+ monocytes, and CD56+ NK cells were identified in SFTSV-infected PBMCs by FACS with subset-specific antibodies. The percent change of each SFTSV-infected PBMC subset (lower row) compared with that of noninfected control PBMC subset (upper row) is presented. (B) Average percentage of PBMC subsets infected with SFTSV in six donors. The noninfected control for each PBMC subset was less than 1% in all donors. (C) Virus copy numbers in each sorted PBMC subset (CD45+ CD19+ B cells, CD45+ CD3+ T cells, CD45+ CD14+ monocytes, and CD45+ CD56+ NK cells) were measured using qRT-PCR with primers specific for the M gene. (D) Detailed subsets of SFTSV-infected B cells were identified using FACS (CD19+ CD27+ [memory B cell], CD19+ CD20 CD38 [plasmablast], and CD20 CD38+ CD138 [plasma cell]) and an SFTSV N antibody and are presented as the percent change. (E) Average percentage of each B-cell subset infected with SFTSV in all donors (n = 6). Noninfected control for each B-cell subset was less than 1% in all donors. Asterisks indicate statistical significance between the control and infection groups as indicated by the line, determined by one-way ANOVA and subsequent Tukey’s test (*, P < 0.05; **, P < 0.01; ***, P < 0.0001).

References

    1. Schoch CL, Ciufo S, Domrachev M, Hotton CL, Kannan S, Khovanskaya R, Leipe D, Mcveigh R, O’Neill K, Robbertse B. 2020. NCBI Taxonomy: a comprehensive update on curation, resources and tools. Database (Oxford) 2020:baaa062. doi:10.1093/database/baaa062. - DOI - PMC - PubMed
    1. National Institute of Infectious Diseases. 2019. Severe fever with thrombocytopenia syndrome (SFTS) in Japan, as of June 2019. Infect Agents Surveill Rep 40:111–112.
    1. KCDA. 2020. Infectious Disease Portal. http://www.cdc.go.kr/npt/biz/npp/ist/bass/bassDissStatsMain.do.
    1. Li F, He F, Sun J, Zhai Y, Jiang J, Lin J. 2019. Spatial and temporal analysis of severe fever with thrombocytopenia syndrome in Zhejiang Province, China, 2011–2015. J Infect Dev Ctries 13:35–43. doi:10.3855/jidc.10373. - DOI - PubMed
    1. Zhan J, Wang Q, Cheng J, Hu B, Li J, Zhan F, Song Y, Guo D. 2017. Current status of severe fever with thrombocytopenia syndrome in China. Virol Sin 32:51–62. doi:10.1007/s12250-016-3931-1. - DOI - PMC - PubMed

Publication types

MeSH terms