. 2021 Feb 16;12(1):1072.
doi: 10.1038/s41467-021-21227-y.

Positioning of nucleosomes containing γ-H2AX precedes active DNA demethylation and transcription initiation

Affiliations

Positioning of nucleosomes containing γ-H2AX precedes active DNA demethylation and transcription initiation

Stephanie Dobersch et al. Nat Commun. .

Abstract

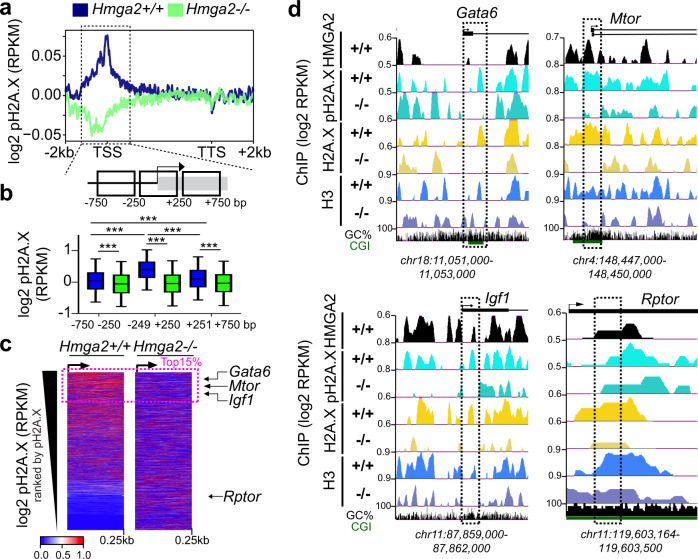
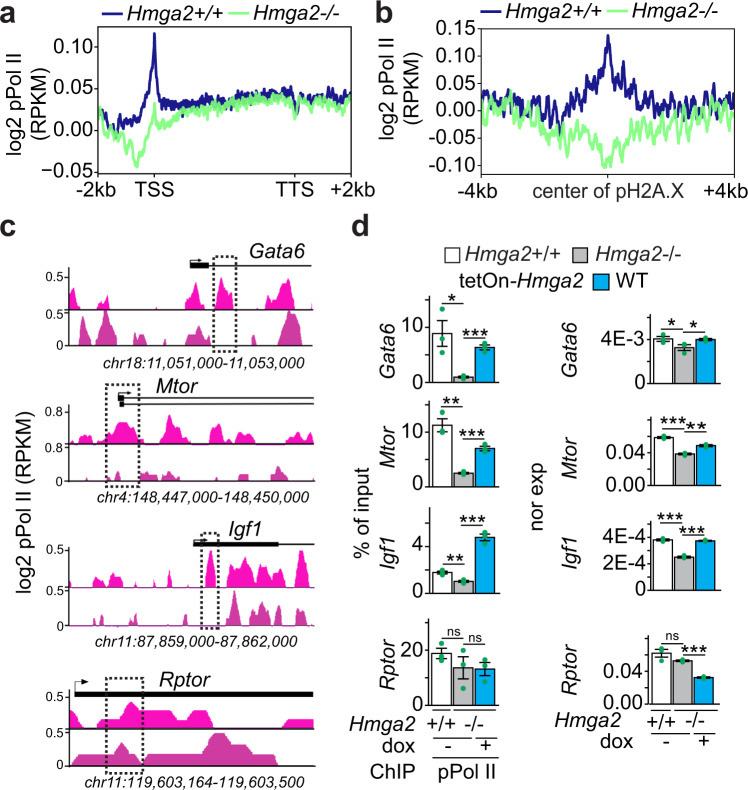
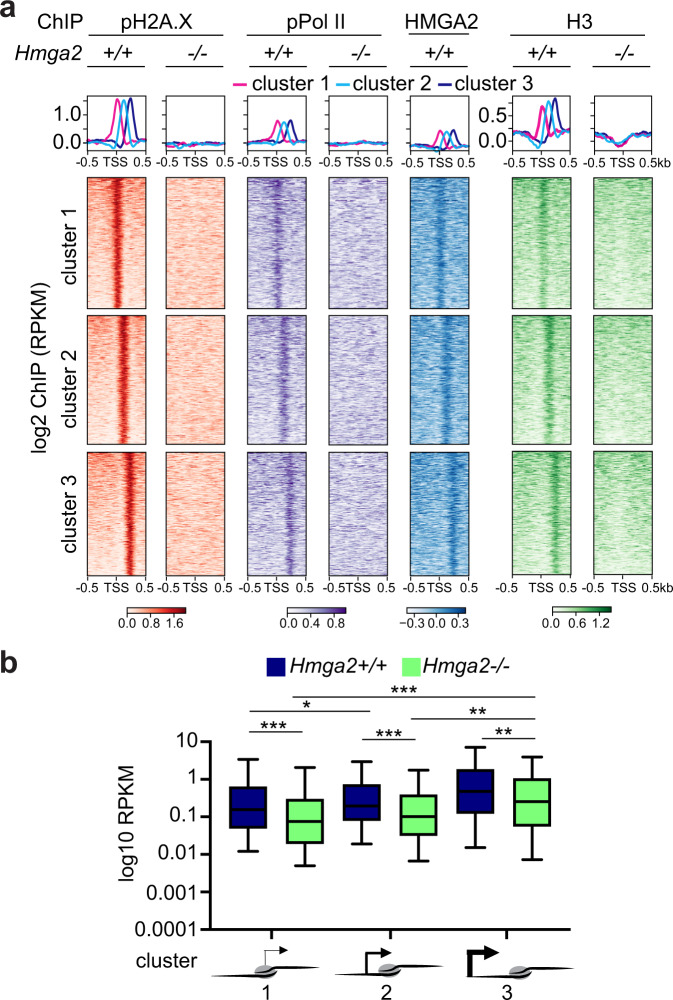
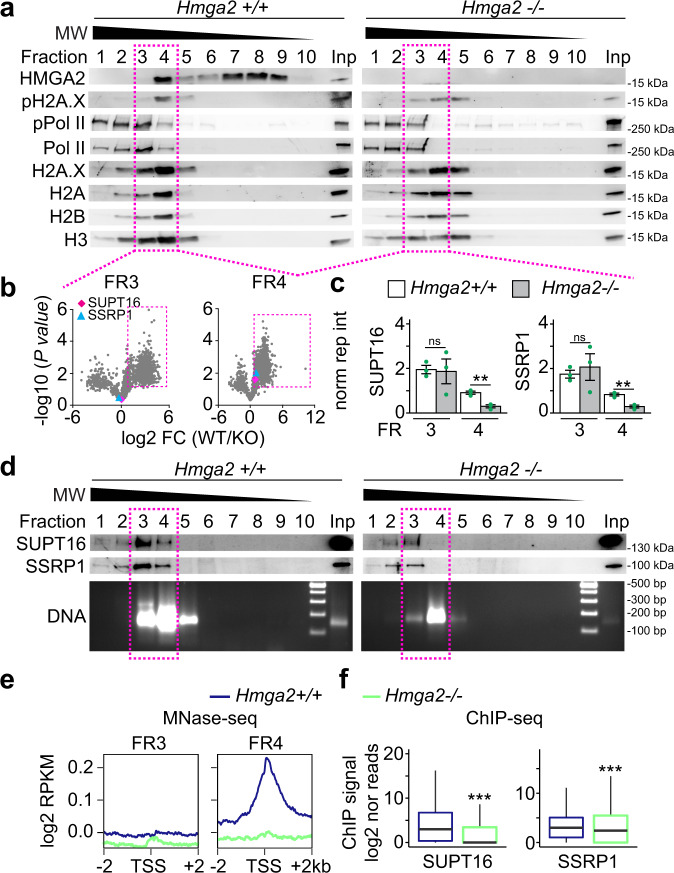
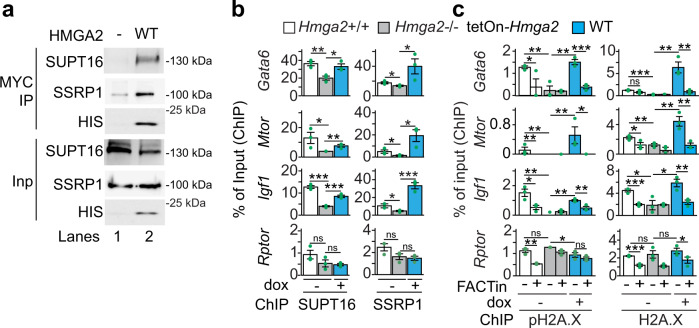
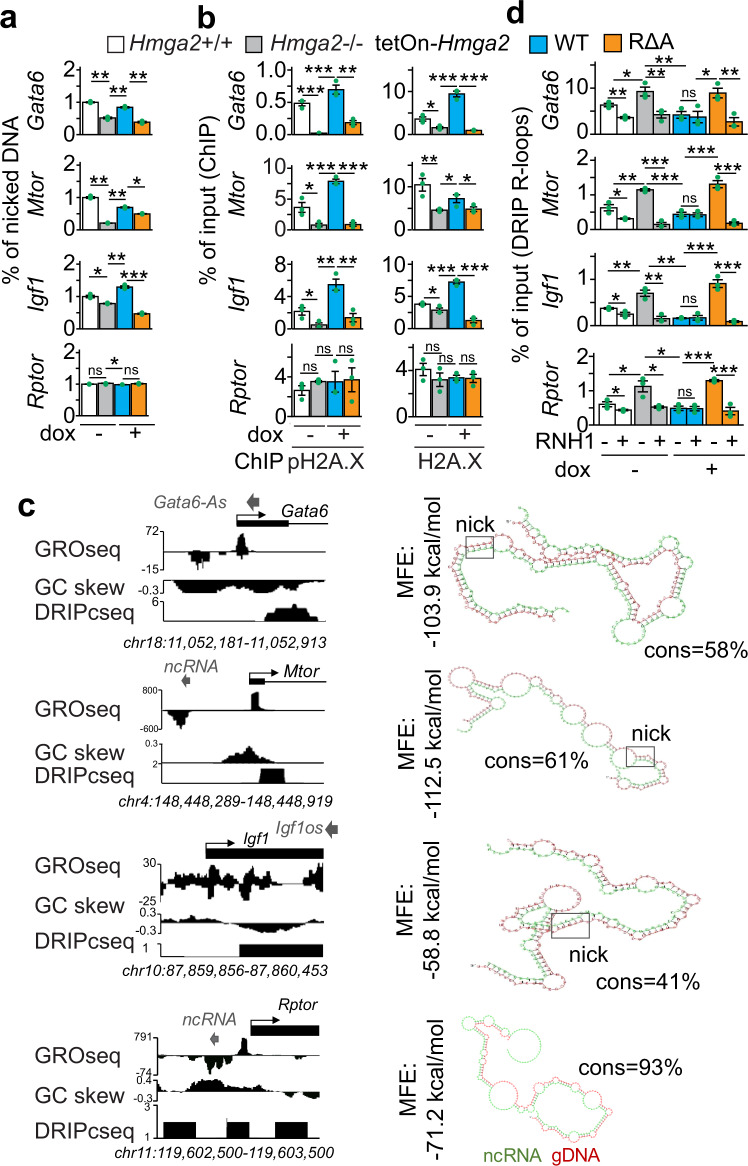
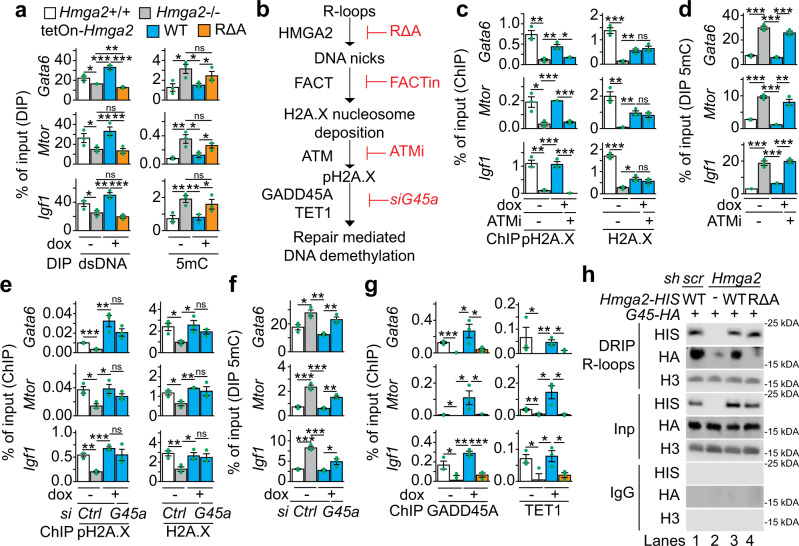
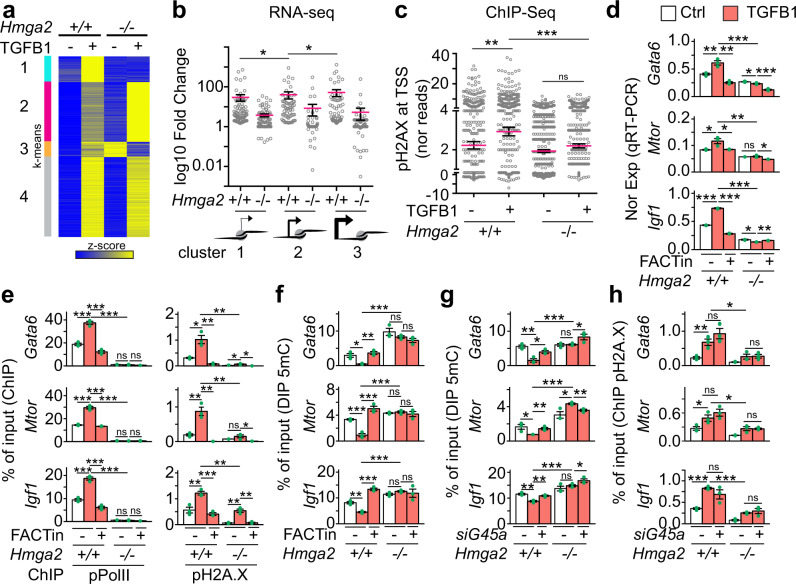
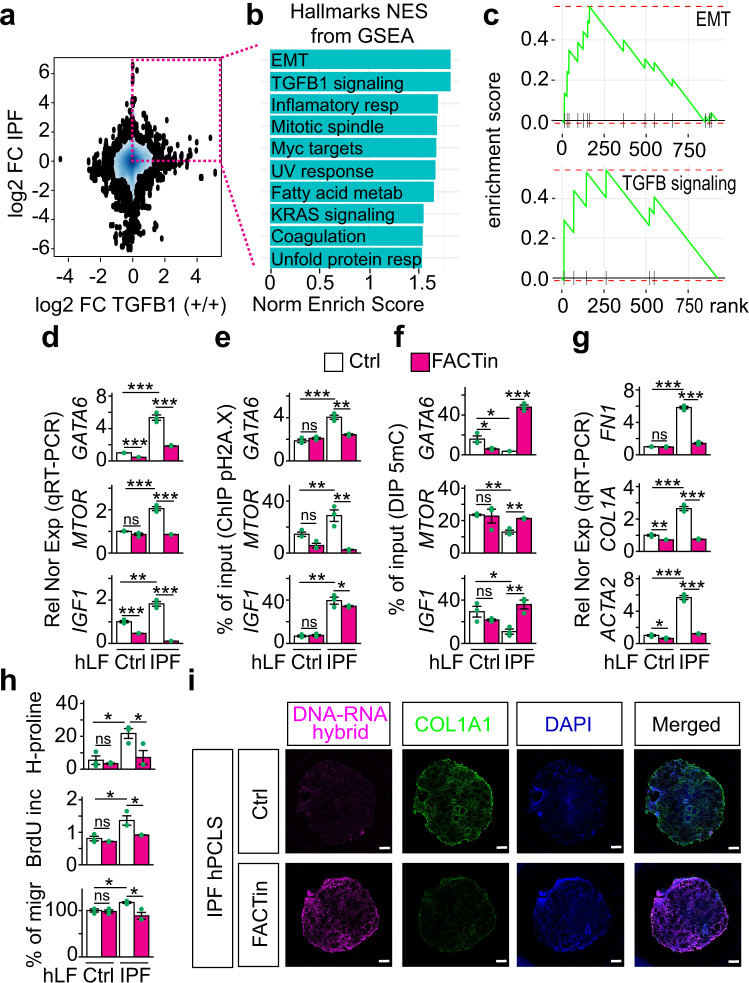
In addition to nucleosomes, chromatin contains non-histone chromatin-associated proteins, of which the high-mobility group proteins are the most abundant. Chromatin-mediated regulation of transcription involves DNA methylation and histone modifications. However, the order of events and the precise function of high-mobility group proteins during transcription initiation remain unclear. Here we show that high-mobility group AT-hook 2 protein (HMGA2) induces DNA nicks at the transcription start site, which are required by the histone chaperone FACT complex to incorporate nucleosomes containing the histone variant H2A.X. Further, phosphorylation of H2A.X at S139 (γ-H2AX) is required for repair-mediated DNA demethylation and transcription activation. The relevance of these findings is demonstrated within the context of TGFB1 signaling and idiopathic pulmonary fibrosis, suggesting therapies against this lethal disease. Our data support the concept that chromatin opening during transcriptional initiation involves intermediates with DNA breaks that subsequently require DNA repair mechanisms to ensure genome integrity.


Conflict of interest statement

G.B. was scientific advisor for a company in USA. The remaining authors declare that they have no competing interests.

Figures

Fig. 1
Fig. 1. HMGA2 is required for pH2A.X deposition at TSS.
a Aggregate plot for pH2A.X enrichment within the gene body ±2 kb of UCSC Known Genes in Hmga2+/+ and Hmga2/− MEF. ChIP-seq reads were normalized using reads per kilobase per million (RPKM) measure and are represented as log2 enrichment over their corresponding inputs. TSS, transcription start site; TTS, transcription termination site. Dotted square, ±750 bp region around the TSS. b Top, schematic representation of the genomic region highlighted in a. Bottom, box plot of pH2A.X enrichment in the genomic regions showed as squares at the top in Hmga2+/+ and Hmga2/− MEF. RPKM of the pH2A.X ChIP-seq were binned within each of these genomic regions and represented as log2. Box plots indicate median (middle line), 25th, 75th percentile (box) and 5th and 95th percentile (whiskers); n = 9522 genes enriched with pH2A.X; asterisks P-values after two-tailed Wilcoxon–Mann–Whitney test, ***P ≤ 0.001. c Heat map for pH2A.X enrichment at the TSS + 0.25 kb of UCSC Known Genes in Hmga2 + /+ and Hmga2/− MEF. Genes were ranked by pH2A.X enrichment in Hmga2 + /+ MEF. Doted square, the top 15% ranked genes, as well as Gata6, Mtor, Igf1 and Rptor were selected for further analysis. d Visualization of selected HMGA2 target genes using UCSC Genome Browser showing HMGA2 (black), pH2A.X (turquoise), H2A.X (yellow) and H3 (blue) enrichment in Hmga2+/+ and −/− MEF. ChIP-seq reads were normalized using RPKM measure and are represented as log2 enrichment over their corresponding inputs. Images show the indicated gene loci with their genomic coordinates. Arrows, direction of the genes; black boxes, exons; dotted squares, regions selected for single gene analysis. See also Supplementary Fig. 1. Source data are provided as a Source Data files 01 and 04.
Fig. 2
Fig. 2. Position of transcription initiating S5 phosphorylated RNA polymerase II at the TSS is Hmga2-dependent.
a, b Aggregate plots for phosphorylated serine 5 RNA polymerase II (pPol II) enrichment within the gene body ±2 kb of UCSC Known Genes (a) and in a ± 4 kb region respective to pH2A.X peaks (b) in Hmga2+/+ and Hmga2/− MEF. ChIP-seq reads were normalized using reads per kilobase per million (RPKM) measure and are represented as log2 enrichment over their corresponding inputs. TSS, transcription start site; TTS, transcription termination site. c Visualization of selected HMGA2 target genes using UCSC Genome Browser showing pPol II enrichment in Hmga2 + /+ and −/− MEF. ChIP-seq reads were normalized using RPKM measure and are represented as log2 enrichment over their corresponding inputs. Images represent the indicated gene loci with their genomic coordinates. Arrows, direction of the genes; black boxes, exons; dotted squares, regions selected for single gene analysis. d Analysis of selected HMGA2 target genes. Left, ChIP of Gata6, Mtor, Igf1 and Rptor after pPol II immunoprecipitation in Hmga2 + /+ and Hmga2−/− MEF. Right, qRT-PCR-based, Tuba1a-normalized expression analysis under the same conditions. Bar plots presenting data as means; error bars, s.e.m (n = 3 biologically independent experiments); asterisks, P-values after two-tailed t-test, ***P ≤ 0.001; **P ≤ 0.01; *P ≤ 0.05. See also Supplementary Figs. 1–2 . Source data are provided as a Source Data files 01 and 04.
Fig. 3
Fig. 3. Position of first nucleosome containing pH2A.X correlates with RNA polymerase II and basal transcription activity in Hmga2-dependent manner.
a Aggregate plots (top) and heat maps (bottom) for pPol II, pH2A.X, HMGA2 and H3 enrichment at the TSS ± ≥ kb of the top 15% candidates in Hmga2 + /+ and Hmga2−/− MEF. Three clusters were generated using k-means algorithm. Genes were sorted based on the enrichment of pH2A.X in Hmga2 + /+ MEF. b Box plot representing the basal transcription activity (as log2 RPKM) of genes in Hmga2 + /+ and Hmga2−/− MEF. The genes were sorted in three groups based on the position of the first pH2A.X-containing nucleosome 5´ to the TSS. Box plots indicate median (middle line), 25th, 75th percentile (box) and 5th and 95th percentile (whiskers); n = 154 genes in position cluster 1; n = 132 genes in position cluster 2; n = 134 genes in position cluster 3; asterisks, P-values after one-tailed Wilcoxon–Mann–Whitney test, ***P ≤ 0.001; **P ≤ 0.01; *P ≤ 0.05. See also Supplementary Figs. 1 and 2. Source data are provided as a Source Data files 01 and 04.
Fig. 4
Fig. 4. HMGA2 is required for enrichment of the FACT complex at TSS.
ae Native chromatin from Hmga2 + /+ and −/− MEF was digested with micrococcal nuclease (MNase) and fractionated by sucrose gradient ultracentrifugation (SGU). a The obtained fractions were analyzed by WB using the indicated antibodies. Representative images from three independent experiments. MW, molecular weight, kDa, kilo Dalton. Inp, input represents 0.5% of the material used for SGU. Square, fractions selected for further analysis. b Mass spectrometry analysis of proteins in fractions 3 and 4. Volcano plot representing the significance (−log10 P-values after one-tailed t-test) vs. intensity fold change between Hmga2 + /+ and −/− MEF (log2 of means intensity ratios from three independent experiments). Square, proteins with log2 fold change >1.65. Diamond, SUPT16; triangle, SSRP1. c Bar plots showing normalized reporter intensity of SUPT16 (left) and SSRP1 (right) in fractions 3 and 4 of the SGU in a. Data are shown as means ± s.e.m. (n = 3 biologically independent experiments); asterisks, P-values after two-tailed t-Test, **P ≤ 0.01; ns, non-significant. d Top, WB analysis as in a using antibodies specific for components of the FACT complex. Bottom, DNA was isolated from the fractions obtained by SGU in A and analyzed by agarose gel electrophoresis. Representative images from three independent experiments. Square, fractions selected for MNase-seq. e MNase-seq of fractions 3 and 4 of the SGU in a. Aggregate plots representing the enrichment over input (as log2 RPKM) of genomic sequences relative to the TSS ± 2 kb. f Box plots of ChIP-seq-based SUPT16 (left) and SSRP1 (right) enrichment analysis within the TSS + 0.5 kb of the top 15% candidates in Hmga2 + /+ and −/− MEF. Values are represented as log2 of mapped reads that were normalized to the total counts and the input was subtracted. Box plots indicate median (middle line), 25th, 75th percentile (box) and 5th and 95th percentile (whiskers); n = 9522 genes enriched with pH2A.X; asterisks, P-values after two-tailed Mann–Whitney test, ***P ≤ 0.001. See also Supplementary Figs. 2 and 3. Source data are provided as a Source Data files 01 and 02.
Fig. 5
Fig. 5. HMGA2 -FACT interaction is required for pH2A.X deposition.
a Western blot using the indicated antibodies after co-immunoprecipitation (Co-IP) assay using nuclear protein extracts from Hmga2−/− MEF that were non-transfected (−) or stably transfected with Hmga2-myc-his (WT) and magnetic beads coated with MYC-specific antibodies. Representative images from three independent experiments. Input, 5% of IP starting material. b, c ChIP-based promoter analysis of selected HMGA2 target genes using the indicated antibodies and chromatin from Hmga2 + /+, Hmga2−/− MEF, as well as Hmga2−/− MEF that were stably transfected with a tetracycline-inducible expression construct (tetOn) for WT Hmga2-myc-his. MEF were treated with doxycycline and FACT inhibitor (FACTin; CBLC000 trifluoroacetate) as indicated. In all bar plots, data are shown as means ± s.e.m. (n = 3 biologically independent experiments); asterisks, P-values after one-tailed t-Test, ***P ≤ 0.001; **P ≤ 0.01; *P ≤ 0.05; ns, non-significant. See also Supplementary Fig. 5. Source data are provided as a Source Data files 01 and 02.
Fig. 6
Fig. 6. HMGA2-lyase activity is required for pH2A.X deposition and solving of R-loops.
a Analysis of single-strand DNA breaks at promoters of selected HMGA2 target genes using genomic DNA from Hmga2 + /+, Hmga2−/− MEF, as well as Hmga2−/− MEF that were stably transfected with a tetracycline-inducible expression construct (tetOn) either for WT Hmga2-myc-his or the lyase-deficient mutant RΔA Hmga2-myc-his. MEF were treated with doxycycline as indicated. b ChIP-based promoter analysis of selected HMGA2 target genes using the indicated antibodies and chromatin from MEF as in a. c Left, Genome-browser visualization of selected HMGA2 target genes showed nascent RNA (GRO-seq) in WT MEF, GC-skew and RNA-seq on plus-strand after DNA-RNA hybrid immunoprecipitation (DRIPc-seq) in NIH/3T3 mouse fibroblasts. Images represent mapped sequence tag densities relative to the indicated loci. Genomic coordinates are shown at the bottom. Arrow heads, non-coding RNAs in antisense orientation; Arrows, direction of the genes; black boxes, exons. Right, in silico analysis revealed complementary sequences between the identified antisense ncRNA (green) and genomic sequences at the TSS of the corresponding mRNAs (red) with relatively favorable minimum free energy (MFE) and high percentage of complementarity (cons), supporting the formation of DNA-RNA hybrids containing a nucleotide sequence that favors DNA nicks (squares). d Analysis of selected HMGA2 target genes by DNA–RNA immunoprecipitation (DRIP) using the antibody S9.6 and nucleic acids isolated from MEF treated as in a. Prior IP, nucleic acids were digested with RNase H1 (RNH1) as indicated. In all bar plots, data are shown as means ± s.e.m. (n = 3 biologically independent experiments); asterisks, P-values after two-tailed t-Test, ***P ≤ 0.001; **P ≤ 0.01; *P ≤ 0.05; ns, non-significant. See also Supplementary Figs. 5–7. Source data are provided as a Source Data file 01.
Fig. 7
Fig. 7. HMGA2-FACT-ATM-pH2A.X axis is required to solve R-loops and induce DNA demethylation.
a DNA immunoprecipitation (DIP) based promoter analysis of selected HMGA2 target genes using antibodies specific for double-stranded DNA (dsDNA) or 5-methylcytosine (5mC) and genomic DNA from Hmag2 + /+, Hmag2−/− MEF, as well as Hmga2−/− MEF that were stably transfected with a tetracycline-inducible expression construct (tetOn) for either WT Hmga2-myc-his or the lyase-deficient mutant RΔA Hmga2-myc-his. MEF were treated with doxycycline as indicated. b Schematic representation of the sequential order of events during transcription activation mediated by the HMGA2-FACT-ATM-pH2A.X axis. c ChIP-based promoter analysis of selected HMGA2 target genes using the indicated antibodies and chromatin from MEF treated as in a. In addition, MEF were treated with ATM inhibitor (ATMi; KU-55933) as indicated. d DIP-based promoter analysis as in a, using 5mC-specific antibodies. In addition, MEF were treated with ATMi as indicated. e ChIP-based promoter analysis of selected HMGA2 target genes using the indicated antibodies and chromatin from MEF treated as in a. In addition, MEF were transfected with control (Ctrl) or Gadd45a-specific small interfering RNA (siRNA) as indicated. f DIP-based promoter analysis as in a, using 5mC-specific antibodies. In addition, MEF were transfected with Ctrl or Gadd45a-specific siRNA as indicated. g ChIP-based promoter analysis of selected HMGA2 target genes using the indicated antibodies and chromatin from MEF treated as in a. h WB analysis using antibodies specific for HIS-tag, HA-tag and H3 after DRIP using the antibody S9.6 and chromatin isolated from MLE-12 cells that were stably transfected either with a control (scramble, scr) or an Hmga2-specific short hairpin DNA (sh) construct and transiently transfected with WT Hmga2-myc-his or the lyase-deficient mutant RΔA Hmga2-myc-his and Gadd45-HA as indicated. Representative image from two independent experiments. Input (Inp), 5% of IP starting material; immunoglobulin G (IgG), negative control. In all bar plots, data are shown as means ± s.e.m. (n = 3 biologically independent experiments); asterisks, P-values after one-tailed t-test, ***P ≤ 0.001; **P ≤ 0.01; *P ≤ 0.05; ns, non-significant. See also Supplementary Fig. 8. Source data are provided as a Source Data files 01 and 02.
Fig. 8
Fig. 8. HMGA2-FACT-ATM-pH2A.X axis mediates TGFB1 induced transcription activation.
a Heat map showing RNA-seq-based expression analysis of TGFB1-inducible genes in Hmga2 + /+ and Hmga2−/− MEF non-treated or treated with TGFB1. Data were normalized by Z score transformation and clustered using k-means algorithm. b Dot plot presenting the RNA-seq-based expression analysis of cluster 1 genes from A as log10 fold change between TGFB1-treated and non-treated MEF. Genes were grouped into the position clusters identified in Fig. 3a. Each dot represents the value of a single gene; n = 95 genes in position cluster 1; n = 64 genes in position cluster 2; n = 78 genes in position cluster 3; red line, average; error bars, s.e.m.; asterisks, P-values after one-tailed Mann–Whitney Test, *P ≤ 0.05. c Dot plot presenting ChIP-seq-based pH2A.X enrichment analysis in the top 15% candidates from Fig. 1c using chromatin from MEF treated as in a. For each gene, normalized reads in the TSS + 0.25 kb region were binned and the maximal value was plotted. Inputs were subtracted from the corresponding samples. Red line, average; n = 640 genes; error bars, s.e.m.; asterisks, P-values after one-tailed Mann–Whitney test, ***P ≤ 0.001; **P ≤ 0.01; ns, non-significant. d qRT-PCR-base expression analysis of HMGA2 target genes in Hmag2 + /+, Hmag2−/− MEF that were non-treated (Ctrl) or treated with TGFB1 and FACT inhibitor (FACTin; CBLC000 trifluoroacetate) as indicated. e ChIP-based promoter analysis of selected HMGA2 target genes using the indicated antibodies and chromatin from MEF treated as in d. f DIP-based promoter analysis of selected HMGA2 target genes using antibodies specific for 5-methylcytosine (5mC) and genomic DNA from MEF treated as in d. g DIP-based promoter analysis of selected HMGA2 target genes using the indicated antibodies and genomic DNA from Hmag2 + /+ or Hmag2−/− MEF that were transfected with control (−) or Gadd45a-specific small interfering RNA (siRNA) as indicated. h ChIP-based promoter analysis of selected HMGA2 target genes using pH2A.X-specific antibodies and chromatin from MEF treated as in g. In all bar plots, data are shown as means ± s.e.m. (n = 3 biologically independent experiments); asterisks, P-values after two-tailed t-test, ***P ≤ 0.001; **P ≤ 0.01; *P ≤ 0.05; ns, non-significant. See also Supplementary Fig. 9. Source data are provided as a Source Data files 01 and 04.
Fig. 9
Fig. 9. Inhibition of the FACT complex counteracts fibrosis hallmarks in IPF.
a RNA-seq-based comparison of gene expression in IPF and after TGFB1 treatment. 2D Kernel Density plot representing the log2 fold change between gene expression in primary human lung fibroblasts (hLF) from IPF patients vs. control donors on the y-axis and log2 fold change between gene expression in Hmga2 + /+ MEF treated with TGFB1 vs. non-treated on the x-axis. Square, genes with log2 FC > 0.58 and P ≤ 0.05 in both, hLF IPF and TGFB1-treated MEF. P-values after Wald test. b Gene set enrichment analysis (GSEA) using the normalized enrichment scores (NES) of genes inside the square in a. EMT, epithelial-mesenchymal transition; resp, response. c GSEA line profile of the top two enriched pathways in b. d qRT-PCR-based expression analysis of selected HMGA2 target genes in hLF from control donors (Ctrl) or IPF patients that were non-treated (Ctrl) or treated FACT inhibitor (FACTin; CBLC000 trifluoroacetate) as indicated. e ChIP-based promoter analysis of selected HMGA2 target genes using pH2A.X-specific antibodies and chromatin from hLF treated as in d. f DIP-based promoter analysis of selected HMGA2 target genes using 5mC-specific antibodies and genomic DNA from hLF treated as in d. g qRT-PCR-based expression analysis of fibrotic markers in hLF treated as in d. FN1, fibronectin; COL1A1, collagen; ACTA2, smooth muscle actin alpha 2. h Functional assays for IPF hallmarks in Ctrl or IPF hLF treated as in d. Top, hydroxyproline assay for collagen content. Middle, proliferation assay by BrdU incorporation. Bottom, Transwell invasion assay. i Representative pictures from confocal microscopy after immunostaining using the antibody S9.6 or COL1A1-specific antibody in human precision-cut lung slices (hPCLS) from IPF patients (n = 3 biologically independent experiments). The hPCLS were treated as in d. DAPI, nucleus. Scale bars, 500 μm. In all bar plots, data are shown as means ± s.e.m. (n = 3 biologically independent experiments); asterisks, P-values after tow-tailed t-test, ***P ≤ 0.001; **P ≤ 0.01; *P ≤ 0.05; ns, non-significant. See also Supplementary Fig. 10. Source data are provided as a Source Data files 01 and 04.

References

    1. Hall MA, et al. High-resolution dynamic mapping of histone-DNA interactions in a nucleosome. Nat. Struct. Mol. Biol. 2009;16:124–129. doi: 10.1038/nsmb.1526. - DOI - PMC - PubMed
    1. Ozturk N, Singh I, Mehta A, Braun T, Barreto G. HMGA proteins as modulators of chromatin structure during transcriptional activation. Front Cell Dev. Biol. 2014;2:5. doi: 10.3389/fcell.2014.00005. - DOI - PMC - PubMed
    1. Bonisch C, Hake SB. Histone H2A variants in nucleosomes and chromatin: more or less stable? Nucleic Acids Res. 2012;40:10719–10741. doi: 10.1093/nar/gks865. - DOI - PMC - PubMed
    1. Gaume X, Torres-Padilla ME. Regulation of reprogramming and cellular plasticity through histone exchange and histone variant incorporation. Cold Spring Harb. Symposia Quant. Biol. 2015;80:165–75. doi: 10.1101/sqb.2015.80.027458. - DOI - PubMed
    1. Rogakou EP, Pilch DR, Orr AH, Ivanova VS, Bonner WM. DNA double-stranded breaks induce histone H2AX phosphorylation on serine 139. J. Biol. Chem. 1998;273:5858–5868. doi: 10.1074/jbc.273.10.5858. - DOI - PubMed

Publication types

MeSH terms