. 2021 Feb 16;12(1):1045.
doi: 10.1038/s41467-021-21357-3.

ZMYND11-MBTD1 induces leukemogenesis through hijacking NuA4/TIP60 acetyltransferase complex and a PWWP-mediated chromatin association mechanism

Affiliations

ZMYND11-MBTD1 induces leukemogenesis through hijacking NuA4/TIP60 acetyltransferase complex and a PWWP-mediated chromatin association mechanism

Jie Li et al. Nat Commun. .

Abstract

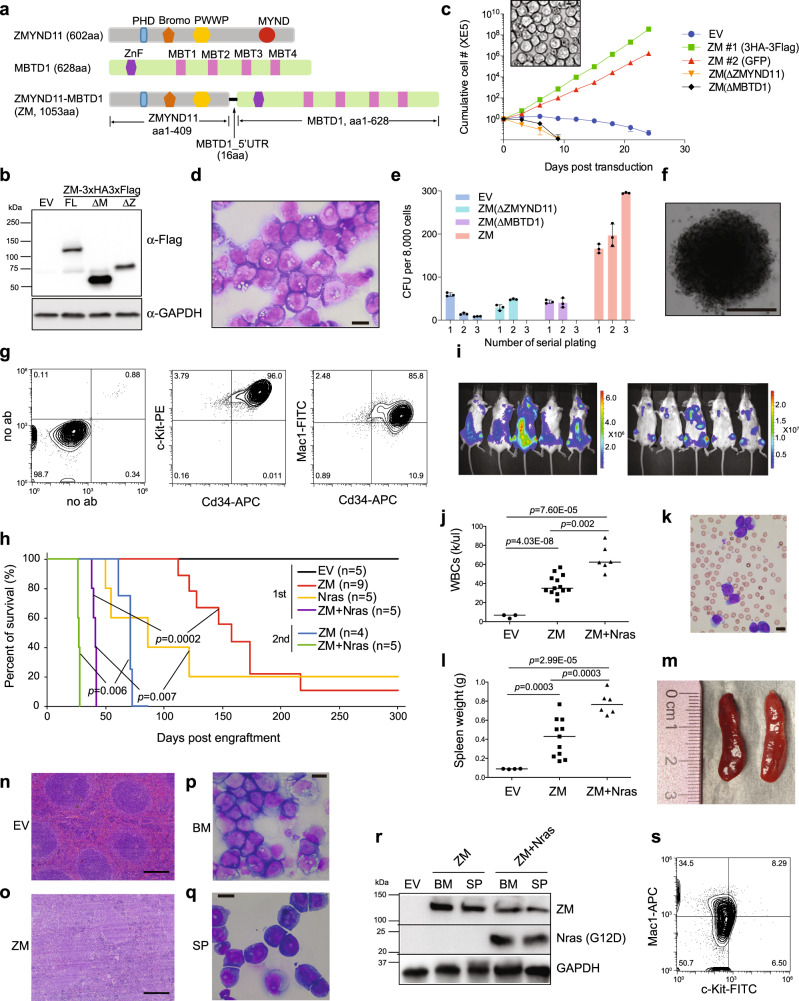
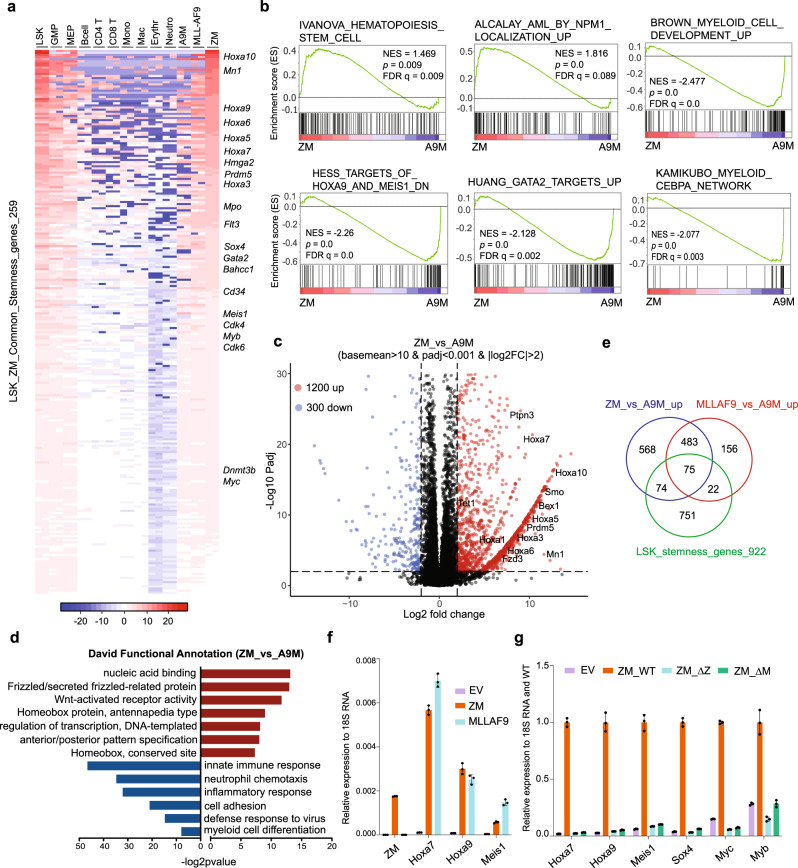
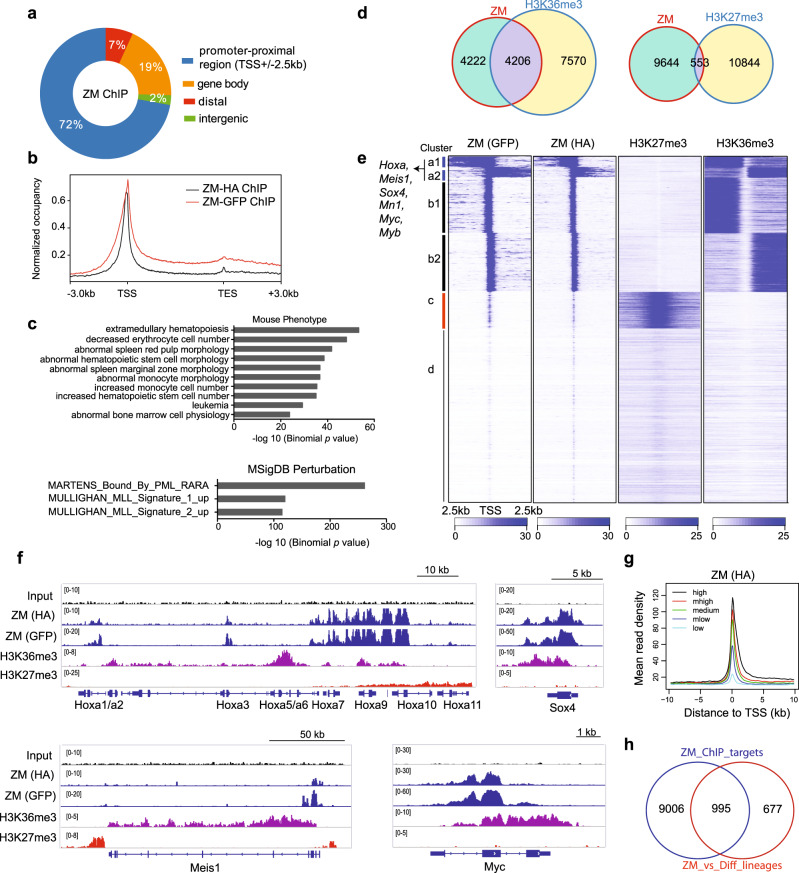
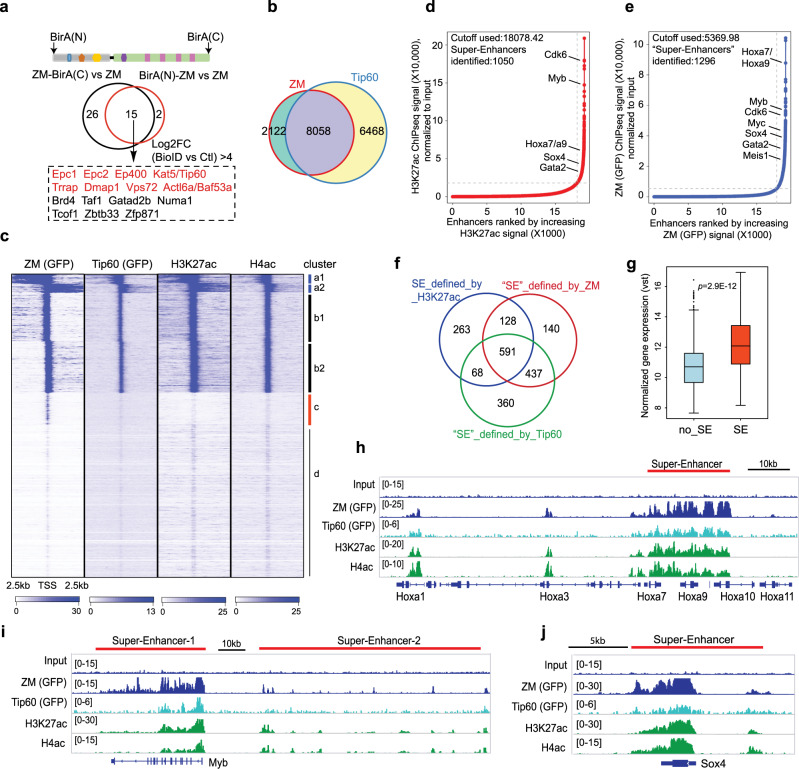
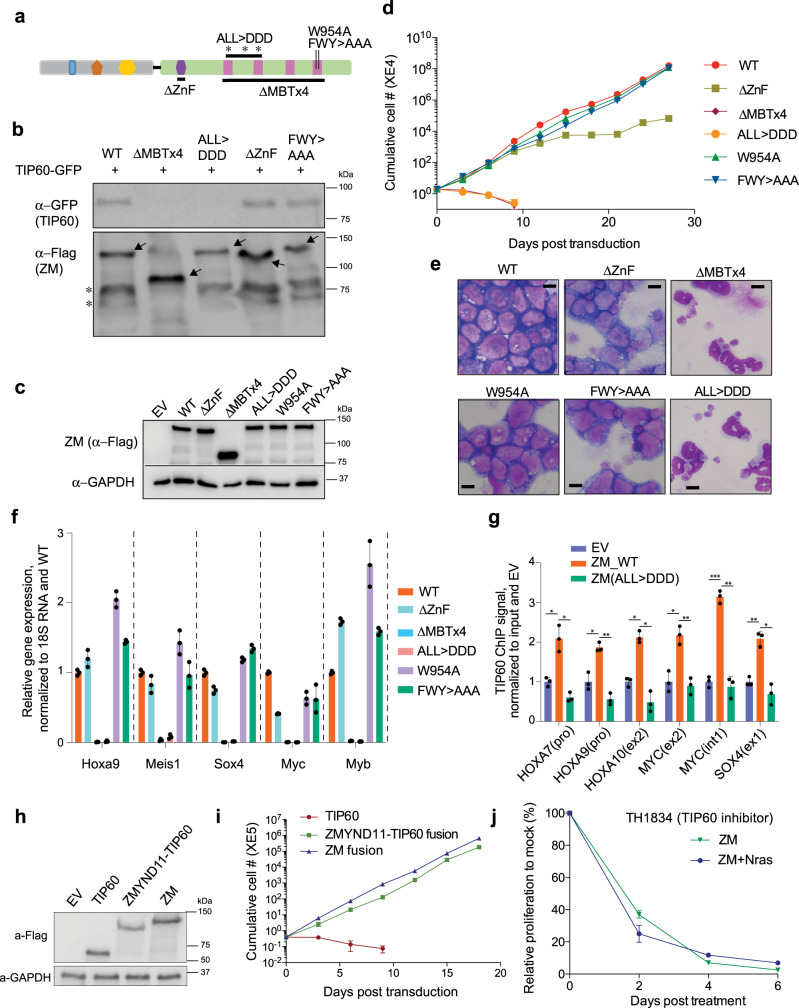
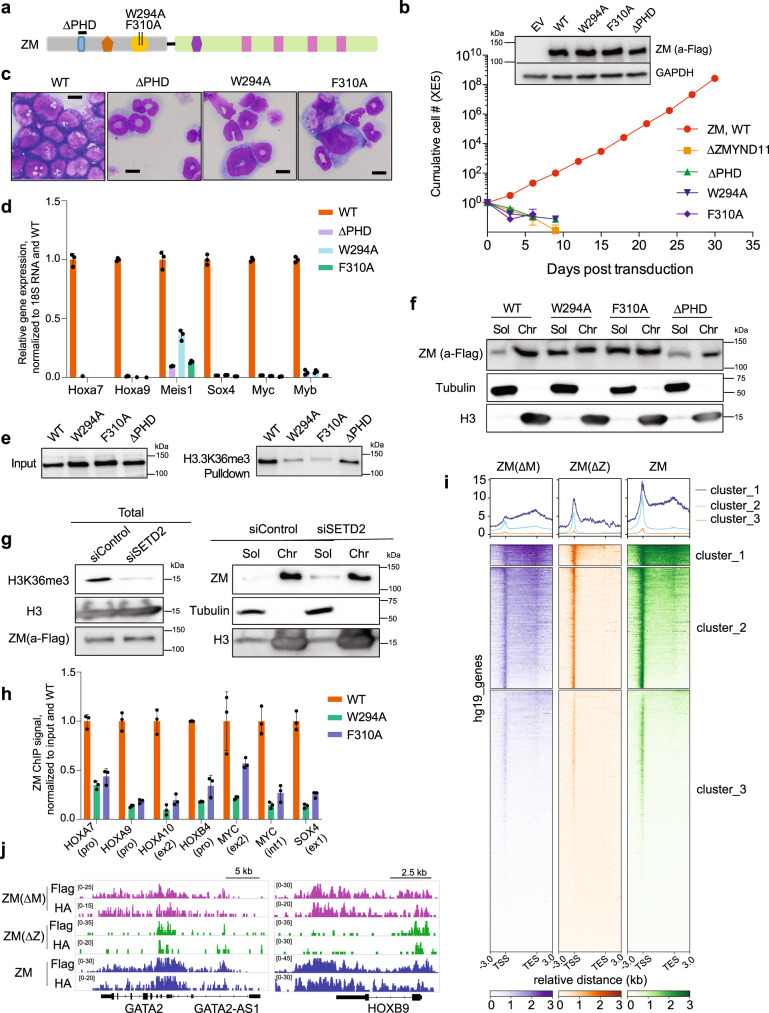
Recurring chromosomal translocation t(10;17)(p15;q21) present in a subset of human acute myeloid leukemia (AML) patients creates an aberrant fusion gene termed ZMYND11-MBTD1 (ZM); however, its function remains undetermined. Here, we show that ZM confers primary murine hematopoietic stem/progenitor cells indefinite self-renewal capability ex vivo and causes AML in vivo. Genomics profilings reveal that ZM directly binds to and maintains high expression of pro-leukemic genes including Hoxa, Meis1, Myb, Myc and Sox4. Mechanistically, ZM recruits the NuA4/Tip60 histone acetyltransferase complex to cis-regulatory elements, sustaining an active chromatin state enriched in histone acetylation and devoid of repressive histone marks. Systematic mutagenesis of ZM demonstrates essential requirements of Tip60 interaction and an H3K36me3-binding PWWP (Pro-Trp-Trp-Pro) domain for oncogenesis. Inhibitor of histone acetylation-'reading' bromodomain proteins, which act downstream of ZM, is efficacious in treating ZM-induced AML. Collectively, this study demonstrates AML-causing effects of ZM, examines its gene-regulatory roles, and reports an attractive mechanism-guided therapeutic strategy.


Conflict of interest statement

G.G.W. received research fund from the Deerfield Management/Pinnacle Hill Company. The remaining authors declare no competing interests.

Figures

Fig. 1
Fig. 1. ZMYND11-MBTD1 (ZM), a human AML-associated chimeric gene, induces immortalization of murine HSPCs in vitro and causes AML in vivo.
a Scheme showing domain structures of ZMYND11, MBTD1 and the AML-associated ZM fusion. b Immunoblotting for ZM, either full-length (WT) or with its ZMYND11 or MBTD1 segment deleted (ΔZ or ΔM), post-transduction into murine HSPCs. c Proliferation kinetics of murine HSPCs transduced with empty vector (EV) or the indicated ZM (either WT, ΔZ or ΔM) in liquid culture (n = 3 biological replicates per group; data presented as mean ± SD). Insert shows a typical light micrograph of WT ZM-immortalized progenitors (scale bar = 10 um). d Wright-Giemsa staining of WT ZM-immortalized progenitors (scale bar = 10 um). e Quantification of colony-forming units (CFU, n = 3 biological replicates per group, with data presented as mean ± SD) formed by HSPCs stably transduced with either EV or indicated ZM. f Representative colony of HSPCs expressing WT ZM at the third replating of CFU assays (scale bar = 1 mm). g FACS of WT ZM-immortalized progenitors. h Kaplan–Meier survival curve of syngeneic mice post-transplantation of either HSPCs transduced by EV or the indicated gene (in the first injection group) or bone marrow cells isolated from leukemic mice (in the secondary injection group). n = cohort size; the p values were calculated by two-sided log-rank test. i Bioluminescence images of mice, with dorsal and ventral views shown on the left and right respectively, 8 weeks post-transplantation of HSPCs coexpressing ZM and a luciferase reporter. j, k Summary of white blood cell counts (WBC; j) and a representative Wright-Giemsa staining image of blood smear (ZM alone, k; scale bar = 10 μm) using peripheral blood prepared from recipient mice at their terminal stage of AMLs induced by either ZM alone (middle) or coexpression of ZM plus NrasG12D (right), relative to mock-treated controls (left, EV). The p values (panel j; n = 3, 13, and 6 mice for EV, ZM and ZM + Nras group, respectively) were calculated by two-sided Student’s t test. l, m Summary of spleen weight (l) and image showing enlarged spleens (ZM alone, m) of leukemic mice induced by either ZM alone (middle) or coexpression of ZM plus NrasG12D(right), relative to mock (left). The p values (panel l; n = 4, 11, and 6 mice for EV, ZM and ZM + Nras group, respectively) were calculated by two-sided Student’s t test. n, o H&E staining of spleen from the indicated cohort, either mock-treated (EV, n) or with ZM-induced AML (o), scale bar = 200 um. p, q Wright-Giemsa staining of cells derived from bone marrow (BM, p) and spleen (SP, q) from mice in the ZM cohort that developed full-blown AML (scale bar = 10 um). r Immunoblotting for ZM (anti-Flag, top) and NrasG12D mutant (anti-Flag, middle) in the bone marrow-and spleen-derived leukemic cells isolated from the indicated cohort. s FACS of ZM-induced primary AML cells isolated from bone marrow.
Fig. 2
Fig. 2. ZM enforces aberrant activation of a pro-leukemic stemness gene-expression program including Hoxa, Meis1, Sox4, Myc and Myb.
a Heatmap of 259 genes showing higher expression in both normal LSK (Lin-/Sca1+/c-Kit+) and ZM-immortalized murine AML cells, relative to mature blood cell types. Expression values represent mean-centered log2(TPM). Genes are sorted in a descending order based on their expression values in ZM+ AML cells. A9M and MLL-AF9 represent the murine AML lines established by the coexpressed Hoxa9 plus Meis1a (A9M) and MLL-AF9, respectively. b GSEA shows enrichment of the HSC-related and mutant-NPM1-upregulated genes in ZM+ relative to A9M+ cells, as well as enrichment of genes upregulated upon myeloid differentiation or the indicated TF-related transcripts in A9M+ relative to ZM+ cells. The p value (n = 15,282 genes per group) was calculated by an empirical phenotype-based permutation test. The FDR is adjusted for gene set size and multiple hypotheses testing while the p value is not. c Volcano plot displays differentially expressed genes (DEGs) identified in ZM+ versus A9M+ AML cells. The up- and down-regulated DEGs, defined with the indicated cutoff, are represented by red and blue dots, respectively, with example stemness-related genes highlighted. d DAVID functional annotation of DEGs identified in ZM+ versus A9M+ AML cells, with the enriched terms for upregulated (n = 1200 genes) and downregulated (n = 300 genes) DEGs indicated by red bars and blue bars, respectively. The p value was calculated by Fisher’s Exact test. e Venn diagram showing overlaps among ZM-upregulated genes (versus A9M), MLL-AF9-upregulated genes (relative to A9M), and LSK stemness genes. f RT-PCR of Hoxa7, Hoxa9 and Meis1 in ZM- and MLL-AF9-transformed AML cells. qPCR signals from three independent experiments were normalized to those of 18S RNA and presented as mean ± SD. g RT-PCR of AML-related proto-oncogenes in murine HSPCs post-transduction of EV or the indicated ZM. qPCR signals from three independent experiments were normalized to those of 18S RNA and then WT ZM and presented as mean ± SD.
Fig. 3
Fig. 3. ChIP-seq reveals positive correlation between ZM binding and transcriptional activation of target genes, including oncogenic transcription factors (TFs) such as Hoxa, Meis1, Myc, Myb and Sox4.
a Genomic distribution of ZM peaks (n = 16,114; common to ZM HA and GFP ChIP) identified by ChIP-seq in ZM-transformed AML cells. b Average genome-wide ZM occupancy over transcription units, covering region from −3 kb upstream of transcriptional start site (TSS) to +3 kb downstream of transcriptional end site (TES). c Genomic Regions Enrichment of Annotations Tool (GREAT) analyses identifying enrichments of the indicated gene signatures among the called ZM peaks (n = 16,114 peaks). The p value was calculated by binomial test. d Venn diagram displaying overlap between the indicated ChIP-seq peaks in ZM-transformed AML cells. e Heatmaps showing the indicated ChIP-seq read densities over promoter-proximal regions centered at TSS after k-means clustering. Four clusters (labeled as a to d) were produced based on their distinct ZM ChIP-seq signals. TSSs on the two DNA strands are labeled as 1 and 2 (such as a1/2 and b1/2), respectively. f IGV views of the indicated normalized ChIP-seq signals at AML-related proto-oncogene loci. The read counts were first normalized to 1x genome coverage (reads per genome coverage, RPGC) and then normalized to input. g Average ZM ChIP-seq signals at TSSs grouped by gene expression levels as revealed by RNA-seq, indicating a positive correlation. Genes were equally divided into 5 groups from high, medium high (“mhigh”), medium, medium low (“mlow”), to low expression. h Venn diagram showing overlap between ZM-activated genes and those directly bound by ZM.
Fig. 4
Fig. 4. ZM interacts with the NuA4/Tip60 complex, generating super-enhancers characterized by dense histone acetylation, typically seen at proto-oncogenes.
a Venn diagram shows the ZM-interacting proteins (bottom panel, within dashed frame) identified from two independent experiments of BioID followed by mass spectrometry using murine HSPCs transduced with ZM tagged by a BirA ligase at either its N-terminus or C-terminus (top panel). HSPCs immortalized by ZM without a BirA tag were used as negative control (with a cutoff of log2[fold-change]>4). b Venn diagram displaying overlap between ZM and Tip60 ChIP-seq peaks. c Clustered heatmaps showing co-localization of ZM, Tip60, H3K27ac and H4ac at promoter-proximal regions (+/−2.5 kb from TSS) in ZM-transformed AML cells. Four clusters (labeled as a to d, same as Fig. 3e) were produced based on their distinct ZM ChIP-seq signals. TSSs on the two DNA strands are labeled as 1 and 2 (such as a1/2 and b1/2), respectively. d, e Hockey-stick plot shows distribution of input-normalized ChIP-seq signals of H3K27ac (d) or ZM (e) across all enhancers annotated by H3K27ac peaks (promoter-proximal regions or TSS +/−2.5 kb were excluded). Representative proto-oncogenes associated with super-enhancers (SEs), called by ROSE,, are indicated. f Venn diagram illustrates overlaps among SEs called based on H3K27ac, ZM or Tip60 ChIP-seq signals. g Boxplot showing overall expression levels of genes directly upregulated by ZM, either SE-associated (n = 101) or without SE (no_SE, n = 895). The p value was calculated by two-sided Student’s t test. The line in the middle of the box marks the median. The vertical size of box denotes the interquartile range (IQR). The upper and lower hinges correspond to the 25th and 75th percentiles. The upper and lower whiskers extend to the maximum and minimum values that are within 1.5 × IQR from the hinges. Outliers beyond the whiskers are plotted as circles. hj IGV view of normalized ChIP-seq signals at the indicated gene. SEs defined by H3K27ac are depicted with a red bar. The read counts were first normalized to RPGC and then normalized to input.
Fig. 5
Fig. 5. Recruitment of the NuA4/Tip60 complex is essential for ZM-induced target gene activation and oncogenic transformation.
a Scheme showing the used mutations at ZM’s MBDT1 segment. ALL > DDD and FWY > AAA indicate mutations of A661D/L684D/L688D and F951A/W954A/Y958A, respectively. b CoIP for assessing interaction between the indicated 3XHA-3XFlag-tagged ZM and GFP-tagged Tip60 in 293 T cells. c Immunoblotting for ZM (3XHA-3XFlag-tagged) stably expressed in HSPCs. d Proliferation kinetics of murine HSPCs post-transduction of ZM, either WT or the indicated mutant. n = 3 biological replicates per group and data is presented as mean ± SD. e, f Wright-Giemsa staining (e; scale bar = 10 um) and RT-PCR of the indicated oncogenic TFs (f) using murine HSPCs ten days post-transduction of ZM, either WT or the indicated mutant. qPCR signals from three independent experiments were normalized to 18S RNA and then to WT and presented as mean ± SD. g ChIP-qPCR quantifying binding of endogenous TIP60 at the indicated gene in 293T cells stably expressing empty vector (EV) or ZM, either WT or a TIP60-binding-defective mutant (ALL > DDD). ChIP signals from three independent experiments were normalized to input and then to EV and presented as mean ± SD. The p values were calculated by two-sided Student’s t test and denoted as follows: *p < 0.05; **p < 0.01; ***p < 0.001. The exact p values (from left to right) are: 0.039, 0.016, 0.039, 0.007, 0.018, 0.02, 0.016, 0.007, 3.89E-5, 0.006, 0.008, 0.03. h Immunoblotting showing stable expression of the indicated 3xHA-3xFlag-tagged protein in murine HSPCs. i Proliferation of HSPCs post-transduction of TIP60, ZMYND11-TIP60 fusion, or ZM (n = 3 biological replicates per group, with data presented as mean ± SD). j Growth of ZM and ZM + NrasG12D AML cells post-treatment with 25uM TH1834, after normalization to mock-treated controls (n = 3 biological replicates per group, with data presented as mean ± SD).
Fig. 6
Fig. 6. An H3.3K36me3-binding PWWP module is essential for chromatin association of ZM, as well as ZM-enforced proto-oncogene activation and oncogenic transformation.
a Scheme of the used ZM mutations within its ZMYND11 segment. b Proliferation of murine HSPCs stably transduced with ZM, WT or mutant (insert, immunoblot of ZM; n = 3 biological replicates per group, with data presented as mean ± SD). c Wright-Giemsa staining of HSPCs ten days post-transduction of ZM, WT or mutant (scale bar = 10 μm). d RT-qPCR of the indicated ZM direct target genes in HSPCs stably transduced with ZM, WT or the indicated mutant. qPCR signals from three independent experiments were normalized to those of 18S RNA and then to WT and presented as mean ± SD. e Pulldown using H3.3K36me3-containing peptide and nuclear extract of 293T cells stably expressing 3XHA-3XFlag-tagged ZM, either WT or the indicated mutant. f, g Immunoblot for 3XHA-3XFlag-tagged ZM in soluble nucleoplasmic (Sol) and chromatin-bound (Chr) fractions, prepared from 293T cells with stable expression of WT or mutant ZM (f) or those WT ZM stable expression cells with SETD2 knock down (siSETD2; g) or mock treatment (siControl). SETD2 knockdown led to global reduction of H3K36me3. Tubulin and H3 serve as fractionation controls. h ChIP-qPCR examining ZM occupancy to the indicated gene in 293T stable expression cells. ChIP signals from three independent experiments were normalized to those of input and then to WT and presented as mean ± SD. i Average signal profiles and clustered heatmaps displaying 3XHA-3XFlag-tagged ZM∆M, ZM∆Z, and ZM CUT&RUN signals (detected with HA antibody) over all genes in 293T cells. j IGV views of ZM∆M, ZM∆Z, and ZM CUT&RUN signals (detected with Flag or HA antibody) at the indicated gene in 293T cells.
Fig. 7
Fig. 7. ZM-induced AML is sensitive to Brd4 blockade.
a Heatmaps showing un-supervised k-means clustering of ZM and Brd4 ChIP-seq peaks at all promoter-proximal regions (TSS + /−2.5 kb). Four clusters (labeled as a to d, same as Fig. 3e) were produced based on their distinct ZM ChIP-seq signals. TSSs on the two DNA strands are labeled as 1 and 2 (such as a1/2 and b1/2), respectively. b IGV views of normalized Brd4 ChIP-seq signals at indicated loci in ZM-transformed AML cells. The read counts were first normalized to RPGC and then normalized to input. c Proliferation (left y-axis, normalized to DMSO-treated cells) and cell death (right y-axis, measured by trypan blue staining) of AML cells transformed by ZM alone or ZM plus NrasG12D, post-treatment with the indicated concentration of I-BET151 (x-axis) for four days. n = 3 biological replicates per group and data is presented as mean ± SD. d Wright–Giemsa staining of ZM-transformed AML cells post-treatment with DMSO or I-BET151 (0.25 uM) for four days (scale bar = 10 μm). e RT-qPCR of the indicated gene in ZM-transformed AML cells post-treatment with DMSO or the indicated concentration of I-BET151 for four days. qPCR signals from three independent experiments were normalized to those of 18S RNA and then to DMSO-treated control and presented as mean ± SD. f Bioluminescent imaging of mice transplanted with ZM + NrasG12D-transformed AML cells, two weeks post-treatment with either vehicle or I-BET151 (30 mg/kg daily IP injection). g Weight of spleens in the indicated cohorts (n = 4 mice per group) at the study endpoint. The p value was calculated by two-sided Student’s t test. h Kaplan–Meier survival curve of mock- and I-BET151-treated mice bearing the ZM + NrasG12D AML (n = cohort size). Black arrow indicates the day 7 when compound administration was initiated. The p value was calculated by two-sided log-rank test. i Model illustrates the ZM-mediated proto-oncogene activation and leukemogenesis.

Similar articles

Cited by

References

    1. De Kouchkovsky I, Abdul-Hay M. ‘Acute myeloid leukemia: a comprehensive review and 2016 update’. Blood Cancer J. 2016;6:e441. doi: 10.1038/bcj.2016.50. - DOI - PMC - PubMed
    1. Audia JE, Campbell RM. Histone modifications and cancer. Cold Spring Harb. Perspect. Biol. 2016;8:a019521. doi: 10.1101/cshperspect.a019521. - DOI - PMC - PubMed
    1. Lu R, et al. Epigenetic perturbations by Arg882-mutated DNMT3A potentiate aberrant stem cell gene-expression program and acute leukemia development. Cancer Cell. 2016;30:92–107. doi: 10.1016/j.ccell.2016.05.008. - DOI - PMC - PubMed
    1. Wang GG, et al. Haematopoietic malignancies caused by dysregulation of a chromatin-binding PHD finger. Nature. 2009;459:847–851. doi: 10.1038/nature08036. - DOI - PMC - PubMed
    1. Wang GG, Cai L, Pasillas MP, Kamps MP. NUP98-NSD1 links H3K36 methylation to Hox-A gene activation and leukaemogenesis. Nat. Cell Biol. 2007;9:804–812. doi: 10.1038/ncb1608. - DOI - PubMed

Publication types

MeSH terms