. 2021 Feb 16;12(1):1073.
doi: 10.1038/s41467-021-21249-6.

Modelling safe protocols for reopening schools during the COVID-19 pandemic in France

Affiliations

Modelling safe protocols for reopening schools during the COVID-19 pandemic in France

Laura Di Domenico et al. Nat Commun. .

Abstract

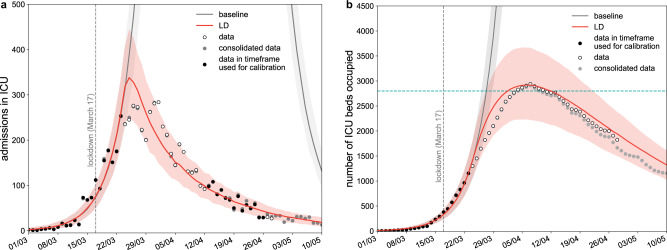
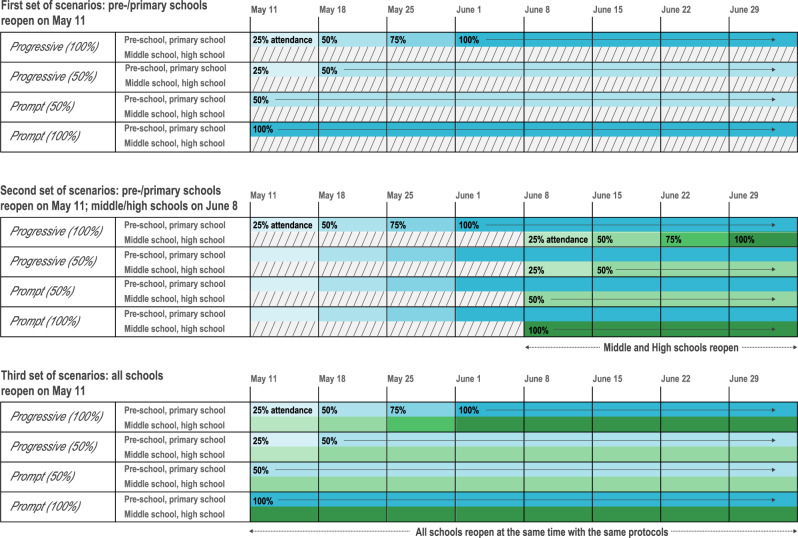
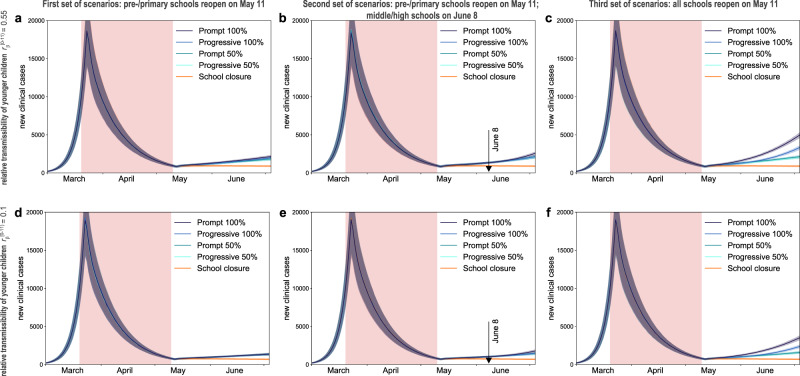
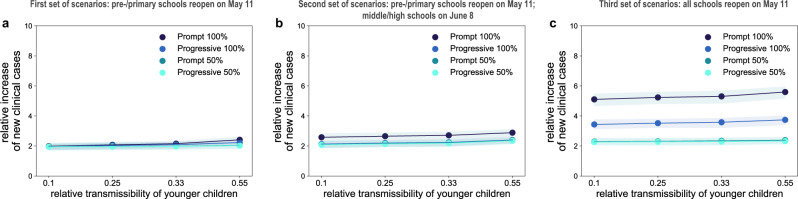
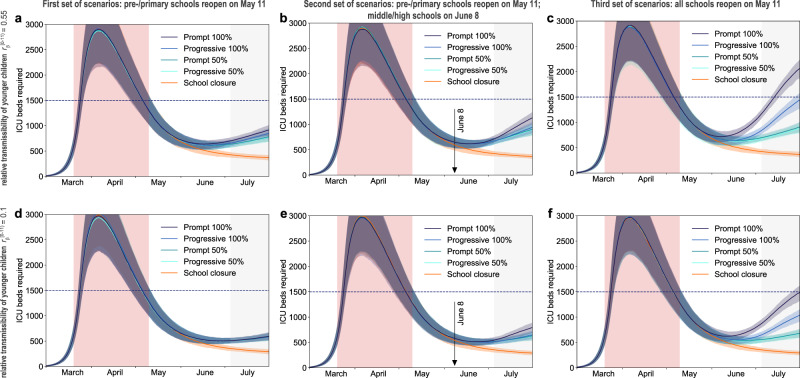
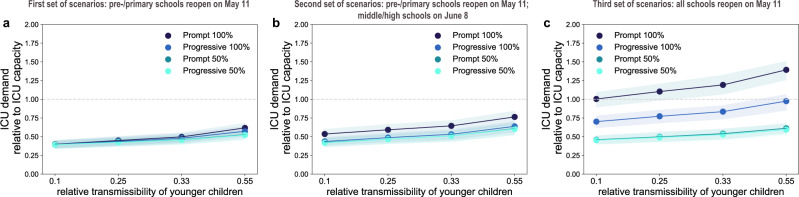
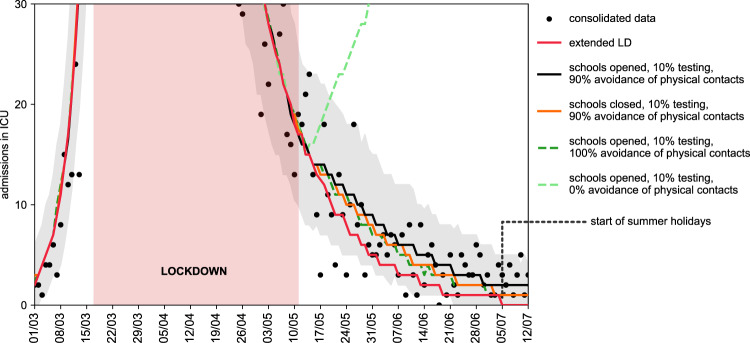
As countries in Europe implement strategies to control the COVID-19 pandemic, different options are chosen regarding schools. Through a stochastic age-structured transmission model calibrated to the observed epidemic in Île-de-France in the first wave, we explored scenarios of partial, progressive, or full school reopening. Given the uncertainty on children's role, we found that reopening schools after lockdown may increase COVID-19 cases, yet protocols exist to keep the epidemic controlled. Under a scenario with stable epidemic activity if schools were closed, reopening pre-schools and primary schools would lead to up to 76% [67, 84]% occupation of ICU beds if no other school level reopened, or if middle and high schools reopened later. Immediately reopening all school levels may overwhelm the ICU system. Priority should be given to pre- and primary schools allowing younger children to resume learning and development, whereas full attendance in middle and high schools is not recommended for stable or increasing epidemic activity. Large-scale test and trace is required to keep the epidemic under control. Ex-post assessment shows that progressive reopening of schools, limited attendance, and strong adoption of preventive measures contributed to a decreasing epidemic after lifting the first lockdown.


Conflict of interest statement

The authors declare no competing interests.

Figures

Fig. 1
Fig. 1. Simulated epidemic trajectories till May 11.
a Simulated daily incidence of admissions in ICU over time. b Simulated number of ICU beds occupied over time. The fitted curve slightly overestimates the data, likely because it does not account for the transfer of patients in intensive care to less affected regions. Vertical dashed line refers to the start of the lockdown; curves and shaded areas correspond to median and 95% probability ranges, obtained from n=500 independent stochastic runs; horizontal line refers to strengthened ICU capacity in the region to face the first COVID-19 wave; LD stands for lockdown. Black dots indicate data used for the calibration; gray dots indicate data that became available after the initial submission of this study.
Fig. 2
Fig. 2. Protocols of school reopening.
The first set of scenarios considers the reopening of pre-schools and primary schools only, on May 11, through Progressive (100%), Progressive (50%), Prompt (50%), and Prompt (100%) protocols. Progressive (100%): progressive reopening up to 100% attendance, where 25% of students go back to school on the 1st week after lockdown is lifted, 50% on the 2nd, 75% on the 3rd, and 100% from the 4th week till summer holidays. Progressive (50%): progressive reopening up to 50% attendance, where 25% of students go back to school on the 1st week after lockdown is lifted, and 50% from the 2nd week till summer holidays. Prompt (50%): partial reopening with 50% attendance from May 11. Prompt (100%): full reopening with 100% attendance from May 11. Colors indicate school levels (blue for pre-/primary schools, green for middle/high schools). Color gradient indicate student attendance (from lighter to darker, 25% to 100% at 25% incremental steps). The second set of scenarios considers the reopening of pre-schools and primary schools on May 11, only through Progressive (100%), followed by the reopening of middle and high schools on June 8 through all 4 possible protocols. A sensitivity scenario assuming Prompt (100%) for pre-schools and primary schools is provided in the Supplementary Information. The third set of scenarios considers the reopening of all schools on May 11, with all schools following the same protocol.
Fig. 3
Fig. 3. Simulated epidemic activity in scenarios with reopening of schools.
a–c Simulated daily number of new clinical cases assuming that only pre-schools and primary schools are reopened on May 11 through 4 different protocols (first set of scenarios, panel a), additionally considering the reopening of middle and high schools on June 8 (second set of scenarios, panel b), or assuming that all school levels reopen on May 11 (third set of scenarios, panel c). Four protocols (Progressive (100%, 50%), Prompt (100%, 50%)) are compared to the school closure scenario. Curves and shaded areas correspond to median and 95% probability ranges, obtained from n = 500 independent stochastic runs. Results are obtained for a relative transmissibility of younger children rβ[011)=0.55, i.e., younger children are as infectious as adolescents. df As panels (ac) assuming rβ[011)=0.1, i.e., transmissibility of younger children is about 1/5th of the one of adolescents. Results for other values of rβ[011) are reported in Supplementary Fig. 3. The red area indicates the lockdown phase. Results are obtained considering moderate social distancing interventions coupled with 50% case isolation.
Fig. 4
Fig. 4. Impact of reopening schools on epidemic activity.
a–c Projected increase in the daily number of new cases relative to the school closure scenario on July 5 (start of summer holidays) as a function of the relative transmissibility of younger children, for different reopening protocols. Results are obtained considering moderate social distancing interventions coupled with 50% case isolation. Shaded areas correspond to 95% probability ranges around the median value, obtained from n=500 independent stochastic runs.
Fig. 5
Fig. 5. Simulated ICU occupancy in scenarios with reopening of schools.
a–c Simulated demand of ICU beds assuming that only pre-schools and primary schools are reopened on May 11 through 4 different protocols (first set of scenarios, panel a), additionally considering the reopening of middle and high schools on June 8 (second set of scenarios, panel b), or assuming that all school levels reopen on May 11 (third set of scenarios, panel c). Four protocols (Progressive (100%, 50%), Prompt (100%, 50%)) are compared to the school closure scenario. Curves and shaded areas correspond to median and 95% probability ranges, obtained from n = 500 independent stochastic runs. Results are obtained for a relative transmissibility of younger children rβ[011)=0.55, i.e., younger children are as infectious as adolescents. d–f As panels (ac) assuming rβ[011)=0.1, i.e., transmissibility of younger children is about 1/5th of the one of adolescents. Results for other values of rβ[011) are reported in Supplementary Fig. 4. The red area indicates the lockdown phase; the gray area indicates summer holidays (month of July to show the delayed effect of the epidemic on ICU demand). Horizontal line refers to the foreseen 1500-bed ICU capacity in the region restored after the first wave emergency. Results are obtained considering moderate social distancing interventions coupled with 50% case isolation.
Fig. 6
Fig. 6. Impact of reopening schools on ICU occupancy.
a–c Projected ICU demand on August 1 relative to the foreseen 1500-bed ICU capacity in the region restored after the first wave emergency, as a function of the relative transmissibility of younger children, for different reopening protocols. Results are obtained considering moderate social distancing interventions coupled with 50% case isolation. Shaded areas correspond to 95% probability ranges around the median value, obtained from n = 500 independent stochastic runs.
Fig. 7
Fig. 7. Retrospective analysis of the epidemic in the exit phase following lockdown.
Number of daily ICU admissions, comparison between data and different scenarios describing the post-lockdown phase. Red curve: lockdown maintained beyond May 11; black curve: scenario parameterized on data on interventions and attendance at school, with 90% avoidance of physical contacts; orange curve: as the black curve, with school closed; green curves: as the black curve, with full avoidance of physical contacts (dark green) or no respect of physical distancing (light green). The black curve corresponds to the maximum likelihood estimate of avoidance of physical contacts obtained by fitting ICU admissions data up to July 5, start of summer holidays. The red area indicates the lockdown phase. Curves indicate median values. Shaded areas around the curves indicate 95% probability ranges, obtained from n = 500 independent stochastic runs; they are shown only for the fitted scenario for the sake of visualization.

References

    1. Flaxman S, et al. Estimating the effects of non-pharmaceutical interventions on COVID-19 in Europe. Nature. 2020;584:257–261. doi: 10.1038/s41586-020-2405-7. - DOI - PubMed
    1. Haug N, et al. Ranking the effectiveness of worldwide COVID-19 government interventions. Nat. Hum. Behav. 2020;4:1303–1312. doi: 10.1038/s41562-020-01009-0. - DOI - PubMed
    1. Hsiang S, et al. The effect of large-scale anti-contagion policies on the COVID-19 pandemic. Nature. 2020;584:262–267. doi: 10.1038/s41586-020-2404-8. - DOI - PubMed
    1. Di Domenico L, Pullano G, Sabbatini CE, Boëlle P-Y, Colizza V. Impact of lockdown on COVID-19 epidemic in Île-de-France and possible exit strategies. BMC Med. 2020;18:240. doi: 10.1186/s12916-020-01698-4. - DOI - PMC - PubMed
    1. European Centre for Disease Prevention and Control. COVID-19 in Children and the Role of School Settings in Transmission-First Update. https://www.ecdc.europa.eu/sites/default/files/documents/COVID-19-in-chi... (2020).

Publication types