. 2021 Feb 16;12(1):1074.
doi: 10.1038/s41467-021-21016-7.

Asymmetric opening of the homopentameric 5-HT3A serotonin receptor in lipid bilayers

Affiliations

Asymmetric opening of the homopentameric 5-HT3A serotonin receptor in lipid bilayers

Yingyi Zhang et al. Nat Commun. .

Abstract

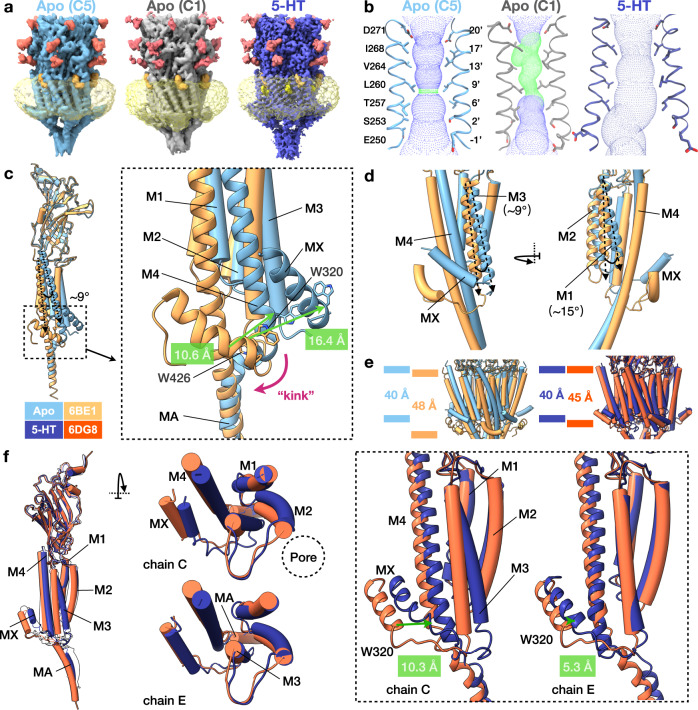
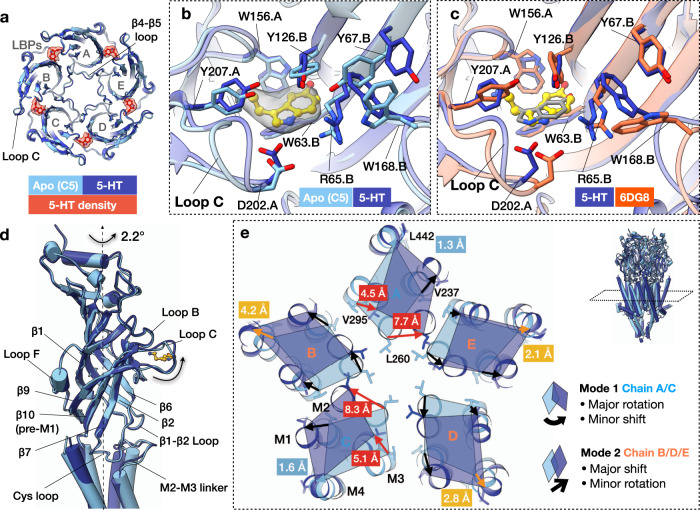
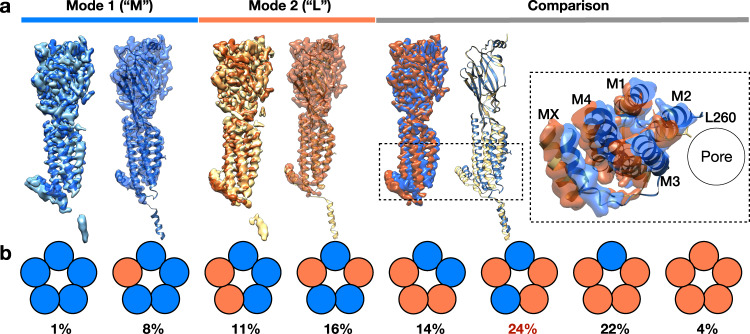
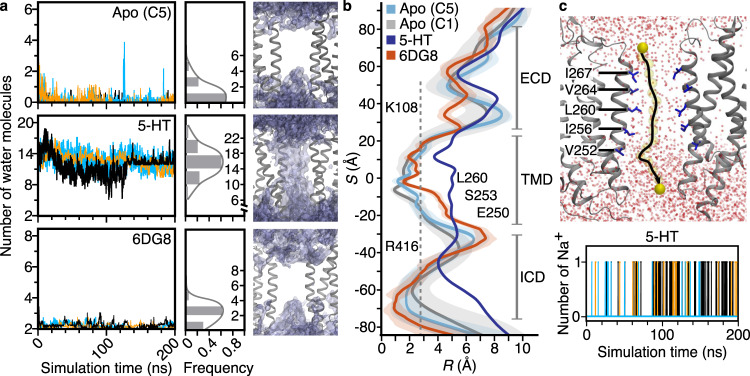
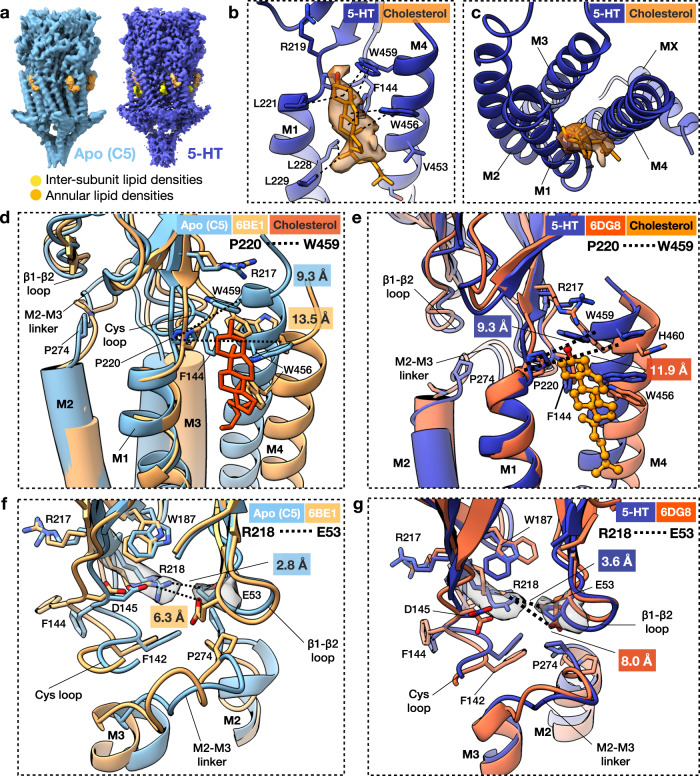
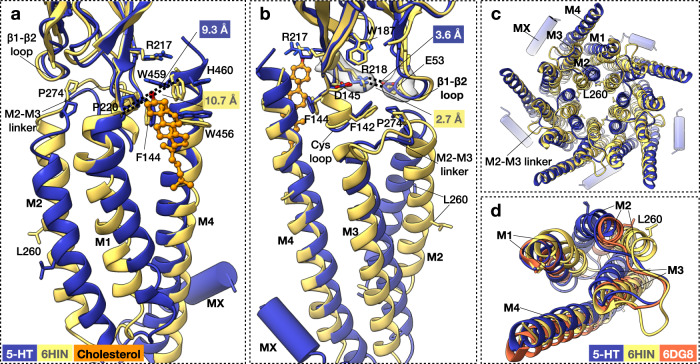
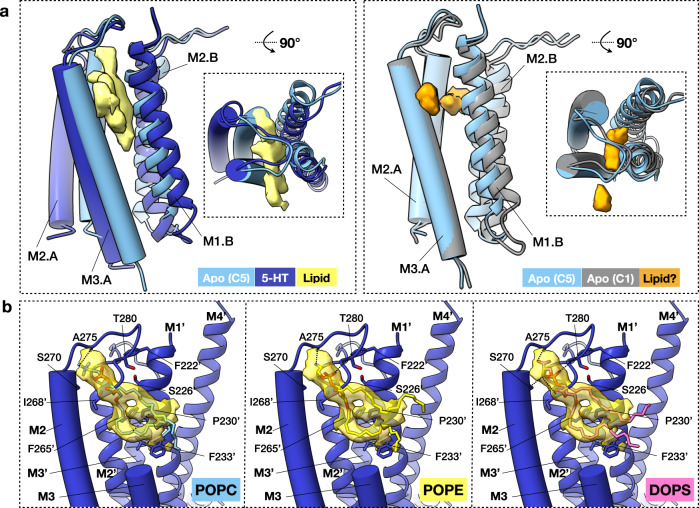
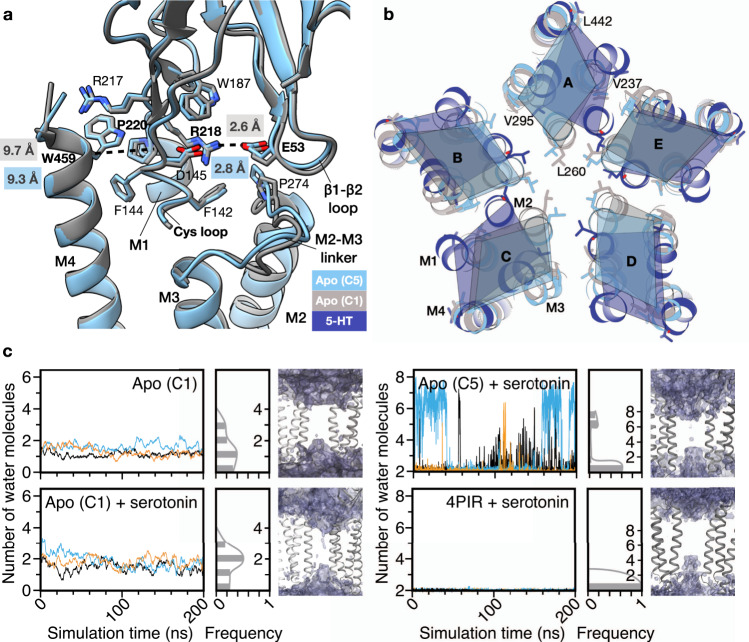
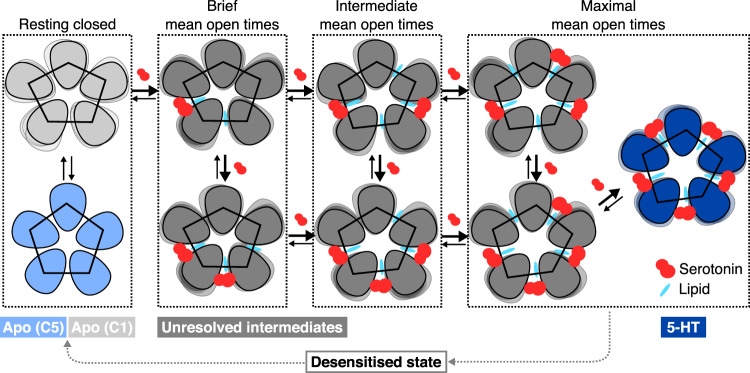
Pentameric ligand-gated ion channels (pLGICs) of the Cys-loop receptor family are key players in fast signal transduction throughout the nervous system. They have been shown to be modulated by the lipid environment, however the underlying mechanism is not well understood. We report three structures of the Cys-loop 5-HT3A serotonin receptor (5HT3R) reconstituted into saposin-based lipid bilayer discs: a symmetric and an asymmetric apo state, and an asymmetric agonist-bound state. In comparison to previously published 5HT3R conformations in detergent, the lipid bilayer stabilises the receptor in a more tightly packed, 'coupled' state, involving a cluster of highly conserved residues. In consequence, the agonist-bound receptor conformation adopts a wide-open pore capable of conducting sodium ions in unbiased molecular dynamics (MD) simulations. Taken together, we provide a structural basis for the modulation of 5HT3R by the membrane environment, and a model for asymmetric activation of the receptor.


Conflict of interest statement

H.V. and S.Y. are cofounders of AlphaMol Science Ltd. The remaining authors declare no competing interests.

Figures

Fig. 1
Fig. 1. Global architecture of 5HT3R-Salipro.
a Cryo-EM maps of apo- (C5 symmetric, light blue; C1 symmetric, grey) and serotonin-5HT3R-Salipro (5-HT, dark blue), with red, orange, yellow and transparent-yellow densities corresponding to glycosylation, cholesterol, inter-subunit phospholipids and the saposin-lipid bilayer, respectively. b Static pore radius of the 5HT3R-Salipro models determined using HOLE. Green and blue spheres represent radii of 1.8–3.3 Å, and >3.3 Å, respectively. c, d Superposition of the apo-5HT3R-Salipro (C5) and apo-5HT3R-detergent (6BE1, yellow) structures (single subunit is shown for clarity). Differences at the c MX and M4-MA helices, and d M1 and M3 helices are highlighted. e The TMD thickness was measured between residues L221 and W426 for the 5HT3R-Salipro and the 5HT3R-detergent structures (coloured as in c and f). f Superposition of the monomers of the serotonin-5HT3R-Salipro and serotonin-5HT3R-detergent (6DG8, orange) structures. The left panel shows chain C in colour and black silhouettes for the other chains. The middle panel shows a top view of the TMD. Right panel highlights differences in the position of MX (8.2, 6.7, 10.3, 7.0 and 5.3 Å measured at the Cα atom of W320 of chains A–E, respectively). Chains C and E represent the most and least different subunits, respectively.
Fig. 2
Fig. 2. Serotonin-induced conformational changes of 5HT3R-Salipro.
a Superposition of the ECD of the apo- and serotonin-5HT3R-Salipro structures, showing a cross-section at LBPs. Five densities (transparent red, contoured at σ 8.0) corresponding to serotonin (5-HT) were observed in the serotonin-5HT3R-Salipro map. b Close-up of the LBP showing serotonin (yellow) and the corresponding density (transparent grey, contoured at σ 8.0). Residues on the primary and complementary subunits are labelled ‘.A’ and ‘.B’, respectively. c LBPs of the serotonin-bound 5HT3R-Salipro and 5HT3R-detergent (6DG8) structures. Serotonin molecule of 6DG8 is displayed in grey. d Superposition of the ECD of the apo- and serotonin-5HT3R-Salipro structures, showing the ECD and ECD/TMD interface. e Superposition of the apo- and serotonin-5HT3R-Salipro states showing a cross-section at the TMD residue L260 (9′ position) of M2. Displacements measured at the Cα atoms of the indicated residues on each helix in the same cross-section are shown (see also Supplementary Table 3). Two modes of rearrangements are observed: (1) major rotation/minor shift for chains A/C, and (2) minor rotation/major shift for chains B/D/E.
Fig. 3
Fig. 3. Conformational plasticity of serotonin-5HT3R-Salipro state.
a Classes resulting from symmetry expanded monomer-focused 3D classification were divided into two groups based on comparison to the serotonin-5HT3R-Salipro model: (1) densities similar to chain A/C (corresponding to ‘Mode 1’ in Fig. 2e) or M-type (left, model of chain C is shown), and (2) densities similar to chain B/D/E (Mode 2), or L-type (middle, model of chain D is shown). Superposition of M- and L-types with insert showing a top view (right). b Schematic showing the population of the eight different combinations of serotonin-5HT3R-Salipro arrangements; blue and orange circles represent M- and L-type subunits, respectively. The largest class corresponds to the consensus serotonin-bound conformation.
Fig. 4
Fig. 4. Pore permeability.
a Averaged water molecule density within 4 Å of L260 at the TMD. Left panel—number of water molecules, solid lines in different colours indicate results of three simulations and the histograms show the averaged distribution of the number of observed water molecules. Right panel—water molecule densities are shown in purple, two subunits of each model shown in grey. b Pore radius (R) profile relative to the distance along the receptor pore axis (S) derived from the MD simulations; solid lines represent the average radii over the last 50 ns of the simulations and shading the corresponding standard deviation. The dashed grey line represents the radius of a hydrated sodium ion (2.76 Å). c Top panel—the trajectory (black line) of a single sodium ion (yellow) translocated across the pore (Supplementary Movie 2). Bottom panel—the number of sodium ions translocated throughout three 200-ns simulations.
Fig. 5
Fig. 5. Lipid modulation of 5HT3R.
a Additional densities corresponding to annular (orange) and inter-subunit lipids (yellow). b Tentative modelling of cholesterol at annular lipid site with density shown in transparent orange (contoured at σ 2.0). Putative lipid–protein interactions are indicated with dashed lines. c Top view of the putative cholesterol density. d, f Superposition of apo-5HT3R-Salipro and apo-5HT3R-detergent (6BE1, chain C) d at the cholesterol-binding pocket viewed from the membrane or f at the Cys loop, β1-β2 loop, M2–M3 linker junction viewed from the neighbouring subunit. Part of the Cys loop (C135-D138) and the TMD are omitted for clarity. Distances are labelled in the same colour scheme as the structures. Density sharpened using RELION with auto-determined b-factor is shown in transparent grey for residues R218 and E53 (contoured at σ 6.0). e, g Same as d, f but showing a superposition of the serotonin-bound 5HT3R-Salipro (chain C) and 5HT3R-detergent (6DG8) structures. Density for residues R218 and E53 is contoured at σ 6.5.
Fig. 6
Fig. 6. Comparison of serotonin-bound 5HT3R-Salipro and 6HIN structures.
a, b Superposition of the serotonin-bound 5HT3R-Salipro (chain C) and 5HT3R-detergent (6HIN) structures at a the cholesterol-binding pocket viewed from the membrane (M3 is omitted for clarity) or b at the Cys loop, β1-β2 loop, M2–M3 linker junction viewed from the neighbouring subunit (M1 and part of the Cys loop and TMD are omitted for clarity). Distances are labelled in the same colour scheme as the structures. Density sharpened using RELION with auto-determined b-factor, shown in transparent grey for residues R218 and E53, at σ 6.5. c, d Top views of the TMD, with d including the 5HT3R-detergent 6DG8 structure and showing single subunits only for clarity.
Fig. 7
Fig. 7. Inter-subunit lipid-like EM densities.
a Additional densities tentatively assigned as lipids (yellow) were seen in between subunits at the TMD for the serotonin-5HT3R-Salipro EM map (left). Weaker densities were seen in the largest inter-subunit cavity of the apo-C1 EM map (right). b Tentative modelling of POPC (left), POPE (middle), and DOPS (right) in the inter-subunit phospholipid-like density (transparent dark yellow, contoured at σ 2.0) of the serotonin-5HT3R-Salipro EM map. Residues P281-L293 of the M3 helix (of chain A) are omitted for clarity. TMD helices of chain A and B are shown in tube and ribbon representation, respectively.
Fig. 8
Fig. 8. Comparison of symmetric and asymmetric apo conformations.
a Superposition of apo-C1 (chain C, grey) and apo-C5 5HT3R-Salipro (light blue) structures. Part of M1 and the Cys loop (C135-Y140) are omitted for clarity. The Cα–Cα distance between P220 (pre-M1) and W459 (M4) ranged between 9.6 and 9.9 Å for the individual chains. The Cα–Cα distance between D53 (β1-β2 loop) and R218 (pre-M1) ranged between 2.5 and 3.3 Å. b Cross-section of the TMD at L260 (9′ position) of M2 for apo-C5, apo-C1, and serotonin-bound (dark blue) 5HT3R-Salipro models. Displacement measured at the Cα atoms of residues on each helix in the same cross-section can be found in Supplementary Table 3. Superposition of the models that minimises the summed displacement of the indicated residues is shown. c Graphs show a number of water molecules within 4 Å of L260 at the TMD during MD simulations of apo-C1, and of apo-C1, apo-C5 (in a BPL-mimicking lipid environment) and 4PIR (in POPC) with five serotonin molecules docked into the ligand-binding pockets (+serotonin). Differently coloured lines represent the results of three simulations. Histograms show the averaged distribution of observed water molecules. Figures show water molecule densities in purple, with two subunits of each model shown in grey.
Fig. 9
Fig. 9. Model for asymmetric activation of 5HT3R.
Proposed model for allosterically lipid-modulated asymmetric activation of 5HT3R upon serotonin binding, based on 5HT3R-Salipro structures, MD, and previous observations from single-channel recordings. Various degrees of mean channel open times have been observed in response to different numbers of consecutive/non-consecutive ligands bound. We speculate that the asymmetric apo form represents an intermediate state; that asymmetric opening may result from sequential ligand binding (5-HT shown in red) via this state yielding sequential conformational changes stabilised by the introduction of inter-subunit lipids (shown in light blue) during the transition of each subunit from a resting to an activated conformation; and that, considering that the channel already shows maximal mean open times upon binding three non-consecutive ligands, one ligand-binding event results in the introduction of two inter-subunit lipids as depicted (adjacent to the principal and the complementary ligand-binding subunits), thus resulting in stabilisation of the open state by five lipids upon binding of three non-consecutive ligands. Light blue, light grey and dark blue pentamers correspond to the resolved apo-C5, apo-C1 and serotonin-bound 5HT3R-Salipro conformations, and dark grey pentamers to various unresolved asymmetric conformations with partial ligand occupancy.

Similar articles

Cited by

References

    1. Thompson AJ, Lester HA, Lummis SCR. The structural basis of function in Cys-loop receptors. Q. Rev. Biophys. 2010;43:449–499. doi: 10.1017/S0033583510000168. - DOI - PubMed
    1. Nemecz A, Prevost MS, Menny A, Corringer PJ. Emerging molecular mechanisms of signal transduction in pentameric ligand-gated ion channels. Neuron. 2016;90:452–470. doi: 10.1016/j.neuron.2016.03.032. - DOI - PubMed
    1. Dalziel AW, Rollins ES, McNamee MG. The effect of cholesterol on agonist-induced flux in reconstituted acetylcholine receptor vesicles. FEBS Lett. 1980;122:193–196. doi: 10.1016/0014-5793(80)80435-2. - DOI - PubMed
    1. Ochoa ELM, Dalziel AW, McNamee MG. Reconstitution of acetylcholine receptor function in lipid vesicles of defined composition. Biochim. Biophys. Acta. 1983;727:151–162. doi: 10.1016/0005-2736(83)90379-6. - DOI - PubMed
    1. Criado M, Eibl H, Barrantes F. Functional properties of the acetylcholine receptor incorporated in model lipid membranes. Differential effects of chain length and head group of phospholipids on receptor affinity states and receptor-mediated ion translocation. J. Biol. Chem. 1984;259:9188–9198. doi: 10.1016/S0021-9258(17)47283-8. - DOI - PubMed

Publication types

LinkOut - more resources