. 2021 Feb 16;12(1):1067.
doi: 10.1038/s41467-021-21277-2.

Pancreatic glycoprotein 2 is a first line of defense for mucosal protection in intestinal inflammation

Affiliations

Pancreatic glycoprotein 2 is a first line of defense for mucosal protection in intestinal inflammation

Yosuke Kurashima et al. Nat Commun. .

Abstract

Increases in adhesive and invasive commensal bacteria, such as Escherichia coli, and subsequent disruption of the epithelial barrier is implicated in the pathogenesis of inflammatory bowel disease (IBD). However, the protective systems against such barrier disruption are not fully understood. Here, we show that secretion of luminal glycoprotein 2 (GP2) from pancreatic acinar cells is induced in a TNF-dependent manner in mice with chemically induced colitis. Fecal GP2 concentration is also increased in Crohn's diease patients. Furthermore, pancreas-specific GP2-deficient colitis mice have more severe intestinal inflammation and a larger mucosal E. coli population than do intact mice, indicating that digestive-tract GP2 binds commensal E. coli, preventing epithelial attachment and penetration. Thus, the pancreas-intestinal barrier axis and pancreatic GP2 are important as a first line of defense against adhesive and invasive commensal bacteria during intestinal inflammation.


Conflict of interest statement

The authors declare no competing interests.

Figures

Fig. 1
Fig. 1. GP2 in mouse digestive tract.
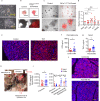
a Immunohistochemical analysis of GP2 distribution in the gastrointestinal tract (stomach, duodenum, jejunum, ileum, and colon) with luminal contents and pancreas of an intact mouse; labels correspond with those shown in. Representative data of five independent experiments are shown. GP2 (red), DAPI (blue). Scale bars, 100 μm. b Counter staining of mice colon with MUC2 (green) of WT and Gp2-deficient mice are shown. Representative data of 3 independent experiments are shown. Scale bars, 100 μm.
Fig. 2
Fig. 2. Upregulation of pancreatic GP2 production in colitis.
a Hematoxylin and eosin staining of pancreas in intact or colitis mice are shown. Scale bars, 100 μm. Data are representative of at least three independent experiments. Gene expression of Pnlip in pancreas (b) and of Gp2 in the indicated tissue and cellular components of the gastrointestinal tract (c) in intact mice and mice with acute colitis (n = 4/group, two-tailed unpaired t-test). *p = 0.021. Data are presented as mean values ± SEM. N.S. indicates not significant. d GP2 expression in pancreas. Representative data of four independent experiments are shown. GP2 (red), DAPI (blue). Scale bars, 100 μm. e Concentrations of secretory GP2 in pancreatic juice and intestinal lumen, as measured by enzyme-linked immunosorbent assay (ELISA) (intact, n = 10; colitis, n = 7, two-tailed Mann–Whitney U test). Data are presented as mean values ± SEM. f Fecal GP2 concentration was determined by ELISA and compared between healthy people (n = 5), CD patients (n = 7), and ulcerative colitis patients (n = 9), two-tailed Mann–Whitney U test. Data are presented as mean values ± SEM. Source data are provided as a Source Data file.
Fig. 3
Fig. 3. Inflammatory signal upregulates Gp2 expression in pancreatic acinar cells.
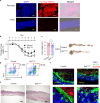
a Cultured pancreatic acinar cells are shown. b Pancreas of control (upper) or Ptf1aCre-ERTMCre-tdTomato (bottom) mice received tamoxifen are shown. c Cultured pancreatic acini from control of Ptf1aCre-ERTM-tdTomato mice stimulated with 4OHT are shown. Data are representing for three independent experiments. d Gp2 expression in no stimulation (None) or stimulated by 200 ng/mL LPS, 20 ng/mL TNF, 20 ng/mL IL-6 (n = 10 /group), 100 ng/mL RANKL (n = 4) pancreatic acini were examined. Relative expressions mRNA levels were determined by quantitative RT-PCR and normalized to Gapdh. *p = 0.040 (one-way ANOVA). Data are presented as mean values ± SEM., N.S. indicates not significant. e Pancreas of mice systemically administered PBS (control) or TNF (100 ng, two times). GP2 (red), DAPI (blue). Representative data of three independent experiments are shown. f GP2 concentration in pancreatic juice. *p = 0.04 (two-tailed Mann–Whitney U test). Data are presented as mean values ± SEM. g TNF concentration in serum *p = 0.021 (two-tailed unpaired t-test). Data are presented as mean values ± SEM. h Representative photograph showing the abdominal-organ matrices surrounding the pancreas in Ptf1aCre-ERTM-tdTomato mice that received tamoxifen. i TNF concentration in abdominal-organ matrices, as determined by enzyme-linked immunosorbent assay. Pancreas (intact n = 15, colitis n = 13), Omentum (intact n = 10, colitis n = 11) mesenteric fat (intact n = 15, colitis n = 13), Retroperitoneal fat and Epididymis fat (intact n = 3, colitis n = 3) *p < 0.05 (two-tailed unpaired t-test). Data are presented as mean values ± SEM. j 100 μg of anti-TNF antibody (Biolegend, MP6-XT22, #506332) or Isotype Rat IgG2a (Biolegend, RTK2758, #400503) was intraperitoneal administered three times (on days 1, 3, and 5) during DSS treatment, and pancreases were collected on day 6. GP2 (red), DAPI (blue). Representative data of three independent experiments are shown. Source data are provided as a Source Data file.
Fig. 4
Fig. 4. Deletion of systemic GP2 results in severe colitis.
a Fecal total IgA concentration in WT and Gp2–/– mice, as determined by ELISA (n = 5). N.S. not significant (two-tailed unpaired t-test). Data are presented as mean values ± SEM. b 16S rRNA gene sequencing of fecal bacteria. Phylum levels of bacteria are shown. c qPCR analysis of mucosal bacteria from WT (n = 9) and Gp2–/– (n = 8) mice were examined. *p < 0.05., N.S. indicates not significant (two-tailed unpaired t-test). Data are presented as mean values ± SEM. d Survival ratio and body weight change of WT and Gp2–/– mice with acute colitis (n = 12/group). *p < 0.05, **p < 0.01 (two-tailed unpaired t-test). Data are presented as mean values ± SEM. e Colon length and representative pictures of colon are shown, intact; WT (n = 3), KO (n = 4), and colitis; WT, KO (n = 12). ***p < 0.0001 (two-tailed unpaired t-test). Data are presented as mean values ± SEM. f Hematoxylin and eosin staining of colon at day 8 of DSS treatment are shown. Scale bars: 100 μm. Data are representative of three independent experiments. g Flow cytometry analysis of infiltrated neutrophils is shown. Representative data are shown. h Immunohistochemical analysis of colitis (DSS 2%, day 8) colon with luminal contents of WT and Gp2–/– mice. Bacteria (red), MUC2 (green), DAPI (blue). Scale bars: upper panels, 100 μm; lower panels, 20 μm. Data are representative of three independent experiments. i Serum anti-E. coli IgM, intact (n = 4), and colitis (n = 5), IgA, intact WT (n = 6), KO (n = 10), and colitis WT (n = 15), KO (n = 11), IgG intact WT (n = 12), KO (n = 4), and colitis WT (n = 11), KO (n = 7) in intact and colitis WT and Gp2–/– mice were analyzed by ELISA (Kruskal-Wallis test followed by Mann–Whitney U test). Data are presented as mean values ± SEM. j Body weight changes after the induction of acute TNBS-induced colitis in WT and Gp2–/– mice. ***p < 0.01 (two-tailed unpaired t-test). Data are presented as mean values ± SEM. k Immunohistochemical analysis of colon and luminal contents during TNBS-induced colitis in Gp2Panc and control mice. EUB338 bacteria (red), MUC2 (green), DAPI (blue). Scale bars: upper panels, 100 μm; lower panels, 20 μm. Data are representative of two independent experiments. Source data are provided as a Source Data file.
Fig. 5
Fig. 5. DSS-induced acute colitis in mice lacking GP2 in gut-associated lymphoid tissue.
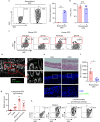
a VIL1 expression in pancreas, Peyer’s patch (PP), and colon of Vil1-cre-tdTomato mice were shown. b GP2 (red) distribution in Vil1-cre-Gp2flox/flox (GP2IEC) mice were shown. Green color indicates UEA-1 in PP. Representative data of three independent experiments are shown. Scale bars, 100 μm. c Body weight change after induction of acute colitis in GP2IEC and control (WT Gp2flox/flox) mice (n = 7 /group). N.S. indicates not significant (two-tailed unpaired t-test). Data are presented as mean values ± SEM. d Colon length in GP2IEC and control mice were shown (n = 7 /group). N.S. indicates not significant (two-tailed unpaired t-test). Data are presented as mean values ± SEM. e Hematoxylin and eosin staining of colon tissues were shown. Scale bars, 100 μm. Data are representative of three independent experiments. Source data are provided as a Source Data file.
Fig. 6
Fig. 6. Pancreatic GP2 is important for mucosal protection.
a PTF1A-expressing cells (red: tomato) in the pancreas and colon of Ptf1a-creETRM-tdTomato mice. Scale bars, 100 μm. Data are representative of three independent experiments. b Body weight changes after the induction of acute colitis in Ptf1a-creETR Δ/+-Gp2flox/flox (Gp2Panc) (n = 15) and control (wild-type; Ptf1a-creETR +/+-Gp2flox/flox) (n = 11) mice, receiving tamoxifen **p < 0.01, *p < 0.05 (two-tailed unpaired t-test). Data are presented as mean values ± SEM. c Changes in colon length and photographs of representative colons of Gp2Panc (n = 15) and control (n = 11) mice. Scale bars, 100 μm. *p = 0.026 (two-tailed unpaired t-test). Data are presented as mean values ± SEM. d Flow cytometric analysis of neutrophils that had infiltrated the colon in Gp2Panc and control mice; representative data are shown. e Hematoxylin and eosin staining of colon at day 8 of DSS treatment in Gp2Panc and control mice. Scale bars: 100 μm. Data are representative of three independent experiments. f Immunohistochemical analysis of colitis colon and luminal contents in Gp2Panc and control mice. Bacteria; EUB338 (red), MUC2 (green), DAPI (blue). Scale bars: upper panel, 100 μm; lower panel, 20 μm. Data are representative of three independent experiments. Source data are provided as a Source Data file.
Fig. 7
Fig. 7. Recognition of intestinal bacteria by pancreatic GP2.
a Luminal contents of colon were stained with GP2 (red) and EUB338 (blue in left bottom and green in right bottom) were shown. Data are representative of three independent experiments. b Fecal unbound GP2 in WT and Gp2–/– mice with or without acute colitis were measured by ELISA (WT, n = 8; Gp2–/–, n = 4). N.S. indicates not significant (two-tailed unpaired t-test). Data are presented as mean values ± SEM. c Percentage of rGP2-bound fecal bacteria isolated from Gp2–/– mice, PBS and rGP2 Intact n = 7, PBS colitis (n = 7), rGP2 colitis (n = 6). *p = 0.017 (two-tailed unpaired t-test). Data are presented as mean values ± SEM. d Representative flow cytometry analysis of fecal bacteria isolated from WT and Gp2–/– mice with or without colitis were shown. e E. coli number of non-selected (rGP2 MACS −) and selected by MACS (rGP2 MACS +) fecal bacteria (n = 9 /group). N.D.: not detected. Data are presented as mean values ± SEM. Source data are provided as a Source Data file.
Fig. 8
Fig. 8. Pancreatic GP2 regulates E. coli invasion in colitis.
a Flow cytometry of E. coli strain S-17-GFP bound with or without rGP2 were performed. Representative data of three independent experiments were shown. ***p < 0.0001 (two-tailed unpaired t-test). Data are presented as mean values ± SEM. b CFU assay of S-17-GFP incubated with recombinant GP2 (n = 4). N.S. indicates not significant (two-tailed unpaired t-test). c Approximately 1 × 106 CFU of WT S-17 cells and FimH-deficient S-17 cells (ΔFimH) were incubated with 1 μg of mouse or human GP2, and FACS analysis was conducted with anti-GP2 antibody. Representative data of three independent experiments are shown. d, e Immunohistochemical analysis of colon specimens isolated from ligated colon of S-17-GFP, pre-incubated with PBS or recombinant GP2 were shown. Scale bars, 50 μm (left panel) and 10 μm (right panels). f CFU assay of S-17-GFP injected looped colon (2% DSS day 6), n = 5 /group were shown. *p = 0.017 (two-tailed unpaired t-test). Data are presented as mean values ± SEM. g The amount of anti-GP2 IgG in the luminal contents of intact mice (n = 5), DSS-treated mice (n = 6), mice systemically administered GP2-bound heat-killed (70 °C, 30 min) S-17 cells (n = 4), and GP2 knockout (GP2KO) mice immunized with rmGP2 and complete Freund’s adjuvant (CFA) as positive controls was determined by ELISA on day 27 after immunization (n = 4). ***p < 0.01 (one-way ANOVA). Data are presented as mean values ± SEM. h Neutralizing assay for the binding of rGP2 to S-17 cells. Medium (Tris-HCL). Luminal contents from anti-GP2 IgG antibody–negative (intact) or -positive (DSS-treated) mice were pre-incubated with GP2 and added to S-17 cells. The GP2-bound SYTO9+ S-17 population is shown. Data are representative of two independent experiments. Source data are provided as a Source Data file.

Similar articles

Cited by

References

    1. Andoh A, et al. Multicenter analysis of fecal microbiota profiles in Japanese patients with Crohn’s disease. J. Gastroenterol. 2012;47:1298–1307. doi: 10.1007/s00535-012-0605-0. - DOI - PubMed
    1. Antoni L, Nuding S, Wehkamp J, Stange EF. Intestinal barrier in inflammatory bowel disease. World J. Gastroenterol. 2014;20:1165–1179. doi: 10.3748/wjg.v20.i5.1165. - DOI - PMC - PubMed
    1. Manichanh C, Borruel N, Casellas F, Guarner F. The gut microbiota in IBD. Nat. Rev. Gastroenterol. Hepatol. 2012;9:599–608. doi: 10.1038/nrgastro.2012.152. - DOI - PubMed
    1. Pavlidis P, et al. Diagnostic and clinical significance of Crohn’s disease-specific pancreatic anti-GP2 and anti-CUZD1 antibodies. Clin. Chem. Lab. Med. 2016;54:249–256. doi: 10.1515/cclm-2015-0376. - DOI - PubMed
    1. Papp M, et al. Rediscovery of the anti-pancreatic antibodies and evaluation of their prognostic value in a prospective clinical cohort of Crohn’s patients: The importance of specific target antigens [GP2 and CUZD1] J. Crohn’s Colitis. 2015;9:659–668. doi: 10.1093/ecco-jcc/jjv087. - DOI - PubMed

Publication types

MeSH terms