. 2021 Feb 16;4(1):219.
doi: 10.1038/s42003-021-01712-2.

Feedback mechanisms stabilise degraded turf algal systems at a CO2 seep site

Affiliations

Feedback mechanisms stabilise degraded turf algal systems at a CO2 seep site

Ben P Harvey et al. Commun Biol. .

Abstract

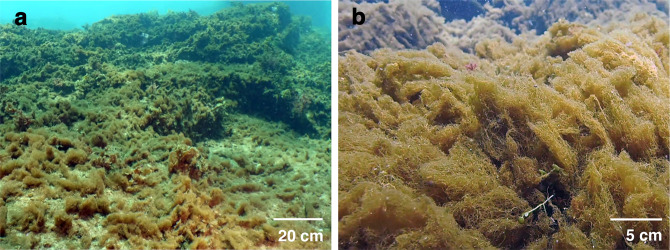
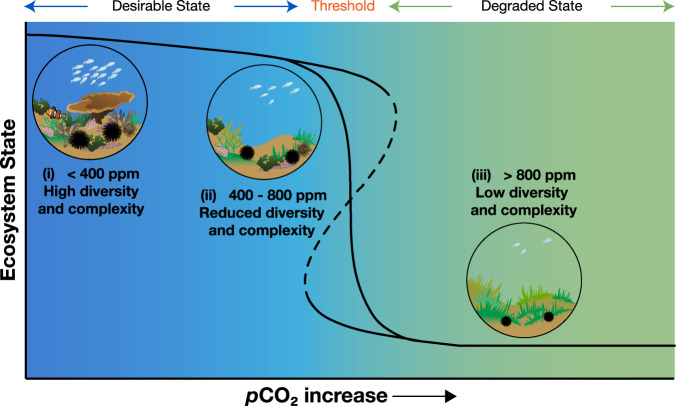
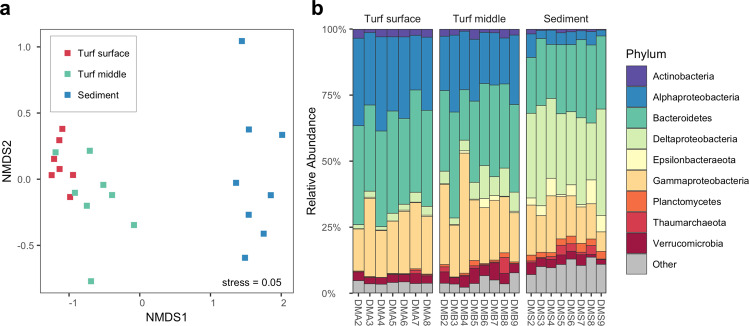
Human activities are rapidly changing the structure and function of coastal marine ecosystems. Large-scale replacement of kelp forests and coral reefs with turf algal mats is resulting in homogenous habitats that have less ecological and human value. Ocean acidification has strong potential to substantially favour turf algae growth, which led us to examine the mechanisms that stabilise turf algal states. Here we show that ocean acidification promotes turf algae over corals and macroalgae, mediating new habitat conditions that create stabilising feedback loops (altered physicochemical environment and microbial community, and an inhibition of recruitment) capable of locking turf systems in place. Such feedbacks help explain why degraded coastal habitats persist after being initially pushed past the tipping point by global and local anthropogenic stressors. An understanding of the mechanisms that stabilise degraded coastal habitats can be incorporated into adaptive management to better protect the contribution of coastal systems to human wellbeing.


Conflict of interest statement

Linn J. Hoffmann is an Editorial Board Member for Communications Biology, but was not involved in the editorial review of, nor the decision to publish this article. The authors declare no additional competing interests.

Figures

Fig. 1
Fig. 1. Extensive coverage of turf algae within the elevated pCO2 areas of Shikine Island CO2 seep.
a In elevated pCO2 locations, turf algae covered most of the available space on shallow sublittoral rock. b By the end of summer, before the arrival of autumn typhoons, opportunistic fast-growing turf algae completely smothered rock surfaces. The predominant species forming the turf algal mat is Biddulphia biddulphiana (J.E.Smith) Boyer (for further description of the turf algal mat, see Supplementary Methods and Harvey et al.).
Fig. 2
Fig. 2. Ecosystem shifts with rising seawater pCO2.
Ocean acidification drives changes that lower coastal biodiversity and habitat complexity. Black solid line highlights a continuous shift (Forward threshold = Reverse threshold) from the ‘Desirable Ecosystem’ with high diversity and complexity, to the ‘Degraded Ecosystem’ with low diversity and complexity. The black dashed line highlights a discontinuous shift (Forward threshold ≠ Reverse threshold) where feedback mechanisms can hinder ecosystem recovery (‘hysteresis’).
Fig. 3
Fig. 3. Influence of pH on the coverage of turf algae, other macroalgae and corals.
Mean cover (%) of turf algae (red circles), other macroalgae (green triangles) and corals (blue squares) along a seawater pHNBS gradient off Shikine Island, Japan. Solid lines represent a negative binomial generalised linear model (df = 99 biologically independent samples), with the dashed lines representing the 95% confidence interval. The pseudo-R2 value of the three models are: turf algae 0.748, other macroalgae 0.773, and corals 0.541.
Fig. 4
Fig. 4. Spatial variability of the carbonate chemistry and dissolved oxygen associated with the turf algae.
Box plots (n = 15 biologically independent locations) of a pHNBS, b dissolved oxygen (mg l−1), and c aragonite saturation state of seawater (Ω). Sediment = sediment below the turf algal mat (indicated by darkly shaded region), Turf Algae =  middle of the turf algal mat (indicated by lightly shaded region), Surface = surface of the turf algal mat, Seawater = water column 2–3 m above the turf algal mat. Note that on c aragonite dissolution is favoured below Ω = 1 (dashed line). For the boxplots, the line inside indicates the median, the upper and lower hinges correspond to the interquartile range, and the upper and lower whiskers extend to the highest and lowest values that are within 1.5 × the interquartile range of the hinge. Outliers beyond these whiskers are indicated with a point. A significant difference between the locations is indicated with a different letter (Kruskal–Wallis with post-hoc using a Dunn test) on the right of each panel.
Fig. 5
Fig. 5. Microchemical environment of turf algae and associated sediments, and its diurnal variability.
a pHNBS profile (mean ± S.E., n = 3 independent microcosms) within the turf algae and sediment in the laboratory incubations. Grey circles show measurements made in the light period, black circles show measurements made in the dark period. Note: 0% refers to the surface of the turf algae. b, c pHNBS measurements (mean ± S.E., n = 3 independent microcosms) during 3-h light-dark cycles in the laboratory incubations (white shading above: light period, black shading above: dark period) at the point of maximal pH in the upper layer of the turf algae (b) and in the sediment below the turf algae (c).
Fig. 6
Fig. 6. Microbial community structure associated with turf algae.
a nMDS plot of microbial community structure associated with turf algae based on Bray–Curtis dissimilarity (n = 8 biologically independent locations). Colours indicate the position within and below the turf algal mat from which samples were collected. b Stacked bar plot of microbial community composition at the phylum level and Proteobacterial class level. The nine most abundant phyla based on total number of reads are displayed, additional phyla are grouped as ‘Other’.
Fig. 7
Fig. 7. Influence of turf algae on the recruitment of other algae.
a Boxplots showing the effects of the presence of turf algae on the recruitment of crustose coralline algae. The presence of the turf algae was classified as no coverage ‘None’ (see b, n = 4 biologically independent tiles), partial coverage ‘Partial’ (see c, n = 3 biologically independent tiles) or total-coverage ‘Total’ (see d, n = 4 biologically independent tiles). For the boxplots, the line inside indicates the median, the upper and lower hinges correspond to the interquartile range, and the upper and lower whiskers extend to the highest and lowest values that are within 1.5 × the interquartile range of the hinge. A significant difference between the coverage groups is indicated with a different letter (ANOVA with Tukey’s HSD post-hoc test).
Fig. 8
Fig. 8. Reverse threshold of turf algae transplanted back along the pH gradient compared to their natural percentage cover.
Natural turf algal cover (grey) and turf algal assemblage remaining following a 1-month (light blue) and 2-month (dark blue) transplant of pre-established (fully covered) turf algal assemblage tiles into each site (indicated by their mean pHNBS ± S.E.). Natural turf algal cover (n = 6 biologically independent measurements at each time point, summarised from Fig. 3) and the turf algal assemblage transplants (n = 5 biologically independent tiles at each site) are shown as mean ± S.E.

References

    1. Halpern BS, et al. A global map of human impact on marine ecosystems. Science. 2008;319:948–952. doi: 10.1126/science.1149345. - DOI - PubMed
    1. Conversi A, et al. A holistic view of marine regime shifts. Philos. Trans. R. Soc. B Biol. Sci. 2015;370:20130279. doi: 10.1098/rstb.2013.0279. - DOI
    1. Möllmann C, Folke C, Edwards M, Conversi A. Marine regime shifts around the globe: theory, drivers and impacts. Philos. Trans. R. Soc. B Biol. Sci. 2015;370:20130260. doi: 10.1098/rstb.2013.0260. - DOI
    1. Scheffer M, Carpenter SR. Catastrophic regime shifts in ecosystems: linking theory to observation. Trends Ecol. Evol. 2003;18:648–656. doi: 10.1016/j.tree.2003.09.002. - DOI
    1. Hastings A, Wysham DB. Regime shifts in ecological systems can occur with no warning. Ecol. Lett. 2010;13:464–472. doi: 10.1111/j.1461-0248.2010.01439.x. - DOI - PubMed

Publication types

LinkOut - more resources