

A novel digital approach to describe real world outcomes among patients with constipation
- PMID: 33594206
- PMCID: PMC7887258
- DOI: 10.1038/s41746-021-00391-x
A novel digital approach to describe real world outcomes among patients with constipation
Erratum in
-
Author Correction: A novel digital approach to describe real world outcomes among patients with constipation.NPJ Digit Med. 2021 Mar 24;4(1):61. doi: 10.1038/s41746-021-00434-3. NPJ Digit Med. 2021. PMID: 33762672 Free PMC article. No abstract available.
Abstract
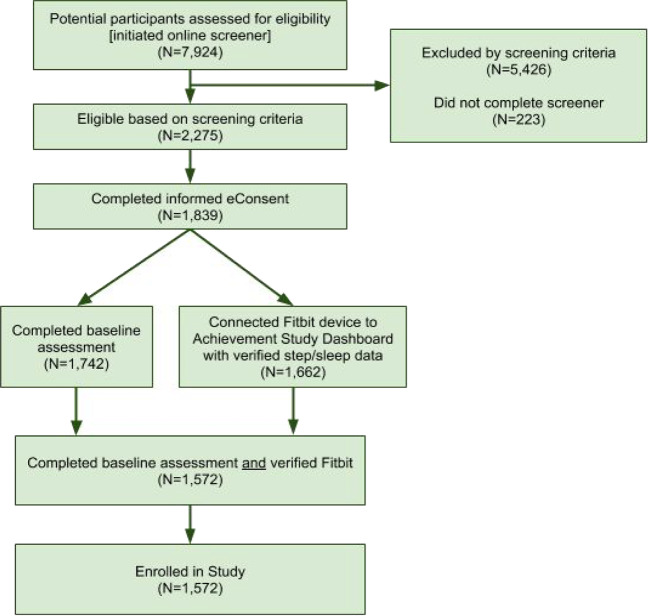
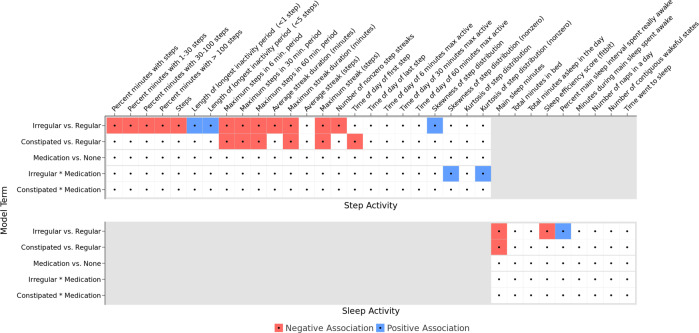
Understanding day-to-day variations in symptoms and medication management can be important in describing patient centered outcomes for people with constipation. Patient Generated Health Data (PGHD) from digital devices is a potential solution, but its utility as a tool for describing experiences of people with frequent constipation is unknown. We conducted a virtual, 16-week prospective study of individuals with frequent constipation from an online wellness platform that connects mobile consumer digital devices including wearable monitors capable of passively collecting steps, sleep, and heart rate data. Participants wore a Fitbit monitoring device for the study duration and were administered daily and monthly surveys assessing constipation symptom severity and medication usage. A set of 38 predetermined day-level behavioral activity metrics were computed from minute-level data streams for steps, sleep and heart rate. Mixed effects regression models were used to compare activity metrics between constipation status (irregular or constipated vs. regular day), medication use (medication day vs. non-medication day) and the interaction of medication day with irregular or constipation days, as well as to model likelihood to treat with constipation medications based on daily self-reported symptom severity. Correction for multiple comparisons was performed with the Benjamini-Hochberg procedure for false discovery rate. This study analyzed 1540 enrolled participants with completed daily surveys (mean age 36.6 sd 10.0, 72.8% female, 88.8% Caucasian). Of those, 1293 completed all monthly surveys and 756 had sufficient Fitbit data density for analysis of activity metrics. At a daily-level, 22 of the 38 activity metrics were significantly associated with bowel movement or medication treatment patterns for constipation. Participants were measured to have fewer steps on irregular days compared to regular days (-200 steps, 95% CI [-280, -120]), longer periods of inactivity on constipated days (9.1 min, 95% CI [5.2, 12.9]), reduced total sleep time on irregular and constipated days (-2.4 min, 95% CI [-4.3, -0.4] and -4.0 min, 95% CI [-6.5, -1.4], respectively). Participants reported greater severity of symptoms for bloating, hard stool, difficulty passing, and painful bowel movements on irregular, constipation and medication days compared to regular days with no medication. Interaction analysis of medication days with irregular or constipation days observed small increases in severity compared to non-medication days. Participants were 4.3% (95% CI 3.2, 5.3) more likely to treat with medication on constipated days versus regular. No significant increase in likelihood was observed for irregular days. Daily likelihood to treat increased for each 1-point change in symptom severity of bloating (2.4%, 95% CI [2.0, 2.7]), inability to pass (2.2%, 95% CI [1.4, 3.0]) and incomplete bowel movements (1.3%, 95% CI [0.9, 1.7]). This is the first large scale virtual prospective study describing the association between passively collected PGHD and constipation symptoms and severity at a day-to-day granularity level. Constipation status, irregular or constipated, was associated with a number of activity metrics in steps and sleep, and likelihood to treat with medication increased with increasing severity for a number of constipation symptoms. Given the small magnitude of effect, further research is needed to understand the clinical relevance of these results. PGHD may be useful as a tool for describing real world patient centered experiences for people with constipation.
Conflict of interest statement
Sabine Landes, Petra Kammann, Beatrice Bois De Fer, and Robert Lange are employees of Sanofi-Aventis. Wei-Nchih Lee, Allison Shapiro, and Benjamin Bradshaw are employees of Evidation Health. Evidation Health designed the study in collaboration with Sanofi-Aventis and performed the study. The authors have not signed any agreement with the funding sponsor that will bias the results of this research in any way.
Figures
References
LinkOut - more resources
Full Text Sources
Other Literature Sources
