[Preprint]. 2021 Feb 10:rs.3.rs-208849.
doi: 10.21203/rs.3.rs-208849/v1.

SARS-CoV-2 European resurgence foretold: interplay of introductions and persistence by leveraging genomic and mobility data

Affiliations

SARS-CoV-2 European resurgence foretold: interplay of introductions and persistence by leveraging genomic and mobility data

Philippe Lemey et al. Res Sq. .

Update in

  • Untangling introductions and persistence in COVID-19 resurgence in Europe.
    Lemey P, Ruktanonchai N, Hong SL, Colizza V, Poletto C, Van den Broeck F, Gill MS, Ji X, Levasseur A, Oude Munnink BB, Koopmans M, Sadilek A, Lai S, Tatem AJ, Baele G, Suchard MA, Dellicour S. Lemey P, et al. Nature. 2021 Jul;595(7869):713-717. doi: 10.1038/s41586-021-03754-2. Epub 2021 Jun 30. Nature. 2021. PMID: 34192736 Free PMC article.

Abstract

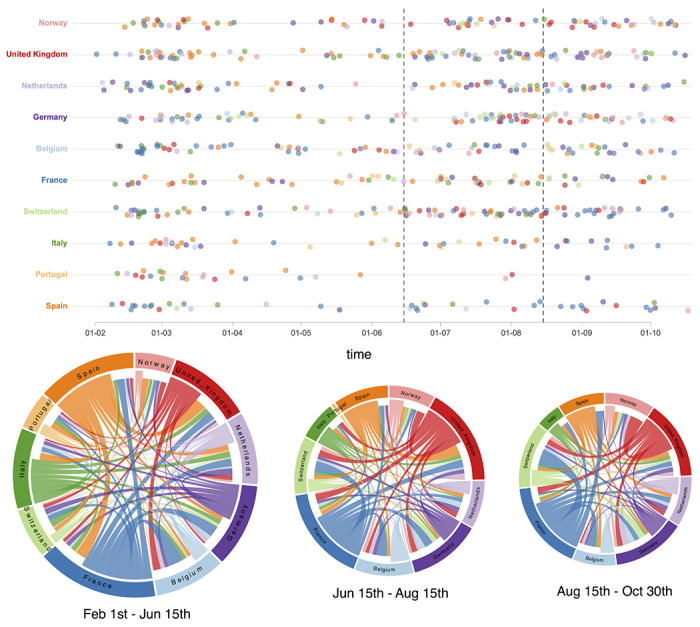
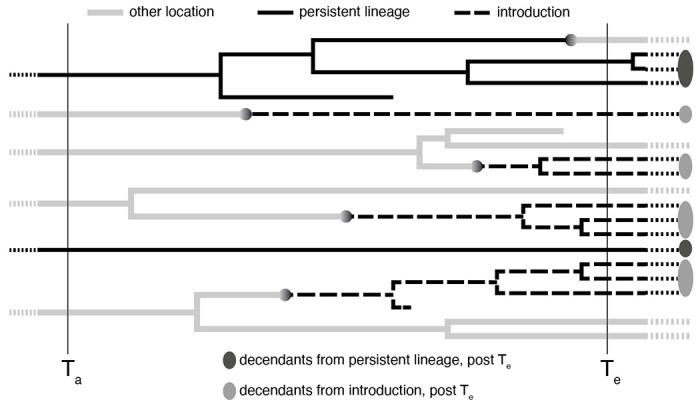
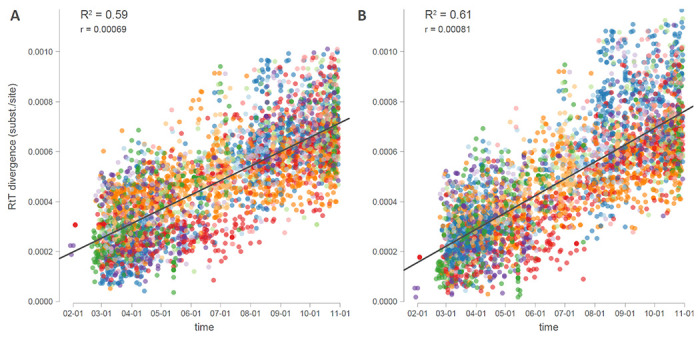
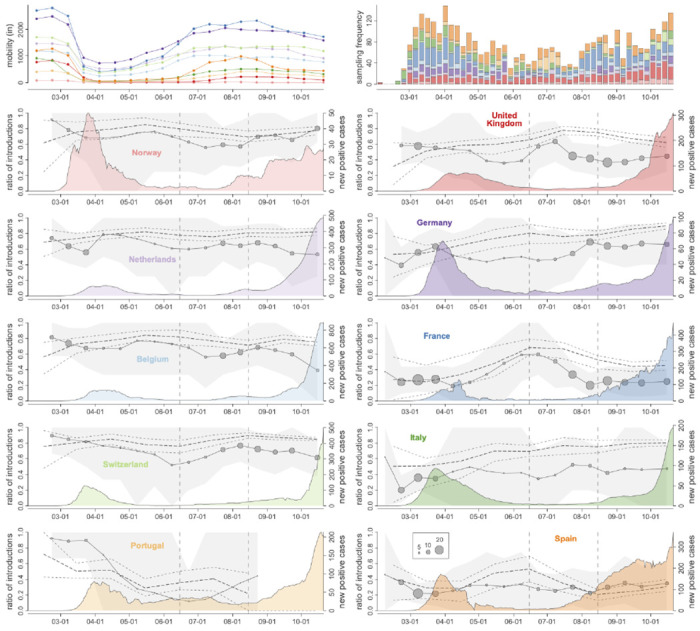
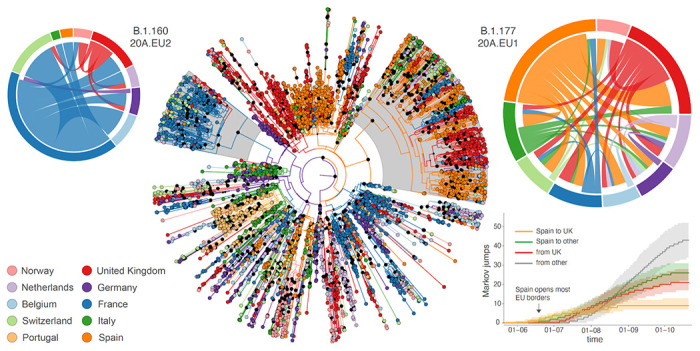
Following the first wave of SARS-CoV-2 infections in spring 2020, Europe experienced a resurgence of the virus starting late summer that was deadlier and more difficult to contain. Relaxed intervention measures and summer travel have been implicated as drivers of the second wave. Here, we build a phylogeographic model to evaluate how newly introduced lineages, as opposed to the rekindling of persistent lineages, contributed to the COVID-19 resurgence in Europe. We inform this model using genomic, mobility and epidemiological data from 10 West European countries and estimate that in many countries more than 50% of the lineages circulating in late summer resulted from new introductions since June 15th. The success in onwards transmission of these lineages is predicted by SARS-CoV-2 incidence during this period. Relatively early introductions from Spain into the United Kingdom contributed to the successful spread of the 20A.EU1/B.1.177 variant. The pervasive spread of variants that have not been associated with an advantage in transmissibility highlights the threat of novel variants of concern that emerged more recently and have been disseminated by holiday travel. Our findings indicate that more effective and coordinated measures are required to contain spread through cross-border travel.


Conflict of interest statement

Competing Interests

The authors declare no competing interests.

Figures

Extended Data Figure 1.
Extended Data Figure 1.. Monthly international mobility data matrices: international air traffic data, international Facebook mobility data, and international mobility data.
For Facebook data, we also report the single social connectedness index matrix (SCI, B).
Extended Data Figure 2.
Extended Data Figure 2.. Posterior summary of the GLM random effects.
The posterior distribution for each random effect in log space is summarized as an error bar plot. The mean effect size is represented by a white horizontal line while the whiskers represent the 95% HPD intervals.
Extended Data Figure 3.
Extended Data Figure 3.. Estimated introductions through time in the 10 European countries and circular migration flow plots summarizing the estimated transitions between the countries for different time intervals throughout the SARS-CoV-2 evolutionary history.
The introductions through time serve as an illustration and are based on the Markov jump history in the MCC tree. We note that the posterior distribution of trees is accompanied with considerable uncertainty about the location of origin, destination and timing of the transitions, which is difficult to appropriately visualize. The circular migration flow plots are based on the posterior expectations of the Markov jumps. The size of the plots reflects the total number of transitions for each period. In these plots, migration flow out of a particular location starts close to the outer ring for that origin location whereas migration flow into a particular location ends more distant from the outer ring for that destination location.
Extended Data Figure 4.
Extended Data Figure 4.. Conceptual representation of persistent lineages and introductions during the time interval delineated by the evaluation time (Te) and the ancestral time (Ta).
At Te, we evaluate how many lineages are circulating in the location of interest, in this case 12 (lineages in other locations are represented by thick grey branches). We subsequently identify whether these lineages maintained this location up to Ta in their ancestry or whether they result from an introduction event in the time interval of interest. By determining whether other lineages circulating in the location of interest at Te are descendants of the same persistent lineage or whether they share an introduction event, we identify the unique persistent lineages or introductions, in this case 2 and 4 respectively. In addition to the proportion of unique introductions (4/6), we also summarize the proportion of their descendants at Te (9/(9+3) in this case) and the proportion of their descendants in terms of sampled tips after Te. Those tips are not shown here but conceptually represented for both introductions and persistent lineages by ovals.
Extended Data Figure 5.
Extended Data Figure 5.. Estimated geographic origin of viral influx over the summer n(June 15th - August 15th, 2020) in each country.
Each barplot summarizes the posterior Markov jump estimates into a specific country.
Extended Data Figure 6.
Extended Data Figure 6.. Phylogeographic transitions for lineages B1.1777/20A.EU1 and B1.160/20A.EU2.
Cumulative phylogeographic transitions are summarized as posterior mean estimates with 95% HPD intervals over time for 4 types of Markov jumps. For B1.1777/20A.EU1: i) from Spain to the United Kingdom (UK), ii) from Spain to other countries, iil) from the UK, and iv) from other countries; For B1.160/20A.EU2: i) from France to the UK, ii) from France toother countries, iil) from the UK, and iv) from other countries.
Extended Data Figure 7.
Extended Data Figure 7.. Comparison between Google and Facebook aggregate international mobility data.
We summarize monthly correlations using scatter plots and Spearman’s rank correlation. Each dot in the scatter plots corresponds to a specific pair of European countries considered in our study.
Extended Data Figure 8.
Extended Data Figure 8.. Root-to-tip divergence as a function of sampling time for the 3959 genome data set with a different rooting of the same maximum likelihood tree.
A. Tree rooted according to the best-fitting root under the heuristic residual mean squared criterio. B. Tree rooted along the branch leading to the cluster of 3 Bavarian genomes that resulted from an independent introduction into Europe.
Figure 1.
Figure 1.. Mobility, genome sampling, case counts and phylogeographic summaries through time for 10 West European countries.
The upper left panel summarizes the Google mobility influx by country from the other 10 countries for two-week intervals, while the upper right panel depicts the weekly genome sampling by country used in the phylogeographic analysis. In the remaining panels, we plot for each country the ratio of introductions over the total viral flow from and to that country (for two-week intervals) and a monthly normalized entropy measure summarizing the phylogenetic structure of country-specific transmission chains. The posterior mean ratios of introductions are depicted with circles that have a size proportional to the total number of transitions from and to that country and the grey surface represents the 95% highest posterior density (HPD) intervals. The posterior mean normalized entropies and 95% HPD intervals are depicted by dotted lines. These normalized entropy measures indicate how phylogenetically structured the epidemic is in each country, and ranges from 0 (perfectly structured, e.g a single country-specific cluster) to 1 (unstructured interspersion of country-specific sequences across the entire SARS-CoV-2 phylogeny). The introduction ratios and normalized entropy measures are superimposed over the number of COVID-19 cases reported for each country through time (coloured density plot). The two vertical dashed lines represent the summer time interval (June 15 and August 15, 2020) for which we subsequently evaluate introductions versus persistence (Figure 2).
Figure 2.
Figure 2.. Posterior estimates for relative importance of lineage introduction events among West European countries.
For each country, we report three summaries (posterior mean and 95% HPD intervals): (1) the ratio of unique introductions over the total number of unique persisting lineages and unique introductions between June 15 and August 15, 2020, (2) the ratio of descendant lineages from these unique introduction events over the total number of descendants circulating on August 15, 2020, and (3) the ratio of descendant taxa from these unique introductions over the total number of descendant taxa sampled after August 15, 2020 (cfr. Extended Data Figure 4). The dot sizes are proportional to: (1) the total number of unique lineage introductions identified between June 15 and August 15, 2020, (2) the total number of lineages inferred on August 15, 2020, and (3) the total number of descendant sequences after August 15, 2020. The third ratio is not included for Portugal due to insufficient sequences sampled after August 15, 2020.
Figure 3.
Figure 3.. Phylogeographic estimates of SARS-CoV-2 spread in western Europe.
The radial tree in the center represents the maximum clade credibility tree summary of the Bayesian inference. Colors correspond to the countries in the legend. Two clades corresponding to B1.1777/20A.EU1 and B1.160/20A.EU2 are highlighted in grey. The circular migration flow plots for these variants are based on the posterior expectations of the Markov jumps. In these plots, migration flow out of a particular location starts close to the outer ring for that origin location whereas migration flow into a particular location ends more distant from the outer ring for that destination location. For B1.1777/20A.EU1, we summarize phylogeographic transitions as mean estimates with 95% HPD intervals over time for 4 types of Markov jumps: i) from Spain to the United Kingdom, ii) from Spain to other countries, iil) from the United Kingdom, and iv) from other countries.

References

    1. Riley S. et al. High prevalence of SARS-CoV-2 swab positivity and increasing R number in England during October 2020: REACT-1 round 6 interim report. bioRxiv (2020) doi: 10.1101/2020.10.30.20223123 - DOI
    1. Data on 14-day notification rate of new COVID-19 cases and deaths. https://www.ecdc.europa.eu/en/publications-data/data-national-14-day-not... (2021).
    1. COVID-19 situation update for the EU/EEA, as of week 3, updated 28 January 2021 https://www.ecdc.europa.eu/en/cases-2019-ncov-eueea.
    1. Rambaut Andrew, Loman Nick, Pybus Oliver, Barclay Wendy, Barrett Jeff, Carabelli Alesandro, Connor Tom, Peacock Tom, Robertson David L, Volz Erik, on behalf of COVID-19 Genomics Consortium UK (CoG-UK). Preliminary genomic characterisation of an emergent SARS-CoV-2 lineage in the UK defined by a novel set of spike mutations, virological.orghttps://virological.org/t/preliminary-genomic-characterisation-of-an-eme... (2020).
    1. Volz E. et al. Transmission of SARS-CoV-2 Lineage B.1.1.7 in England: Insights from linking epidemiological and genetic data. bioRxiv (2021) doi: 10.1101/2020.12.30.20249034 - DOI

Publication types

LinkOut - more resources