[Preprint]. 2021 Feb 10:2021.02.09.430269.
doi: 10.1101/2021.02.09.430269.

Integrated plasma proteomic and single-cell immune signaling network signatures demarcate mild, moderate, and severe COVID-19

Affiliations

Integrated plasma proteomic and single-cell immune signaling network signatures demarcate mild, moderate, and severe COVID-19

Dorien Feyaerts et al. bioRxiv. .

Update in

  • Integrated plasma proteomic and single-cell immune signaling network signatures demarcate mild, moderate, and severe COVID-19.
    Feyaerts D, Hédou J, Gillard J, Chen H, Tsai ES, Peterson LS, Ando K, Manohar M, Do E, Dhondalay GKR, Fitzpatrick J, Artandi M, Chang I, Snow TT, Chinthrajah RS, Warren CM, Wittman R, Meyerowitz JG, Ganio EA, Stelzer IA, Han X, Verdonk F, Gaudillière DK, Mukherjee N, Tsai AS, Rumer KK, Jacobsen DR, Bjornson-Hooper ZB, Jiang S, Saavedra SF, Valdés Ferrer SI, Kelly JD, Furman D, Aghaeepour N, Angst MS, Boyd SD, Pinsky BA, Nolan GP, Nadeau KC, Gaudillière B, McIlwain DR. Feyaerts D, et al. Cell Rep Med. 2022 Jul 19;3(7):100680. doi: 10.1016/j.xcrm.2022.100680. Epub 2022 Jun 28. Cell Rep Med. 2022. PMID: 35839768 Free PMC article.

Abstract

The biological determinants of the wide spectrum of COVID-19 clinical manifestations are not fully understood. Here, over 1400 plasma proteins and 2600 single-cell immune features comprising cell phenotype, basal signaling activity, and signaling responses to inflammatory ligands were assessed in peripheral blood from patients with mild, moderate, and severe COVID-19, at the time of diagnosis. Using an integrated computational approach to analyze the combined plasma and single-cell proteomic data, we identified and independently validated a multivariate model classifying COVID-19 severity (multi-class AUCtraining = 0.799, p-value = 4.2e-6; multi-class AUCvalidation = 0.773, p-value = 7.7e-6). Features of this high-dimensional model recapitulated recent COVID-19 related observations of immune perturbations, and revealed novel biological signatures of severity, including the mobilization of elements of the renin-angiotensin system and primary hemostasis, as well as dysregulation of JAK/STAT, MAPK/mTOR, and NF-κB immune signaling networks. These results provide a set of early determinants of COVID-19 severity that may point to therapeutic targets for the prevention of COVID-19 progression.


Figures

Figure 1 -
Figure 1 -. Combined plasma and single-cell proteomic profiling of patients with mild, moderate, and severe COVID-19.
A Patients with mild (50), moderate (21), and severe (26) COVID-19 were examined together with 40 healthy controls. B Schematic representation of the experimental workflow. Plasma proteins were measured using the Olink Explore 1536 assay, while PBMC were stimulated with either LPS+CL097, IFNα+IL-2+IL-4+IL-6, PMA+ionomycin (PI), or left unstimulated (Unstim) before barcoding, antibody staining, and analysis by single-cell mass cytometry. C–D Correlation networks of single-cell mass cytometry and proteome dataset. Each node represents a feature, with edges representing the correlation between features (cor > 0.9). Node size reflects −log10 of p-value of the correlation with severity (Spearman) and node color represents the different data layers. E Bivariate scatterplot of patients with COVID-19 and healthy controls plotted along factors 3 and 10 identified by multi-omic factor analysis (MOFA; see Figure S2).
Figure 2 -
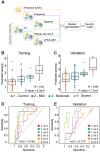
Figure 2 -. Integrated modeling of plasma and single-cell proteomic events categorizes COVID-19 severity
A Integration of all six data layers (proteome, frequency, baseline signaling, LPS/CL097 signaling response, IFNα/IL-2/IL-4/IL-6 signaling response, and PI signaling response) using a stacked generalization (SG) method. B–C Outcome of predicted vs true disease severity derived from SG model for the B training (R = 0.61, p-value = 4.2e–6, n = 74) and C validation cohort (R = 0.69, p-value = 7.7e−6, n = 73). D–E Multi-class area under the curve receiver operating characteristic (ROC) analysis of D the training (AUC = 0.799, n = 74) and E validation (AUC = 0.773, n = 73) severity model (see Table S2 for individual AUCs). 1 = control, 2 = mild, 3 = moderate, and 4 = severe.
Figure 3 -
Figure 3 -. An iterative bootstrapping method identifies robust informative features for the differentiation of mild, moderate, and severe COVID-19.
A Workflow of the iterative bootstrap method used to identify informative features in the six data layers of the severity model. A LASSO regression model was run 1,000 times on random sub-samples with replacement for each data layer, Xi, then the number of times an individual feature was selected in one of the bootstrap iterations was counted and the features were ranked according to the frequency of selection in the bootstrap models. B–C Correlation network depicting single-cell (B) or plasma (C) proteomic features. Edges represent the correlation between features (Spearman cor > 0.9). Blue/orange nodes highlight positive/negative correlation with disease severity. Node size reflects −log10 of p-value (Spearman). Communities containing the bootstrap-selected informative single-cell (B) or plasma (C) proteomic features are highlighted and annotated.
Figure 4 -
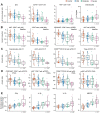
Figure 4 -. Severity model features reveal biological signatures that demarcate patients with mild, moderate, and severe COVID-19.
Boxplots, classified by disease severity, showing features informative to the model, including the correlation of the feature with disease severity (Spearman coefficient). A Frequency features are shown as a percentage of mononuclear cells. Granulocytes are shown as a percentage of singlets. pDC and granulocyte frequency are plotted on a log-scale. B Immune cell signaling at baseline (arcsinh transformed values; see methods). C Immune cell signaling response to PI stimulation is reported as the arcsinh transformed ratio over the baseline signaling response (see methods). D Immune cell signaling responses to IFNα/IL-2/IL-4/IL-6 (IFN/IL) stimulation are reported as the arcsinh transformed ratio over the baseline signaling response (see methods). E Plasma protein levels are reported as the normalized protein expression, an arbitrary unit provided by the Olink assay. Tmem = memory T cell; MERTK = tyrosine-protein kinase Mer.

References

    1. Argelaguet R., Velten B., Arnol D., Dietrich S., Zenz T., Marioni J.C., Buettner F., Huber W., and Stegle O.. 2018. Multi-Omics Factor Analysis-a framework for unsupervised integration of multi-omics data sets. Mol Syst Biol 14:e8124. - PMC - PubMed
    1. Arunachalam P.S., Wimmers F., Mok C.K.P., Perera R., Scott M., Hagan T., Sigal N., Feng Y., Bristow L., Tak-Yin Tsang O., Wagh D., Coller J., Pellegrini K.L., Kazmin D., Alaaeddine G., Leung W.S., Chan J.M.C., Chik T.S.H., Choi C.Y.C., Huerta C., Paine McCullough M., Lv H., Anderson E., Edupuganti S., Upadhyay A.A., Bosinger S.E., Maecker H.T., Khatri P., Rouphael N., Peiris M., and Pulendran B.. 2020. Systems biological assessment of immunity to mild versus severe COVID-19 infection in humans. Science 369:1210–1220. - PMC - PubMed
    1. Assarsson E., Lundberg M., Holmquist G., Bjorkesten J., Thorsen S.B., Ekman D., Eriksson A., Rennel Dickens E., Ohlsson S., Edfeldt G., Andersson A.C., Lindstedt P., Stenvang J., Gullberg M., and Fredriksson S.. 2014. Homogenous 96-plex PEA immunoassay exhibiting high sensitivity, specificity, and excellent scalability. PLoS One 9:e95192. - PMC - PubMed
    1. Bach F.R. 2008. Bolasso: model consistent Lasso estimation through the bootstrap. ICML ‘08: Proceedings of the 25th international conference on Machine learning 33–40.
    1. Benjamini B., and Hochberg Y.. 1995. Controlling the False Discovery Rate: A Practical and Powerful Approach to Multiple Testing. Journal of the Royal Statistical Society: Series B (Methodological) 57:289–300.

Publication types

LinkOut - more resources