[Preprint]. 2021 Feb 9:2021.02.09.430314.
doi: 10.1101/2021.02.09.430314.

Disruption of nuclear architecture as a cause of COVID-19 induced anosmia

Affiliations

Disruption of nuclear architecture as a cause of COVID-19 induced anosmia

Marianna Zazhytska et al. bioRxiv. .

Update in

Abstract

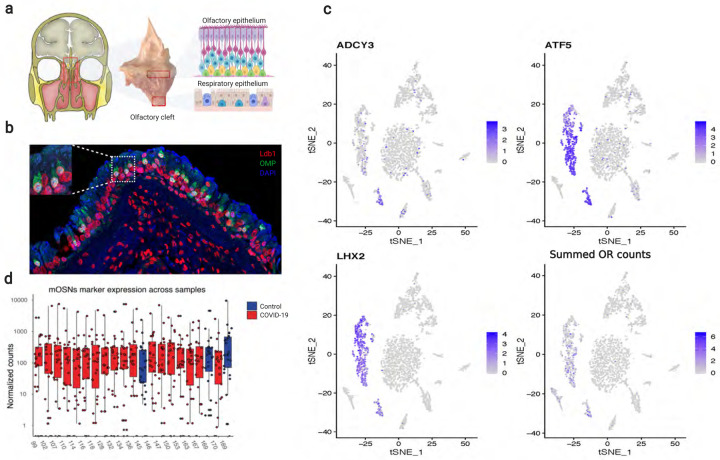
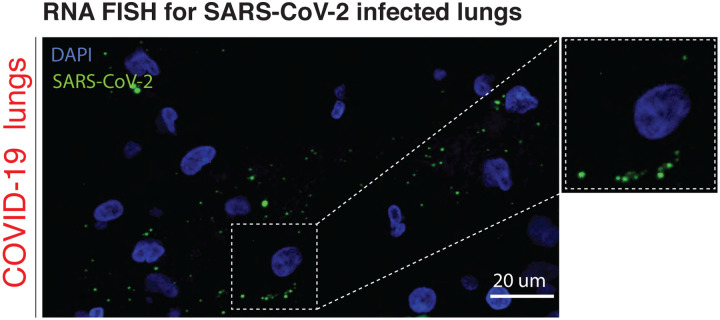
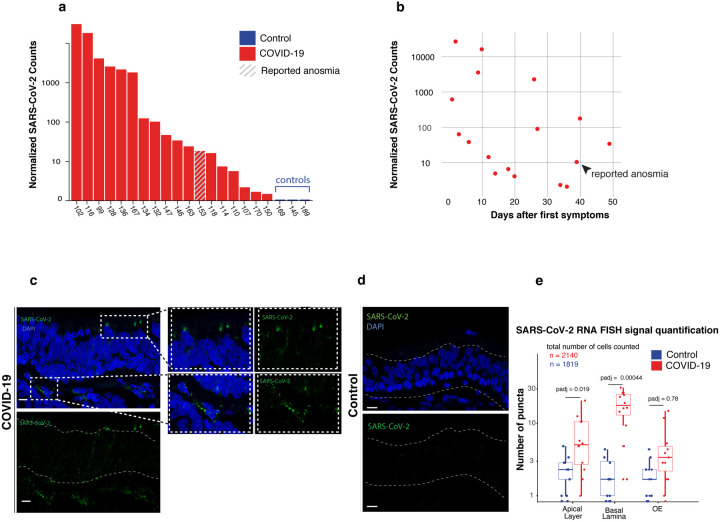
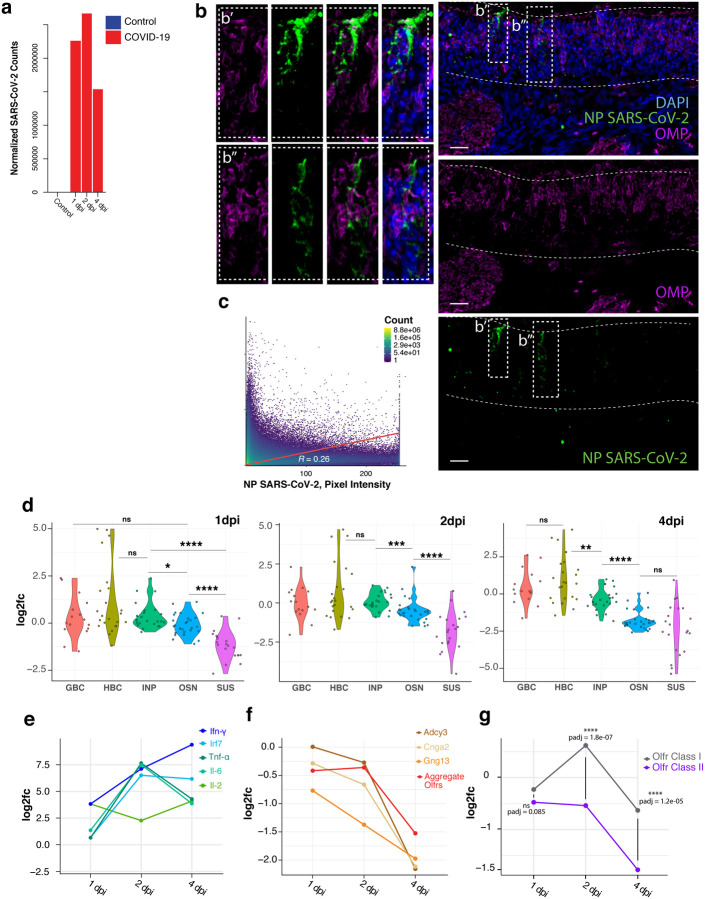
Olfaction relies on a coordinated partnership between odorant flow and neuronal communication. Disruption in our ability to detect odors, or anosmia, has emerged as a hallmark symptom of infection with SARS-CoV-2, yet the mechanism behind this abrupt sensory deficit remains elusive. Here, using molecular evaluation of human olfactory epithelium (OE) from subjects succumbing to COVID-19 and a hamster model of SARS-CoV-2 infection, we discovered widespread downregulation of olfactory receptors (ORs) as well as key components of their signaling pathway. OR downregulation likely represents a non-cell autonomous effect, since SARS-CoV-2 detection in OSNs is extremely rare both in human and hamster OEs. A likely explanation for the reduction of OR transcription is the striking reorganization of nuclear architecture observed in the OSN lineage, which disrupts multi-chromosomal compartments regulating OR expression in humans and hamsters. Our experiments uncover a novel molecular mechanism by which a virus with a very selective tropism can elicit persistent transcriptional changes in cells that evade it, contributing to the severity of COVID-19.


Figures

Extended data Figure 1
a, En bloc resection of the cribriform plate along with underlying mucosa from the olfactory cleft, which contains OE more superiorly and respiratory epithelium below. b, section of human olfactory epithelium stained for OMP (green) and Ldb1 (red), an OSN markers. Nuclei are labeled with DAPI (blue). c tSNE plot representing clustering of FAC-sorted cell populations from the dissected region. ADCY3, ATF5 and LHX2 positive cells (blue) represent OSN identity. Summed OR counts confirm the cell identity. d, distribution of thirty OSN-specific markers previously identified from mouse scRNA-seq experiments across human samples used for the study.
Extended data Figure 2
a, RNA FISH against SARS-CoV-2 in confirmed SARS-CoV-2+ human lung. Paraffin embedded lung sections show punctate fluorescent signal in proximity of nuclei counterstained with DAPI, showing the presence of abundant viral particles.
Extended data Figure 3
a, Log2 fold change expression of cell type-specific markers in the human OE. Red line depicts padj=0.05. Mature OSNs contain the highest number of significantly downregulated genes, followed by immediate neuronal precursors (INPs). b, Correlation of viral counts to normalized OR aggregate counts (green) and normalized Adcy3 counts (purple). The correlation coefficient and the significance level (p-value) were calculated with Pearson correlation test (p-value = 0.2699) and confirmed with Kendall’s rank correlation test (p-value = 0.2631) for Adcy3. Similarly, OR aggregate expression shows no significant correlation (p = 0.5319) which was confirmed with Kendall’s rank correlation test (p= 0.265). c, Regression analysis of Adcy3 and OR aggregate expression with age. No significant correlation was found in our cohort of samples which include individuals from 58 to 92 years of age. The statistical test used are the sample as reported in 3b. d, Violin plot of the inflammatory response across all samples show no changes in distribution. P = 0.1468 was computed using Wilcoxon rank sum. The list of genes used corresponds to the GO category GO:0097194. e, log2FC of Ifn-g, TNF-a, Il-2, Il-6 on human OE specimens with different intervals from symptom manifestation to tissue harvesting (from 0 to 48 days).
Extended data Figure 4
a, Immunohistochemistry for OMP (magenta) and SARS-CoV-2 nucleocapside, NP, (green) in hamster OE at 4dpi show one infected cell. White arrows indicate OMP-positive axon bundles which show no stain for SARSCoV-2 NP. b, Immunohistochemistry for OMP (magenta) and SARS-CoV-2 (green) in hamster OE at 4 dpi. Representative image of an area of the tissue with multiple cells infected. No SARS-CoV-2 NP signal in the axon bundles was found. c, Log2 fold change expression of cell type-specific markers in hamster OE 1,2 and 3 days post infection. Sus markers are significantly downregulated from dpi 1, with mOSN and INP markers being downregulated at later days. d, Violin plot of apoptotic regulation response across all samples show no changes in distribution was computed using Wilcoxon rank sum. The list of genes used corresponds to the GO category GO:0042981. e, Log2 fold change expression of class I and class II ORs in human OE shows that that SARSCoV-2 infection induces stronger downregulation of class II ORs.
Extended data Figure 5
a, b Representative FACS data for control and SARS-CoV-2+ human and hamster specimens. Fixed DAPI positive, Lhx2/Atf5 double positive for human and Lhx2/OMP double positive for hamster, respectively, nuclei were collected for in situ HiC. c,d HiC map representing whole genome view on chromatin contacts for control (triangle below diagonal) and SARS-CoV-2 infected (triangle above diagonal) human and hamster respectively. e,f Chromatin compartments in human OSNs harboring Adcy3, Gng13 and Gfy in control (left e, top f) and SARS-CoV-2 samples (right e, bottom f). Arrows indicate compartments with genes involved (genomic annotation in green). g, annotated contact domains containing OR clusters (green bars); control domains propagate as blue ‘triangles’ below diagonal and for SARS-CoV-2 domains are indicated in ‘triangle’ above diagonal. h, the same for hamster.
Extended data Figure 6
Chromatin compartments in human OSNs harboring Adcy3, Omp, Rtp1, Gng13, Gfy, Atf5 and Lhx2 in control (top and left in the bottom panel) and SARS-CoV-2 samples (bottom and right in the bottom panel). Arrows indicate compartments with genes involved (genomic annotation in green).
Figure 1
Figure 1
a, RNA-seq analysis of SARS-CoV-2 genomic reads in 19 human olfactory epithelium biopsies from COVID-19 patients (red) and 3 controls (blue). To account for differences in the viral load, SARS-CoV-2 raw counts were normalized to the hg38 genome and plotted as DESeq2’s median ratio normalization (MRN). The striped bar highlights the only sample with known anosmia. b, Normalized SARS-CoV-2 counts versus the number of days between the first symptoms of COVID-19 and autopsy collection. Arrow indicates the anosmic sample. c,d, Maximum intensity projections of confocal microscopy images of SARS-CoV-2 RNA FISH (green) in human olfactory epithelium of infected (c) and control (d) biopsies. This probe targets the antisense strand of the S gene, allowing detection of replicating virus. Nuclei are counterstained with DAPI. SARS-CoV-2 signal is detected in the apical layers of the epithelium, in close proximity to the sustentacular cells and basally, in the lamina propria. e, Quantification of RNA FISH signal at the apical, neuronal and basal layers of infected and control human OE sections suggests that the signal at the neuronal layer is non-specific whereas at the apical and basal layers is significantly enriched on infected vs control OE.
Figure 2
Figure 2
a, OE marker expression in SARS-CoV-2 infected and control specimens. Schematic representation of the cell types at different stages of differentiation, from the bottom: GBC (globose basal cells), HBCs (horizontal basal cells), INPs (immediate neuronal precursors), mOSNs (mature OSN) and SUS (sustentacular cells). A paired, two-tailed Wilcoxon rank sum test was used to determine whether the mean expression was different between SARS-CoV-2+ and controls. No significant changes were detected, except for mOSNs. b, Violin plot of apoptotic regulation response across all samples show no changes in distribution. p = 0.6891 was computed using Wilcoxon rank sum. The list of genes used corresponds to the GO category GO:0097194. c, Boxplot representation of the normalized counts (MRN) grouped in SARS-CoV-2+ positive and control samples for Adcy3, Gfy, Gng13, Rtp1, Cnga2, and aggregate OR mRNAs (highlighted in grey); padj values were generated with DESeq2 using the Benjamini–Hochberg method. Aggregate OR expression p value was calculated using two-tailed Wald test. Arrow indicates anosmic sample d, Distribution of aggregate OR mRNA across all human OE samples. The biopsy sample with known anosmia is highlighted with stripes. e, heatmap depicting expression of each OR gene in 3 control and 19 SARS-CoV-2 infected OE specimens.
Figure 3
Figure 3
a, RNA-seq analysis of SARS-CoV-2 genomic reads in hamster olfactory epithelium following intranasal inoculation of SARS-CoV-2 and harvested at 1, 2, and 4 days post SARS-CoV-2 nasal infection (dpi). SARSCoV-2 raw counts were normalized to the MesAur1.0 genome and plotted as DESeq2’s median ratio normalization (MRN). No mapped counts were found in the mock-injected control. b, Representative immunofluorescence image of co-staining against SARS-CoV-2 NP (green) and OMP (magenta). c, Colocalization analysis of OMP and SARS-CoV-2 NP shows no correlation between the two fluorescent signals. d, OE marker expression in hamster OEs 1, 2, and 4 days post SARS-CoV-2 infection, show immediate downregulation of sustentacular-specific markers, followed by delayed reduction of OSN and INP markers by day 4. e, Time course of inflammatory response genes Ifn-γ, TNF-α, Il-2, Il-6 plotted as log2FC at three different time points, 1dpi, 2dpi and 4dpi show increased expression of the inflammatory response. f, Time course plot of Adcy3, OR aggregate expression, Gng13 and Cnga2 log2FC, show consistent downregulation of ORs and OSN-specific genes involved in OR signaling. g, log2FC of class I and class II OR genes, reveals that class II ORs are significantly downregulated by day 2.
Figure 4
Figure 4
a, Machine-learning HMM score for a given number of compartments indicating different levels of genome compartments dissipation for control (blue) and COVID-19 patients (shades of red). For the rest of the panels, we pooled together human samples 152 and 187 (control) and 116 and 147 (SARS-CoV-2+) to increase the genomic resolution of our analysis and to identify changes occurring in the most disturbed nuclei. b, The same analysis for control (blue) and 3dpi infected hamster (2 control and 2 infected samples pooled together) (red). c-f Representative HiC maps of contacts between OR clusters in cis for human (c) and hamster (e) from pooled data. In each case control is the lower triangle below diagonal and SARS-CoV-2+ the upper triangle. Pixel intensity represents normalized number of contacts between pair of loci. Maximum intensity indicated at the top of each scale bar d,f Interchromosomal HiC contacts between OR clusters for human and hamster respectively. Genomic position of OR clusters indicated as green bars; arrows indicate the same OR compartments for both conditions. Pixel intensity represents normalized number of contacts between pair of loci. Maximum intensity indicated at the top of each scale bar. g,h Violin plot depicting the mean number of normalized trans HiC contacts between ORs from chromosome 11 to OR clusters genomewide at 50-kb resolution. Every dot indicates aggregated contacts between ORs on chromosome 11 to ORs from other chromosome, p value was computed using Wilcoxon rank test.
Figure 5
Figure 5
A model for the non-cell autonomous induction of anosmia by SARS-CoV2 infection. In control samples (left) silent ORs form a genomic compartment (blue) that promotes assembly of a multi-enhancer hub (red), which activates transcription of a single OR allele. Moreover, a second compartment consisted of numerous genes necessary for transcription, trafficking, and signaling of OR proteins is identified in control OSNs. Upon SARSCoV2 infection (right), sustentacular cells or cells from the lamina propria elicit signals that induce disruption of genomic compartments and intermingling of genes that are supposed to be spatially segregated. Alternative, this disruption may be induced by elevated systemic cytokines circulating in COVID-19 patients. In either case, disruption of genomic compartmentalization results in downregulation of ORs and of their proteins involved in trafficking and OR signaling, resulting in anosmia.

References

    1. Luers J. C. et al. Olfactory and Gustatory Dysfunction in Coronavirus Disease 19 (COVID-19). Clin Infect Dis, doi: 10.1093/cid/ciaa525 (2020). - DOI - PMC - PubMed
    1. Tong J. Y., Wong A., Zhu D., Fastenberg J. H. & Tham T. The Prevalence of Olfactory and Gustatory Dysfunction in COVID-19 Patients: A Systematic Review and Meta-analysis. Otolaryngology--head and neck surgery : official journal of American Academy of Otolaryngology-Head and Neck Surgery, 194599820926473, doi: 10.1177/0194599820926473 (2020). - DOI - PubMed
    1. Hornuss D. et al. Anosmia in COVID-19 patients. Clinical microbiology and infection : the official publication of the European Society of Clinical Microbiology and Infectious Diseases, doi: 10.1016/j.cmi.2020.05.017 (2020). - DOI - PMC - PubMed
    1. Gerkin R. C. et al. Recent smell loss is the best predictor of COVID-19: a preregistered, cross-sectional study. medRxiv, doi: 10.1101/2020.07.22.20157263 (2020). - DOI
    1. Butowt R. & von Bartheld C. S. Anosmia in COVID-19: Underlying Mechanisms and Assessment of an Olfactory Route to Brain Infection. Neuroscientist, 1073858420956905, doi: 10.1177/1073858420956905 (2020). - DOI - PMC - PubMed

Publication types

LinkOut - more resources