[Preprint]. 2021 Mar 11:2021.02.10.21251540.
doi: 10.1101/2021.02.10.21251540.

Early introductions and community transmission of SARS-CoV-2 variant B.1.1.7 in the United States

Affiliations

Early introductions and community transmission of SARS-CoV-2 variant B.1.1.7 in the United States

Tara Alpert et al. medRxiv. .

Update in

  • Early introductions and transmission of SARS-CoV-2 variant B.1.1.7 in the United States.
    Alpert T, Brito AF, Lasek-Nesselquist E, Rothman J, Valesano AL, MacKay MJ, Petrone ME, Breban MI, Watkins AE, Vogels CBF, Kalinich CC, Dellicour S, Russell A, Kelly JP, Shudt M, Plitnick J, Schneider E, Fitzsimmons WJ, Khullar G, Metti J, Dudley JT, Nash M, Beaubier N, Wang J, Liu C, Hui P, Muyombwe A, Downing R, Razeq J, Bart SM, Grills A, Morrison SM, Murphy S, Neal C, Laszlo E, Rennert H, Cushing M, Westblade L, Velu P, Craney A, Cong L, Peaper DR, Landry ML, Cook PW, Fauver JR, Mason CE, Lauring AS, St George K, MacCannell DR, Grubaugh ND. Alpert T, et al. Cell. 2021 May 13;184(10):2595-2604.e13. doi: 10.1016/j.cell.2021.03.061. Epub 2021 Apr 3. Cell. 2021. PMID: 33891875 Free PMC article.

Abstract

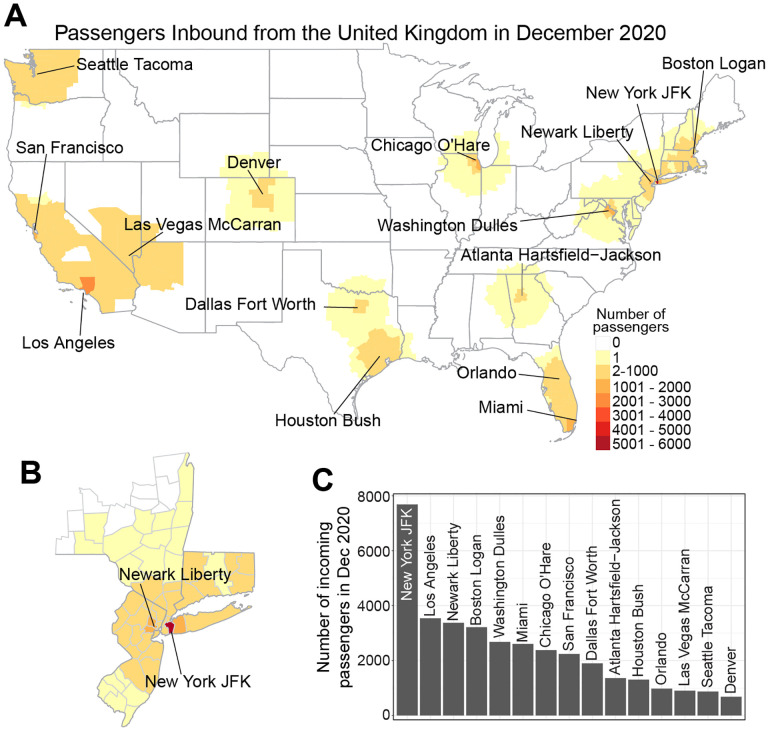
The emergence and spread of SARS-CoV-2 lineage B.1.1.7, first detected in the United Kingdom, has become a global public health concern because of its increased transmissibility. Over 2500 COVID-19 cases associated with this variant have been detected in the US since December 2020, but the extent of establishment is relatively unknown. Using travel, genomic, and diagnostic data, we highlight the primary ports of entry for B.1.1.7 in the US and locations of possible underreporting of B.1.1.7 cases. Furthermore, we found evidence for many independent B.1.1.7 establishments starting in early December 2020, followed by interstate spread by the end of the month. Finally, we project that B.1.1.7 will be the dominant lineage in many states by mid to late March. Thus, genomic surveillance for B.1.1.7 and other variants urgently needs to be enhanced to better inform the public health response.


Conflict of interest statement

Declarations of Interests M.J.M, G.K., J.M., J.T.D., M.N., N.B., and C.E.M. work for Tempus Labs. K.S.G. receives research support from Thermo Fisher for the development of assays for the detection and characterization of viruses. All other authors declare no competing interests.

Figures

Figure 1.
Figure 1.. Identification of regions in the United States at risk for importation of B.1.1.7.
A. County-level risk assessment of B.1.1.7 introductions from air passenger travelers entering US airports from the UK during December, 2020. Labeled are the top 15 airports in the US for passenger volumes from the UK (shown in C). The county-level heat map represents the probability of where passengers travel to after arriving at each airport (i.e. the airport catchment area, estimated using the Huff model multiplied by the total numbers of travelers entering each airport (see Methods). B. An expanded view of the counties in New York, New Jersey, and Connecticut to highlight the catchment of the large numbers of UK travelers entering the New York JFK and Newark Liberty airports. The same legend in A applies to B. C. The total number of passengers entering the top 15 US airports from the UK during December, 2020.
Figure 2.
Figure 2.. Identification of genomic surveillance gaps and regions that may be disproportionately underreporting B.1.1.7.
A. Bar plot represents the percentage of cases in each state from Dec 2020 to Feb 2021 (bottom x-axis; sourced from covidtracking.com/data) that have sequences uploaded to GISAID.org (accessed on Mar 4, 2021). Bars are colored according to region (legend, top right). The number of B.1.1.7 sequences for each state (top x-axis; black dots) was determined by the Pangolin lineage assignment in the GISAID.org metadata. B. Total number of passengers arriving from the UK in Dec 2020 to each state in the continental US (data from Huff model in Figure 1) is plotted against the percent of sequenced COVID-19 cases. The horizontal dashed line represents the US average (0.43%) for sequenced cases. States sequencing below the US average with more than 2,000 passengers (vertical dashed line) are at risk for underreporting B.1.1.7 (grey box). C. Number of B.1.1.7 SARS-CoV-2 sequences available on GISAID.org for each state. Points are colored according to region (legend from panel A). The data used to create this figure are listed in Data S1.
Figure 3.
Figure 3.. Multiple introductions, domestic spread, and community transmission of B.1.1.7 SARS-CoV-2 in the United States.
A. Maximum likelihood phylogeny of B.1.1.7, including 1,908 representative genomes from the US, Europe, other global locations. Tree topology and bootstrap values obtained using IQ-Tree 1.6.12, with time scale inferred by TreeTime 0.8.0, discrete state reconstruction inferred using BEAST v1.10, and data integration, and visualization using baltic 0.1.5. The tree was rooted using a P.1 genome (Brazil/AM-20842882CA/2020) as an outgroup (not shown in this plot). B. Exploded tree layout, highlighting clades with 3 or more taxa, UFBoot > 70 (small circles), and US ancestral state probability at MRCA > 0.7 (values at the root), representing independent international introductions of B.1.1.7 into distinct regions of the US, based on the same phylogenetic tree shown in (A). A list of international transitions to the US can be found in Data S1. C-H. Time-informed maximum likelihood phylogeny of distinct B.1.1.7 clades showing instances of intra-region (C, D, E, G) and inter-region (D, H) domestic spread. The list of SARS-CoV-2 sequences used in this study and author acknowledgements can be found in Data S2. Supporting phylogenetic analysis can be found in Figures S2–5. For comparison, an interactive phylogenetic tree, inferred using IQ-Tree and TreeTime only, can be accessed from our custom Nextstrain build: nextstrain.org/community/grubaughlab/CT-SARS-CoV-2/paper5.
Figure 4.
Figure 4.. Increasing frequency of weekly spike gene target failure (SGTF) results across four US states.
A. The weekly positivity rate of SARS-CoV-2 testing for four states (legend, panel B) since the first week of December, 2020, calculated as the number of positive tests (including SGTF) divided by total tests. B. The percentage of weekly positive tests which have SGTF are shown for the same time-period and states from A (legend, top left). C. The weekly percent SGTF data from panel B fit to a logistic regression model (see Methods) to project the week in which we estimate SGTF results, and by proxy B.1.1.7, will cross the 50% and 75% thresholds for each state population. The color schemes shown in panels A-C match the color schemes used in Figures 2–3. The data used to create this figure are listed in Data S1.

References

    1. Becker R.A., Wilks A.R., Brownrigg R., Minka T.P., and Deckmyn A. (2018). maps: Draw Geographical Maps. R package version 3.3. 0.
    1. Borges V., Sousa C., Menezes L., A M.G., Picão M., Almeida J.P., Vieita M., Santos R., Silva A.R., Costa M., et al. (2021). Tracking SARS-CoV-2 VOC 202012/01 (lineage B.1.1.7) dissemination in Portugal: insights from nationwide RT-PCR Spike gene drop out data. - PMC - PubMed
    1. CDC (2021a). US COVID-19 Cases Caused by Variants.
    1. CDC (2021b). Genomic Surveillance for SARS-CoV-2.
    1. Davies N.G., Abbott S., Barnard R.C., Jarvis C.I., Kucharski A.J., Munday J.D., Pearson C.A.B., Russell T.W., Tully D.C., Washburne A.D., et al. (2021). Estimated transmissibility and impact of SARS-CoV-2 lineage B.1.1.7 in England. Science. - PMC - PubMed

Publication types

LinkOut - more resources