

Decoding Neural Representations of Affective Scenes in Retinotopic Visual Cortex
- PMID: 33594428
- PMCID: PMC8107797
- DOI: 10.1093/cercor/bhaa411
Decoding Neural Representations of Affective Scenes in Retinotopic Visual Cortex
Abstract
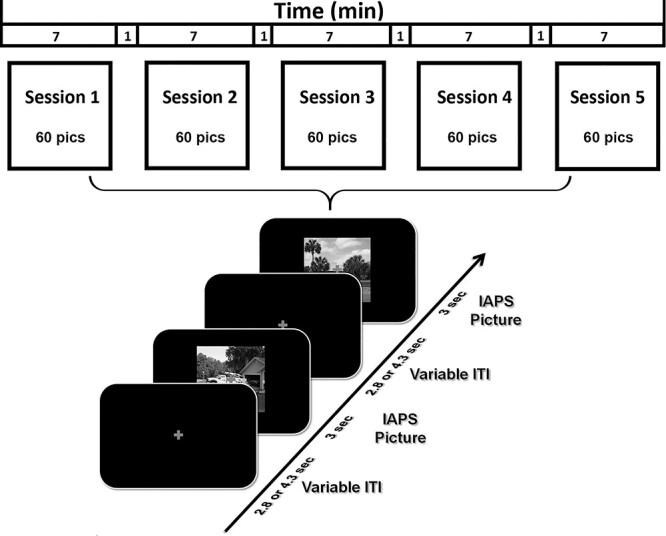
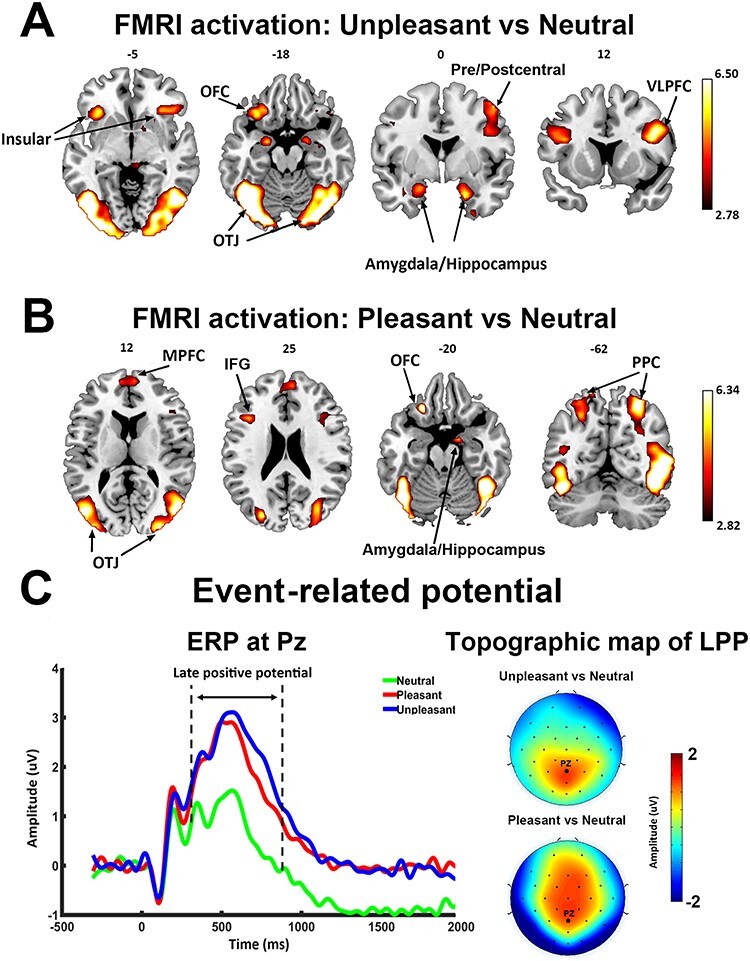
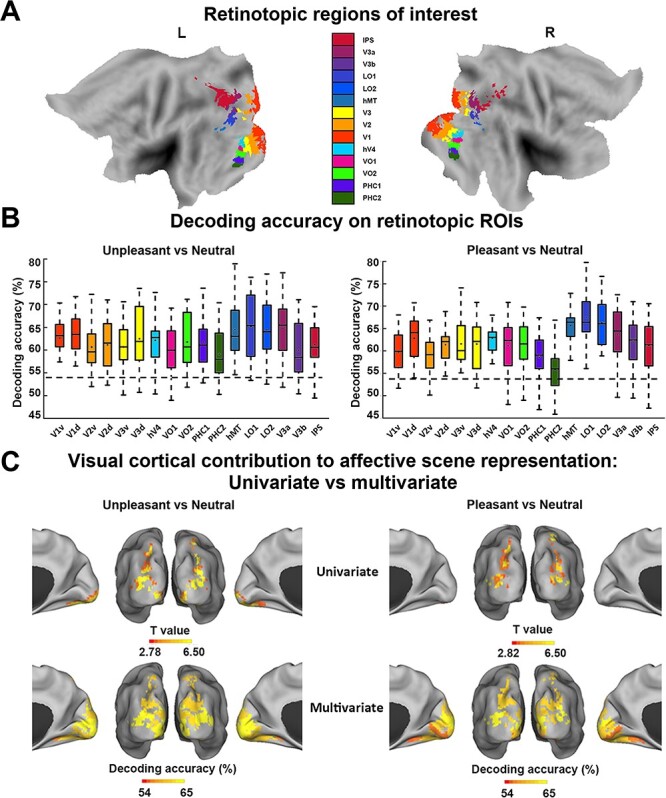
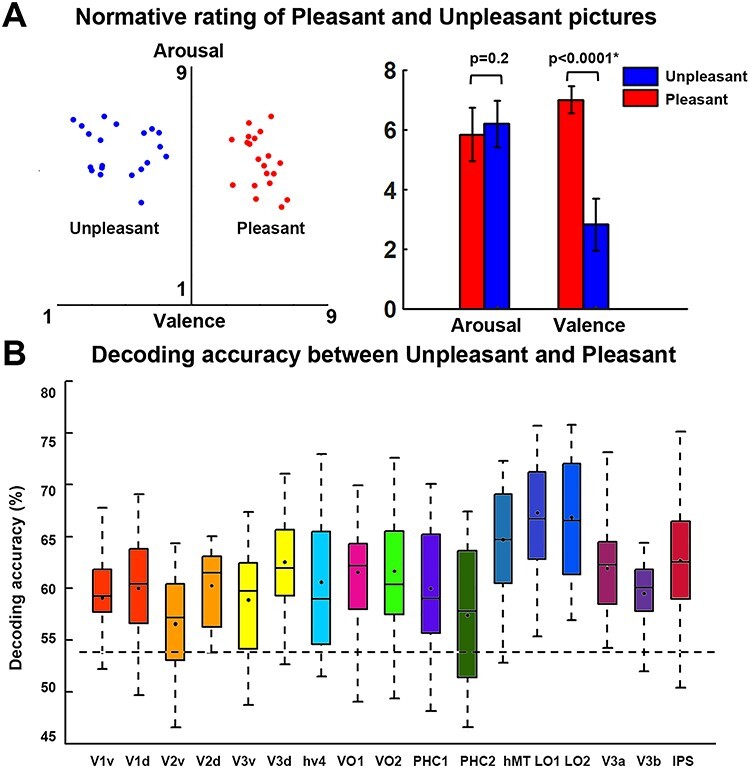
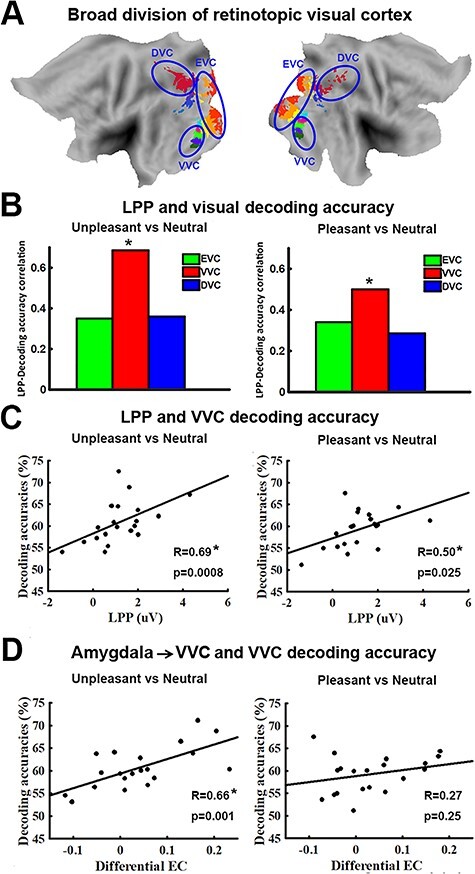
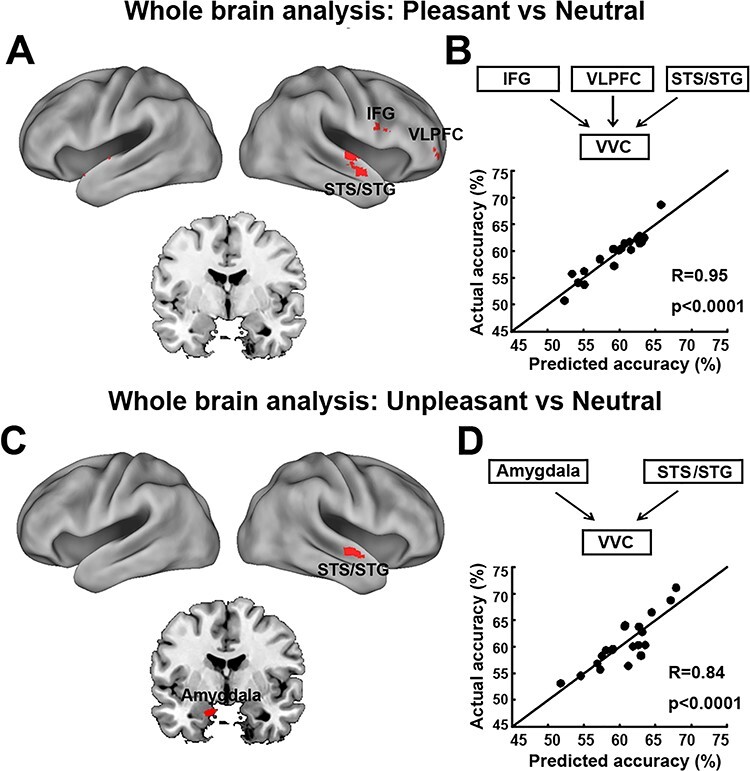
The perception of opportunities and threats in complex visual scenes represents one of the main functions of the human visual system. The underlying neurophysiology is often studied by having observers view pictures varying in affective content. It has been shown that viewing emotionally engaging, compared with neutral, pictures (1) heightens blood flow in limbic, frontoparietal, and anterior visual structures and (2) enhances the late positive event-related potential (LPP). The role of retinotopic visual cortex in this process has, however, been contentious, with competing theories predicting the presence versus absence of emotion-specific signals in retinotopic visual areas. Recording simultaneous electroencephalography-functional magnetic resonance imaging while observers viewed pleasant, unpleasant, and neutral affective pictures, and applying multivariate pattern analysis, we found that (1) unpleasant versus neutral and pleasant versus neutral decoding accuracy were well above chance level in retinotopic visual areas, (2) decoding accuracy in ventral visual cortex (VVC), but not in early or dorsal visual cortex, was correlated with LPP, and (3) effective connectivity from amygdala to VVC predicted unpleasant versus neutral decoding accuracy, whereas effective connectivity from ventral frontal cortex to VVC predicted pleasant versus neutral decoding accuracy. These results suggest that affective scenes evoke valence-specific neural representations in retinotopic visual cortex and that these representations are influenced by reentry signals from anterior brain regions.
Keywords: affective scenes; amygdala; late positive potential; multivariate pattern analysis; visual cortex.
© The Author(s) 2021. Published by Oxford University Press. All rights reserved. For permissions, please e-mail: journals.permissions@oup.com.
Figures
Similar articles
-
Decoding the temporal dynamics of affective scene processing.Neuroimage. 2022 Nov 1;261:119532. doi: 10.1016/j.neuroimage.2022.119532. Epub 2022 Aug 2. Neuroimage. 2022. PMID: 35931307 Free PMC article.
-
Neural substrate of the late positive potential in emotional processing.J Neurosci. 2012 Oct 17;32(42):14563-72. doi: 10.1523/JNEUROSCI.3109-12.2012. J Neurosci. 2012. PMID: 23077042 Free PMC article. Clinical Trial.
-
Tagging cortical networks in emotion: a topographical analysis.Hum Brain Mapp. 2012 Dec;33(12):2920-31. doi: 10.1002/hbm.21413. Epub 2011 Sep 23. Hum Brain Mapp. 2012. PMID: 21954087 Free PMC article.
-
Steady-state visual evoked potentials as a research tool in social affective neuroscience.Psychophysiology. 2016 Dec;53(12):1763-1775. doi: 10.1111/psyp.12768. Epub 2016 Oct 4. Psychophysiology. 2016. PMID: 27699794 Free PMC article. Review.
-
Contextual signals in visual cortex.Curr Opin Neurobiol. 2018 Oct;52:131-138. doi: 10.1016/j.conb.2018.05.003. Epub 2018 Jun 5. Curr Opin Neurobiol. 2018. PMID: 29883940 Review.
Cited by
-
A systems identification approach using Bayes factors to deconstruct the brain bases of emotion regulation.Nat Neurosci. 2024 May;27(5):975-987. doi: 10.1038/s41593-024-01605-7. Epub 2024 Mar 22. Nat Neurosci. 2024. PMID: 38519748
-
Decoding Visual Spatial Attention Control.eNeuro. 2025 Mar 3;12(3):ENEURO.0512-24.2025. doi: 10.1523/ENEURO.0512-24.2025. Print 2025 Mar. eNeuro. 2025. PMID: 39947905 Free PMC article.
-
Commonalities and variations in emotion representation across modalities and brain regions.Sci Rep. 2024 Sep 9;14(1):20992. doi: 10.1038/s41598-024-71690-y. Sci Rep. 2024. PMID: 39251743 Free PMC article.
-
Self-compassion, self-referential caudate circuitry, and adolescent suicide ideation.Transl Psychiatry. 2024 Aug 20;14(1):334. doi: 10.1038/s41398-024-03037-0. Transl Psychiatry. 2024. PMID: 39164232 Free PMC article.
-
Neural correlates of negative aesthetic evaluations in visual art: a neuroimaging meta-analysis.Cereb Cortex. 2025 Jul 1;35(7):bhaf156. doi: 10.1093/cercor/bhaf156. Cereb Cortex. 2025. PMID: 40624896 Free PMC article.
References
-
- Allen PJ, Josephs O, Turner R. 2000. A method for removing imaging artifact from continuous EEG recorded during functional MRI. Neuroimage. 12(2):230–239. - PubMed
-
- Allen PJ, Polizzi G, Krakow K, Fish DR, Lemieux L. 1998. Identification of EEG events in the MR scanner: the problem of pulse artifact and a method for its subtraction. Neuroimage. 8(3):229–239. - PubMed
-
- Allison T, Puce A, McCarthy G. 2000. Social perception from visual cues: role of the STS region. Trends Cogn Sci. 4(7):267–278. - PubMed
-
- Amaral DG, Behniea H, Kelly JL. 2003. Topographic organization of projections from the amygdala to the visual cortex in the macaque monkey. Neuroscience. 118(4):1099–1120. - PubMed
Publication types
MeSH terms
Grants and funding
LinkOut - more resources
Full Text Sources
Other Literature Sources
