Review
. 2021 Dec;48(13):4152-4170.
doi: 10.1007/s00259-021-05207-4. Epub 2021 Feb 16.

Multi-scale optoacoustic molecular imaging of brain diseases

Affiliations
Review

Multi-scale optoacoustic molecular imaging of brain diseases

Daniel Razansky et al. Eur J Nucl Med Mol Imaging. 2021 Dec.

Abstract

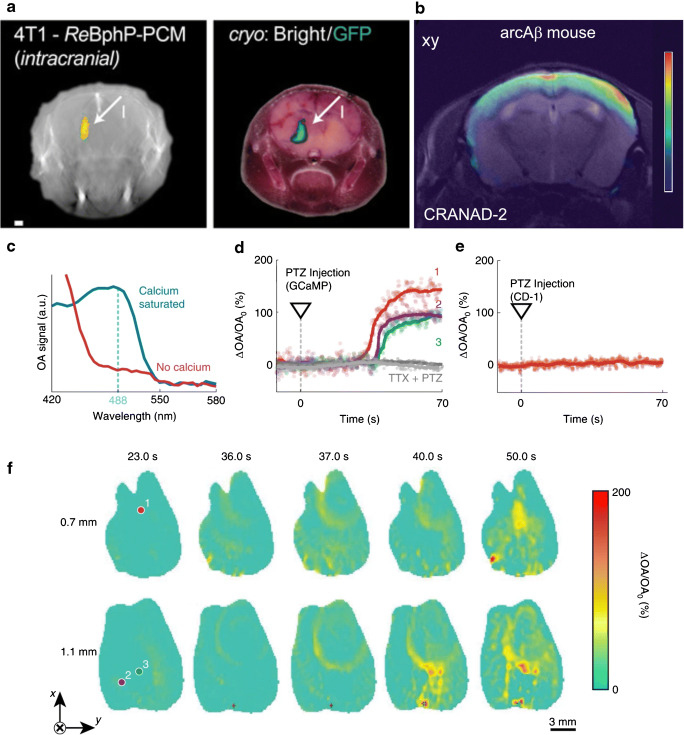
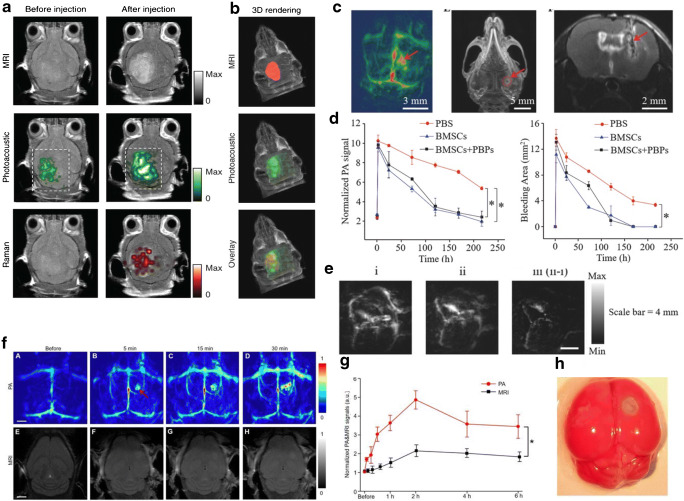
The ability to non-invasively visualize endogenous chromophores and exogenous probes and sensors across the entire rodent brain with the high spatial and temporal resolution has empowered optoacoustic imaging modalities with unprecedented capacities for interrogating the brain under physiological and diseased conditions. This has rapidly transformed optoacoustic microscopy (OAM) and multi-spectral optoacoustic tomography (MSOT) into emerging research tools to study animal models of brain diseases. In this review, we describe the principles of optoacoustic imaging and showcase recent technical advances that enable high-resolution real-time brain observations in preclinical models. In addition, advanced molecular probe designs allow for efficient visualization of pathophysiological processes playing a central role in a variety of neurodegenerative diseases, brain tumors, and stroke. We describe outstanding challenges in optoacoustic imaging methodologies and propose a future outlook.

Keywords: Brain; Multi-spectral optoacoustic tomography (MSOT); Neuroimaging; Optical imaging; Photoacoustics.


Conflict of interest statement

The authors declare no competing interests.

Figures

Fig. 1
Fig. 1
Resolution and field-of-view of different imaging modalities. 2P, two-photon; OAM, optoacoustic microscopy; MSOT, multispectral optoacoustic tomography; RSOM, raster-scan optoacoustic mesoscopy; NIR, near-infrared fluorescence imaging; PET, positron emission tomography; MRI, magnetic resonance imaging
Fig. 2
Fig. 2
Examples of optoacoustic imaging setups used for molecular interrogation of brain diseases. a Optoacoustic microscopy OR-PAM. Adapted with permission from [25]; b Cross-sectional multi-spectral optoacoustic tomography (MSOT) imaging setup. Adapted with permission from [207]; c Volumetric MSOT. Adapted with permission from [29]
Fig. 3
Fig. 3
OA imaging of structural and anatomical information in small animal brain. a In vivo super-resolution localization optoacoustic microscopy (OAM) of a mouse brain using intrinsic contrast of red blood cells—depth and amplitude are color-encoded. Adapted with permission from [37]. Superior sagittal sinus (SSS) and transverse sinus are labeled with white arrows; b 300-μm-thick slices of the mouse brain cerebrum myelin imaged using mid-infrared (MIR)-OAM [39]. An ultraviolet-localized image is shown at the bottom right, exhibiting higher spatial resolution; c Raster-scan optoacoustic mesoscopy (RSOM) images of the mouse brain (dorsal and lateral views are shown with skin or skullcap removed). Scale bars, 1 mm. Adapted with permission from [36]; d Single-impulse panoramic photoacoustic–computed tomography (SIP-PACT) of vasculature in the mouse brain cortex. Adapted with permission from [37]; e In vivo MSOT imaging of the mouse brain showing single wavelength (800 nm) anatomical image, along with spectrally unmixed distribution of deoxy- and oxyhemoglobin; f Dynamics of cerebral blood oxygenation following carbon dioxide challenge imaged with MSOT (white, normal air; dark gray, 10% carbon dioxide; intermediate gray, 100% oxygen; and light gray, 100% carbon dioxide). Adapted with permission from [43]
Fig. 4
Fig. 4
Functional imaging based on endogenous absorption contrast. a-c Optoacoustic microscopy of brain responses to electrical stimulations of the hindlimbs of mice. Adapted with permission from [25]; d-g Imaging of rat whole-brain functions using Single-impulse panoramic photoacoustic–computed tomography; d Whole-brain vasculature; e segmentations of different functional regions of the brain; f Seed-based functional connectivity analyses on both sides of the brain; g Correlation matrix of the 16 functional regions in f. Adapted with permission from [37]; h–k Single-impulse panoramic photoacoustic–computed tomography of the mouse cortex after injection of melanoma cancer cells, color represent the flow direction of circulating tumor cells (CTCs). Adapted with permission from [37]
Fig. 5
Fig. 5
Molecular (contrast-enhanced) MSOT imaging at the whole-brain level. a 4T1 cells (0.7 × 10⁶ injected intracranially) stably expressing ReBphP-PCM imaged using MSOT at a depth of 3.6 mm in the brain (arrow I) immediately after injection. Adapted with permission from [71]; b volumetric MSOT imaging of amyloid-beta plaque in Alzheimer arcAβ mouse brain using amyloid binding probe CRANAD-2, showing higher signal retention in the cortical areas compared to age-matched wild-type mice. Adapted with permission from [120]; c-f whole-brain functional optoacoustic neuro-tomography (FONT) volumetric imaging of calcium waves induced by pentylenetetrazole (PTZ) injection into an isolated mouse brain model. Adapted with permission from [31]; c absorption spectrum of purified calcium-saturated (blue) and calcium-free (red) GCaMP6f proteins. d Time traces of the normalized FONT data. Gray traces represent tetrodotoxin (TTX) injected 180 s before PTZ (t = 0 s), abolishing the activation; e no signal change due to PTZ injection are detected in a control isolated CD-1 mouse brain not expressing GCaMP6f proteins; f temporal evolution of the relative signal changes (∆OA/OA0) in slices at depths of 0.7 mm and 1.1 mm in a GCaMP6f-expressing brain
Fig. 6
Fig. 6
Multi-modality imaging studies. a–b Optoacoustic (OA), Raman, and MR images of the brain of orthotopic inoculation tumor-bearing mice before and after i.v. injection with multimodal probe. The post-injection images of all three modalities demonstrated clear tumor visualization. The OA and Raman images were co-registered with the MR image, demonstrating good co-localization between the three modalities. Adapted with permission from [84]; c–e stem cell imaging in brain injury model; c volumetric OA, CT, and MRI images of the mouse brain after cerebral injury. The wound hole marked by the red dotted line circle was induced by the steel needle; d normalized OA signal intensities of the damaged location at the predetermined time points. *P < 0.05; e OA images of the mouse brain (i) before and (ii) after a single injection of bone mesenchymal stem cells (BMSC) labeled with Prussian blue particles (PBPs). The image (iii) represents the delta image. Adapted with permission from [64]; f–h OA tomography (at 680 nm) and MRI of mouse brain in a photothrombosis stroke model at an early stage in vivo by Evan blue dye injection at varied time points upon injection; g normalized OA and MRI signals of mice brains in infarcted areas at varied time points upon Evan blue dye injection. *P < 0.05. h Triphenyl tetrazolium chloride staining in the brain of model mice. Adapted with permission from [144]

Similar articles

Cited by

References

    1. Belliveau JW, Kennedy DN, Jr, McKinstry RC, Buchbinder BR, Weisskoff RM, Cohen MS, et al. Functional mapping of the human visual cortex by magnetic resonance imaging. Science. 1991;254:716–719. doi: 10.1126/science.1948051. - DOI - PubMed
    1. Lerch JP, van der Kouwe AJW, Raznahan A, Paus T, Johansen-Berg H, Miller KL, et al. Studying neuroanatomy using MRI. Nat Neurosci. 2017;20:314–326. doi: 10.1038/nn.4501. - DOI - PubMed
    1. Nordberg A, Rinne JO, Kadir A, Långström B. The use of PET in Alzheimer disease. Nat Rev Neurol. 2010;6:78–87. doi: 10.1038/nrneurol.2009.217. - DOI - PubMed
    1. Langen K-J, Galldiks N, Hattingen E, Shah NJ. Advances in neuro-oncology imaging. Nat Rev Neurol. 2017;13:279–289. doi: 10.1038/nrneurol.2017.44. - DOI - PubMed
    1. Macé E, Montaldo G, Cohen I, Baulac M, Fink M, Tanter M. Functional ultrasound imaging of the brain. Nat Methods. 2011;8:662–664. doi: 10.1038/nmeth.1641. - DOI - PubMed

LinkOut - more resources