. 2021 Feb 17;83(4):29.
doi: 10.1007/s11538-021-00860-0.

The Role of Cytoplasmic MEX-5/6 Polarity in Asymmetric Cell Division

Affiliations

The Role of Cytoplasmic MEX-5/6 Polarity in Asymmetric Cell Division

Sungrim Seirin-Lee. Bull Math Biol. .

Abstract

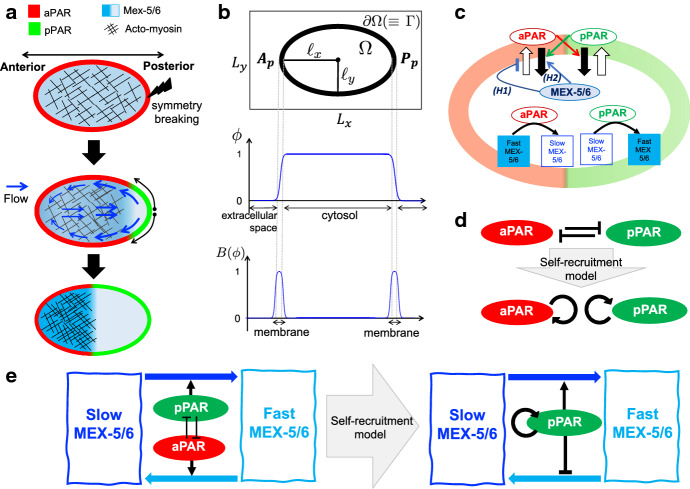
In the process of asymmetric cell division, the mother cell induces polarity in both the membrane and the cytosol by distributing substrates and components asymmetrically. Such polarity formation results from the harmonization of the upstream and downstream polarities between the cell membrane and the cytosol. MEX-5/6 is a well-investigated downstream cytoplasmic protein, which is deeply involved in the membrane polarity of the upstream transmembrane protein PAR in the Caenorhabditis elegans embryo. In contrast to the extensive exploration of membrane PAR polarity, cytoplasmic polarity is poorly understood, and the precise contribution of cytoplasmic polarity to the membrane PAR polarity remains largely unknown. In this study, we explored the interplay between the cytoplasmic MEX-5/6 polarity and the membrane PAR polarity by developing a mathematical model that integrates the dynamics of PAR and MEX-5/6 and reflects the cell geometry. Our investigations show that the downstream cytoplasmic protein MEX-5/6 plays an indispensable role in causing a robust upstream PAR polarity, and the integrated understanding of their interplay, including the effect of the cell geometry, is essential for the study of polarity formation in asymmetric cell division.

Keywords: Cell polarity; Pattern formation.


Figures

Fig. 1
Fig. 1
Schematic diagrams for polarity formation in the C. elegans embryo and mathematical model. a Dynamics of polarity formation in the C. elegans embryo. b The description of a cell using the phase-field function (ϕ). ΩΩ is a cell region, Lx×Ly is the simulation domain, and x and y are radii of the long axis and short axis of the cell, respectively. Ap and Pp are polar points at the anterior and posterior sides, respectively. c Diagram of the dynamics of aPAR, pPAR, and MEX-5/6. The black arrows indicate transportation and conversion, while the colored arrows and the inhibition symbol indicate interactions between the proteins. (H1) and (H2) indicate each assumption for how MEX-5/6 regulates aPAR. d, e Diagram of the reduction to the self-recruitment model. The black arrows and inhibition symbol indicate interaction between the proteins. The colored arrows indicate conversion of the slow and fast diffusion types of MEX-5/6
Fig. 2
Fig. 2
Flow velocity function. a Experimental data of flow velocity (adapted from Niwayama et al. (2011)). Right panel shows the velocity distribution of cytoplasmic streaming. Lines in the left panel show the velocity distribution along the AP axis in vivo reconstructed with the moving particle simulation. Boxes in the left panel show the experimental data (gray: cortical flow, white: cytoplasmic flow). b, c Representative example of the flow velocity function v(x,t)=(vx,vy) given by (12). The vectors indicate the direction, and the color map shows the speed of flow velocities. The one-dimensional velocity data (|v|) in the membrane have been plotted on the cell circumference, the data in the cytosol have been plotted on (x,y)=(x,Ly/2). d A representative simulation of incompressibility at maximal flow velocity. The numerical simulations show that ·vO(2×10⁻²) during the flow
Fig. 3
Fig. 3
Dynamics of PARs and MEX-5/6 polarity formation. a Representative simulation results of the MEX-5/6-combined-PAR model (1)–(3) without flow. Left panels show the polarities of aPAR, pPAR, and MEX-5/6. The concentrations in the cell circumference are plotted in the middle panel and the concentrations in the cytosol are plotted in the right panel. b, c Representative simulation results of the MEX-5/6-combined-self-recruitment pPAR model (10)–(11) without flow. The gray dotted line indicates the boundary location of the polarity domains. The detailed parameter values are given in “Appendix B”
Fig. 4
Fig. 4
Role of MEX-5/6 polarity on PAR polarity formation. a The effect of MEX-5/6 on the symmetry breaking phase. b The effect of MEX-5/6 on the establishment phase. The left panel shows the change in length of the pPAR domain and the right panel shows the effect of MEX-5/6 on the emerging speed of the pPAR polarity domain. The data were measured using the average speed over the interval [0.5 min, 1 min] for each simulation. c The effect of MEX-5/6 on the maintenance phase. The effect of MEX-5/6 on the length of the pPAR polarity domain is shown. d The effect of MEX-5/6 polarity on pPAR polarity. The upper panels show how the polarity of MEX-5/6 was numerically controlled and the lower panels show the resultant pPAR polarity for each case. The detailed parameter values are given in “Appendix B”
Fig. 5
Fig. 5
Interplay with the flows and cell geometry. a The effect of flow on the emerging speed. b The effect of flow direction on polarity patterning. The reverse flows are given by replacing c3 and c8 by -c3 and -c8, respectively, in the flow functions (12). c The effect of a different location of the symmetry breaking point without flow effects on pPAR dynamics. d The effect of a different location of the symmetry breaking point when wild-type flows are included. e pPAR polarity dynamics with a different location of symmetry breaking point when MEX-5/6 does not affect pPAR (μ0=0 in the model (10)–(11)) and flows are absent. f Comparison of polarity dynamics with different symmetry breaking points without flow effects. The figures surrounded by a bold square are the steady-state patterns. The gray dotted line indicates the boundary location of polarity domains. The detailed parameter values are given in “Appendix B”

Similar articles

Cited by

References

    1. Campanale JP, Sun TY, Montell DJ. Development and dynamics of cell polarity at a glance. J Cell Sci. 2017;130:1201–1207. doi: 10.1242/jcs.188599. - DOI - PMC - PubMed
    1. Cortes DB, Dawes A, Liu J, Nickaeen M, Strychalski W, Maddox AS. Unite to divide-how models and biological experimentation have come together to reveal mechanisms of cytokinesis. J Cell Sci. 2018;131:1–10. doi: 10.1242/jcs.203570. - DOI - PMC - PubMed
    1. Cowan CR, Hyman AA. Asymmetric cell division in C. elegans: cortical polarity and spindle positioning. Annu Rev Cell Dev Biol. 2004;20:427–453. doi: 10.1146/annurev.cellbio.19.111301.113823. - DOI - PubMed
    1. Crampin EJ, Gaffney EA, Maini PK. Reaction and diffusion on growing domains: scenarios for robust pattern formation. Bull Math Biol. 1999;61:1093–1120. doi: 10.1006/bulm.1999.0131. - DOI - PubMed
    1. Cuenca AA, Schetter A, Aceto D, Kemphues K, Seydoux G. Polarization of the C. elegans zygote proceeds via distinct establishment and maintenance phases. Development. 2002;130:1255–1265. doi: 10.1242/dev.00284. - DOI - PMC - PubMed

Publication types

MeSH terms

Substances

LinkOut - more resources