Review
. 2021 Feb 17;83(4):31.
doi: 10.1007/s11538-020-00841-9.

Calcium Dynamics and Water Transport in Salivary Acinar Cells

Affiliations
Review

Calcium Dynamics and Water Transport in Salivary Acinar Cells

James Sneyd et al. Bull Math Biol. .

Abstract

Saliva is secreted from the acinar cells of the salivary glands, using mechanisms that are similar to other types of water-transporting epithelial cells. Using a combination of theoretical and experimental techniques, over the past 20 years we have continually developed and modified a quantitative model of saliva secretion, and how it is controlled by the dynamics of intracellular calcium. However, over approximately the past 5 years there have been significant developments both in our understanding of the underlying mechanisms and in the way these mechanisms should best be modelled. Here, we review the traditional understanding of how saliva is secreted, and describe how our work has suggested important modifications to this traditional view. We end with a brief description of the most recent data from living animals and discuss how this is now contributing to yet another iteration of model construction and experimental investigation.

Keywords: Calcium oscillations; Mathematical modelling; Saliva secretion; Three-dimensional finite element computations; Water transport.


Conflict of interest statement

Conflict of interest

The authors declare that they have no conflict of interest.

Figures

Fig. 1
Fig. 1
The traditional view of saliva production (Melvin et al, 2005; Lee et al, 2012). At rest, uptake of Cl by a NKCC1 cotransporter maintains a high intracellular [Cl]. Agonist stimulation results in the release of Ca2+ from the endoplasmic reticulum (ER) through inositol trisphosphate receptors (IP3R) and (possibly) ryanodine receptors (RyR). Calcium is resequestered into the ER by ATPase Ca2+ pumps (SERCA). Ca2+ activates Cl channels on the apical membrane and K+ channels on the basal membrane (with possibly some on the apical membrane also). This results in the flow of Cl into the lumen, whereupon water follows by osmosis. Hence, in summary, Cl transport across the cell provides an osmotic gradient down which water flows, from the interstitium, through the cell, into the lumen. Charge balance is maintained by a paracellular Na+ current.
Fig. 2
Fig. 2
Time series of the mean fluorescence of the Ca2+ indicator Fluo-4, averaged over a whole acinar cell in an intact mouse parotid gland (Pages et al, 2019). These oscillations were stimulated by the agonist carbachol, which binds to acetylcholine receptors. The fluorescence is closely related to [Ca2+], although the relationship is not linear. It is a good working assumption that the fluorescence is an analogue of [Ca2+], with oscillations with the same qualitative properties.
Fig. 3
Fig. 3
Upper left panel: maximum projection of a confocal z stack (vertical resolution of 7 μm) showing ClCa channels (TMEM16a) and type 3 IPR. The entire section was 80 μm thick. Lower left panel: maximum projection of a stimulated emission depletion (STED) image. The STED image clearly shows that the proteins have distinct localisation. Right panel: Huygens deconvolution of the boxed region of the STED merged image. Scale bars = 5 μm.
Fig. 4
Fig. 4
The new model of saliva secretion is similar in most respects to the traditional view discussed above, but with some important differences. Ca2+ is accumulated by the NKCC1 cotransporter and the AE4 anion exchanger, both of which are in the basal membrane. Upon agonist stimulation, IP3 diffuses through the cell to the apical membrane where it binds to IPR located within 50 nm of the apical membrane. The apical region acts as a pacemaker, generating Ca2+ oscillations locally via Ca2+ modulations of the IPR open probability, and these oscillations are propagated across the cell by a secondary active mechanism, which could be either RyR or a different type of IPR. K+ channels in the apical and basal regions maintain membrane depolarisation as Ca2+ flows into the lumen, and lumenal [K+] is kept low by apical NaK ATPases.
Fig. 5
Fig. 5
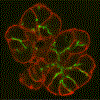
A typical frame from a z stack of confocal slices. The NaK ATPases are shown in red (giving the position of the basal membrane), while the apical ClCa channels are shown in green (giving the position of the apical membranes). By stacking multiple such frames a three-dimensional picture of the group of cells, together with a branched lumen, can be reconstructed.
Fig. 6
Fig. 6
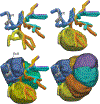
Three-dimensional grid of seven acinar cells, together with an idealised reconstruction of the lumenal structure. The lumen is colour-coded according to the colours of the cells that border each lumenal segment. It is important to keep in mind that the lumen is not a stand-alone structure, it is simply the gaps between cells. The top left panel shows the isolated lumen; the top right panel shows how a single cell fits between the branches of the lumen; the bottom left panel show how three cells fits in the lumenal branches; the bottom right panel shows a view of all seven cells, with the lumen now almost entirely obscured.
Fig. 7
Fig. 7
Typical model results from cell 6 (Vera-Sigüenza et al, 2020). Results from the other cells are qualitatively similar. Left panel: time series of [Ca2+], spatially averaged over the apical and basal regions. At this resolution is it difficult to tell the difference between the apical and basal responses, but they are not identical. Right panel: the resting and stimulated rates of saliva secretion. Full details of the model output, including the apical and basal membrane potentials, and the cytoplasmic and lumenal concentration of Na+, K+ and Cl, can be found in Vera-Sigüenza et al (2020).
Fig. 8
Fig. 8
Model oscillations from a single independent cell (Pages et al, 2019), showing the effect of incorporating changes in cell volume. If the volume of the cell is artificially held constant, the model oscillation is slower and not superimposed on a raised plateau. The concentrations are averaged over the apical and basal regions.
Fig. 9
Fig. 9
Schematic diagrams of two different kinds of duct cells (Fong et al, 2017). The upper panel describes a duct cell that allows for transcellular and paracellular water transport, while the lower panel describes a duct cell that allows no water transport. ENaC is the epithelial Na+ channel; CFTR is the cystic fibrosis transmembrane regulator anion channel that allows both Cl and HCO3 current; BK is the usual K+ channel (i.e., not the Ca2+-dependent version seen in acinar cells); NHE1 and NHE3 are Na+/H+ exchangers; NBC is a Na+/HCO3 cotransporter; K channel is a generic unspecified K+ channel.
Fig. 10
Fig. 10
Preliminary data from intravital measurements of Ca2+ oscillations in acinar cells from the submandibular gland acinar cell of a living mouse. (These data are a low-resolution version of more extensive high-resolution data that are submitted for publication.) The oscillations were initiated by neuronal stimulation, which results in the release of acetylcholine. Neuronal stimulation was 5 mA at 5 Hz, for 12 s, and responses were measured at 2 fps. The 6 cells are all from different acini. These intravital oscillations were stimulated by activation of the same receptor as those from an intact gland, as seen in Fig. 2, but their frequency is significantly higher.
Fig. 11
Fig. 11
A still image from a video of intravital Ca2+ oscillations in acinar cells from the submandibular gland of a living mouse, in response to neuronal stimulation. (These data are a low-resolution version of more extensive high-resolution data that are submitted for publication.) The majority of the cells demonstrate Ca2+ oscillations only in their apical regions.
Fig. 12
Fig. 12
A proposed new hypothesis for saliva secretion in salivary acinar cells. The only difference from the model shown in Fig. 4 is that there is now no Ca2+ wave propagated across the cell, from apical to basal, and thus all the necessary Ca2+-modulated ion channels now reside in the apical region. They can also exist in the basal membrane but do not need to be activated to a significant extent. No quantitative description of this proposed model yet exists.

References

    1. Almássy J, Won JH, Begenisich TB, Yule DI (2012) Apical Ca2+-activated potassium channels in mouse parotid acinar cells. J Gen Physiol 139(2):121–33 - PMC - PubMed
    1. Almássy J, Siguenza E, Skaliczki M, Matesz K, Sneyd J, Yule DI, Nánási PP (2018) New saliva secretion model based on the expression of Na+-K+ pump and K+ channels in the apical membrane of parotid acinar cells. Pflugers Arch 470(4):613–621, DOI 10.1007/s00424-018-2109-0 - DOI - PubMed
    1. Ambudkar IS (2012) Polarization of calcium signaling and fluid secretion in salivary gland cells. Curr Med Chem 19(34):5774–81 - PMC - PubMed
    1. Ambudkar IS (2014) Ca2+ signaling and regulation of fluid secretion in salivary gland acinar cells. Cell Calcium 55(6):297–305, DOI 10.1016/j.ceca.2014.02.009 - DOI - PMC - PubMed
    1. Baum BJ, Zheng C, Cotrim AP, Goldsmith CM, Atkinson JC, Brahim JS, Chiorini JA, Voutetakis A, Leakan RA, Van Waes C, Mitchell JB, Delporte C, Wang S, Kaminsky SM, Illei GG (2006) Transfer of the AQP1 cDNA for the correction of radiation-induced salivary hypofunction. Biochim Biophys Acta 1758(8):1071–7, DOI 10.1016/j.bbamem.2005.11.006 - DOI - PubMed

Publication types

LinkOut - more resources