Review
. 2021 Apr 7;50(7):4432-4483.
doi: 10.1039/d0cs00908c. Epub 2021 Feb 17.

Phenolic-enabled nanotechnology: versatile particle engineering for biomedicine

Affiliations
Review

Phenolic-enabled nanotechnology: versatile particle engineering for biomedicine

Di Wu et al. Chem Soc Rev. .

Abstract

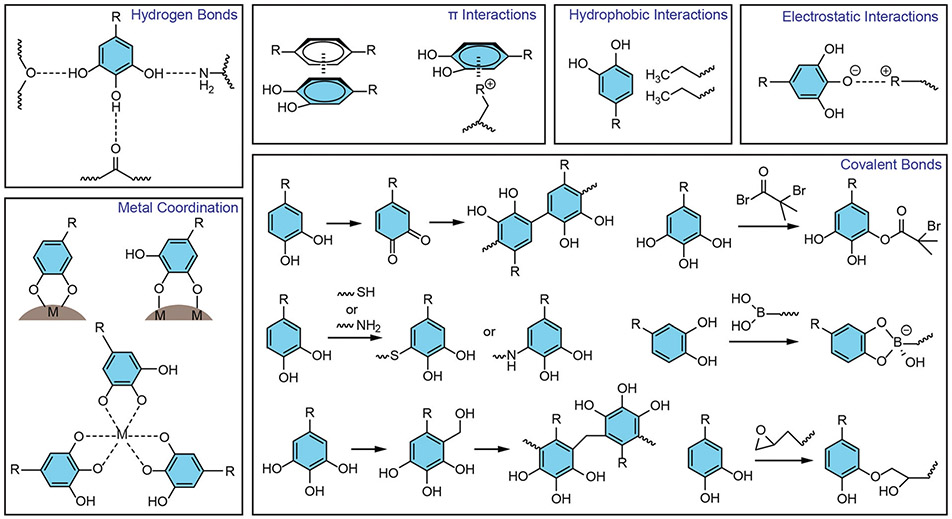
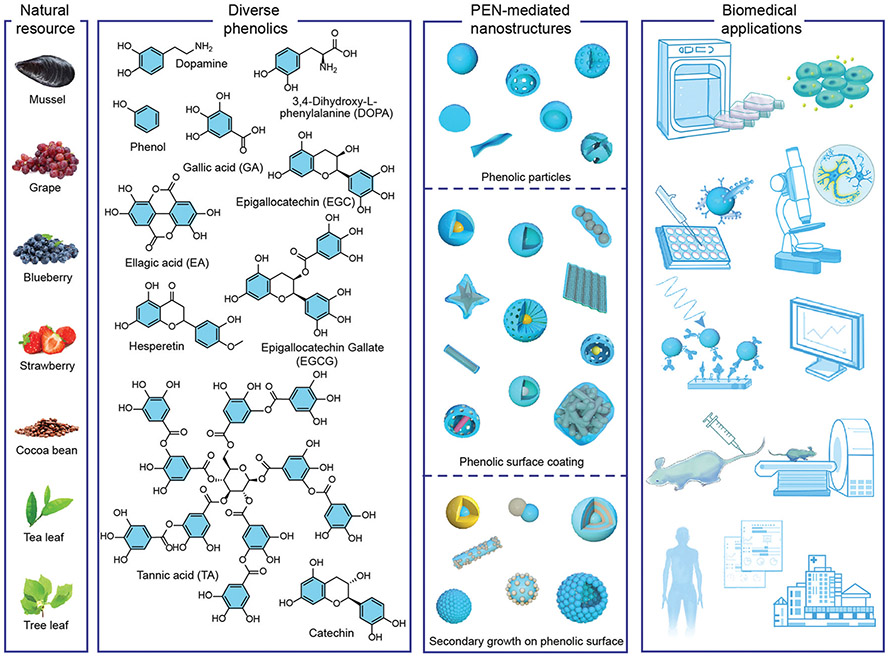
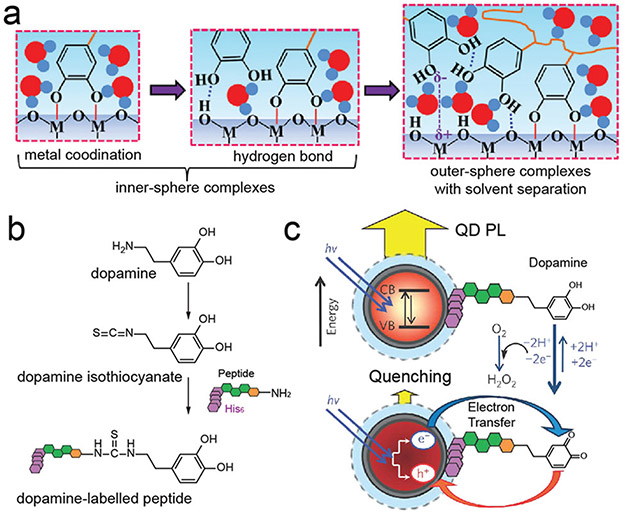
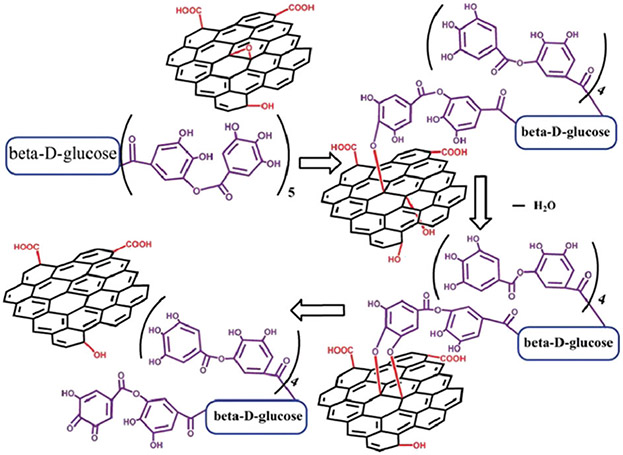
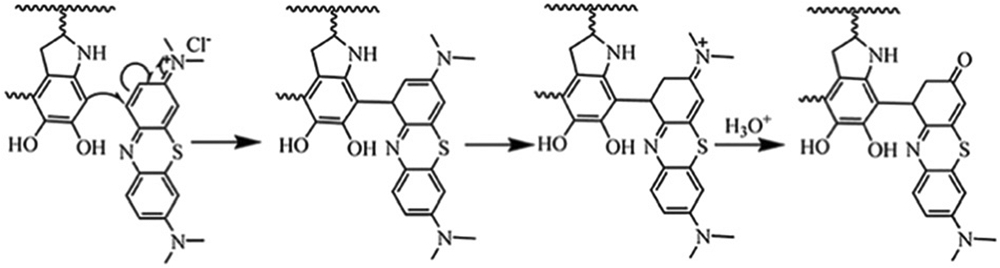
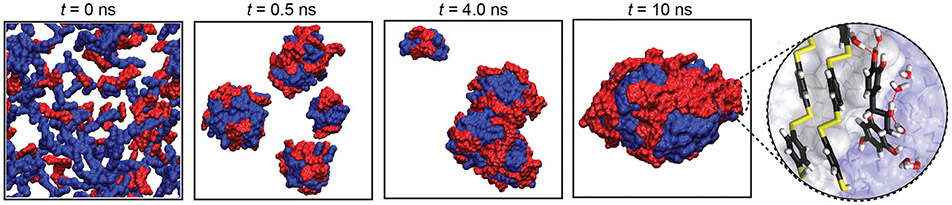
Phenolics are ubiquitous in nature and have gained immense research attention because of their unique physiochemical properties and widespread industrial use. In recent decades, their accessibility, versatile reactivity, and relative biocompatibility have catalysed research in phenolic-enabled nanotechnology (PEN) particularly for biomedical applications which have been a major benefactor of this emergence, as largely demonstrated by polydopamine and polyphenols. Therefore, it is imperative to overveiw the fundamental mechanisms and synthetic strategies of PEN for state-of-the-art biomedical applications and provide a timely and comprehensive summary. In this review, we will focus on the principles and strategies involved in PEN and summarize the use of the PEN synthetic toolkit for particle engineering and the bottom-up synthesis of nanohybrid materials. Specifically, we will discuss the attractive forces between phenolics and complementary structural motifs in confined particle systems to synthesize high-quality products with controllable size, shape, composition, as well as surface chemistry and function. Additionally, phenolic's numerous applications in biosensing, bioimaging, and disease treatment will be highlighted. This review aims to provide guidelines for new scientists in the field and serve as an up-to-date compilation of what has been achieved in this area, while offering expert perspectives on PEN's use in translational research.


Conflict of interest statement

Conflicts of interest

There are no conflicts to declare.

Figures

Fig. 1
Fig. 1
Phenolic-mediated interactions with different materials in PENs.
Fig. 2
Fig. 2
The development of PEN for biomedical applications. From left to right: Representative natural resource of phenolics, chemical structure of representative phenolic molecules, schematic illustration of some typical PEN-mediated particles, and the potential applications in biomedical field, including study of bio–nano interactions, biosensing, imaging and disease treatment, from single molecular and cellular level to animal and clinical trials.
Fig. 3
Fig. 3
(a) pH-Dependent transition of dominant TA–Fe coordination interaction. (b) UV absorption spectra and photo of spherical TA–Fe capsule dispersions at different pH. (c) Stability profiles of capsules at different pH. Reproduced with permission. Copyright 2013, American Association for the Advancement of Science.
Fig. 4
Fig. 4
(a) Schematic illustration of the synthesis of water-dispersible nanoparticles using a ligand with multiple interactions. Reproduced with permission. Copyright 2011, Wiley-VCH. (b) Construction and release process of dopamine self-assembled monolayers on the Au surface under electrochemical modulation. Reproduced with permission. Copyright 2019, American Chemical Society.
Fig. 5
Fig. 5
(a) Proposed adsorption mechanism of catechol groups on metal oxide (e.g., TiO2) surface. Reproduced with permission. Copyright 2016, Wiley-VCH. (b) Synthesis of a dopamine–peptide via amine-reactive isothiocyanate. The His6 sequence in dopamine–peptide can self-assemble onto DHLA–PEG QDs. (c) Proposed energy-transfer mechanism between dopamine–peptide and QD. (b and c) Reproduced with permission. Copyright 2010, Nature Publishing Group.
Fig. 6
Fig. 6
Proposed mechanism of reduction of GO by TA. Reproduced with permission. Copyright 2011, Royal Society of Chemistry.
Fig. 7
Fig. 7
The proposed adsorption mechanism between PDA and MB. Reproduced with permission. Copyright 2014, Royal Society of Chemistry.
Fig. 8
Fig. 8
All-atom MD simulation of the assembly of pBDT (blue) and catechin (red) at 0, 0.5, 4.0, and 10 ns in water. Magnified interface section illustrating the aromatic stacking of BDT and CAT and hydrogen bonding between CAT and water (red lines); carbon, oxygen, hydrogen, and sulphur are coloured black, red, white, and yellow, respectively. Reproduced with permission. Copyright 2020, Nature Publishing Group.
Fig. 9
Fig. 9
(a) Schematic illustration of the proposed interactions between the functional moieties of phenolics and different amino acid of proteins. Asn = asparagine, Val = valine, Asp = aspartic acid. (b) Stability of protein–polyphenol capsules (LYZ, IgG, Hgb, GOx, and CYC) after 1 h of incubation with 100 mM of urea, Tween 20, or NaCl, corresponding to the dominant interactions between the different proteins and TA. Reproduced with permission. Copyright 2020, Wiley-VCH.
Fig. 10
Fig. 10
(a) Schematic illustration of the controlled formation and degradation of the TA–Fe(iii) shell on individual S. cerevisiae. (b) TEM image of yeast@MPN. Reproduced with permission. Copyright 2014, Wiley-VCH.
Fig. 11
Fig. 11
Co-assembled phenolic particles with metal ions and small molecule drugs. (a) The chemical structures of building blocks (Pt–OH, PEG-b-PPOH) and schematic illustration of a phenolic particle prepared by co-polymerization. (b) TEM image of the as-prepared phenolic particles. (a and b) Reproduced with permission. Copyright 2020, Wiley-VCH. (c) Schematic illustration of synthesis of PDA-coated and NIR-responsive carrier-free “nanobomb” (DNPs/N@PDA). (d) TEM images of the DOX nanoparticles (DNPs), PDA-coated DNPs (DNPs@PDA), and NH4HCO3-loaded DNPs@PDA (DNPs/N@PDA). (c–f) Reproduced with permission. Copyright 2018, Wiley-VCH.
Fig. 12
Fig. 12
“Soft template”-directed synthesis of mesoporous phenolic particles. (a–e) SEM images of PDA particles prepared with different mass ratios of P123 to F127: (b) 0 : 1; (c) 1 : 15; (d) 1 : 3; (e) 1 : 1; (f) 5 : 3. Insets: Schematic representation of mesophase transition of PDA particles at different P123/F127 mass ratio. (a–e) Reproduced with permission. Copyright 2018, Wiley-VCH. (f) Schematic illustration of synthesis of the mesoporous MPN particles using polymer cubosomes (PCs) as templates. SEM images of (g) PCs and (h) mesoporous MPN-coated PCs after template removal. (f–h) Reproduced with permission. Copyright 2020, American Chemical Society.
Fig. 13
Fig. 13
In situ deposition of adhesive phenolic coating on pre-formed nanomaterials. (a) Schematic illustration of dopamine-mediated assembly of Au nanoparticles (AuNPs) into PDA-coated nanoworms. (b) TEM images of unassembled AuNPs and assembled nanoworms. (a and b) Reproduced with permission. Copyright 2019, American Chemical Society. (c) Schematic illustration of the surface functionalization of MOF particles by a phase transfer reaction. (d) SEM images of the DPGG-modified MOF particles of different metal ions. Scale bar:1 μm. (c and d) Reproduced with permission. Copyright 2017, Wiley-VCH.
Fig. 14
Fig. 14
Hollow phenolic particles prepared through phenolic coating and template removal. (a) Schematic illustration of synthesis of EGCG–Cu(ii) capsules. SEM images of (b) EGCG–Cu(ii)@CaCO3 nanoparticles and (c) EGCG–Cu(ii) capsules. Reproduced with permission. Copyright 2020, Elsevier. (d) Schematic illustration of preparation of LbL-coated bio-hybrid cancer cell-templated capsules with alternating layers (step i–iii) of either the electrostatically interacting polyelectrolytes dextran sulfate (PDS), poly-l-arginine (pARG) or poly(N-vinylpyrrolidone) (PVP), and TA via hydrogen bonding followed by cell lysis upon hypo-osmotic treatment (iv). TEM images of (e) uncoated cells, (f) bilayers of PVP/TA-coated cells, and (g) bilayers of TA/PVP-coated cells. The red arrows indicate LbL coating. (d–g) Reproduced with permission. Copyright 2014, Wiley-VCH.
Fig. 15
Fig. 15
Interfacial assembly of metal–phenolic hybrid nanoparticles through one-step synthesis. (a) Schematic illustration of self-assembly of polyphenol-based core@shell nanostructures within 1 min using microwave-assisted green chemistry. (b) SEM images and (c) TEM images of Ag@TP with lower and higher magnification. Inset: Optical image of Ag@TP suspension. (d) Confocal laser scanning microscopy image of Ag@TA nanoparticles. (a–d) Reproduced with permission. Copyright 2014, American Chemical Society. (e) Schematic illustration of one-step synthesis of AuPBs. TEM images of AuPBs at different growth times: (e) 1 h, (f) 2 h, and (g) 4 h. (e–h) Reproduced with permission. Copyright 2018, American Chemical Society.
Fig. 16
Fig. 16
Versatile phenolic-based platform for secondary organic molecule modification. (a) Cell targeting performance of MPNs of different metal ions. Inset: AuNP@MPNs with protein corona layer coating and antibody tag. (b) Schematic presentation of antibody-anchored AuNPs with specific protein orientation. (c) TEM image of antibody-anchored AuNPs. Reproduced with permission. Copyright 2020, American Chemical Society. (d) Schematic illustration of the fabrication of AuNP@PDA and AuNP@PDA-cross-linked hydrogel. Reproduced with permission. Copyright 2018, Wiley-VCH.
Fig. 17
Fig. 17
(a) Synthetic strategy for particle engineering using pBDT–TA supramolecular networks. The polyphenol-stabilized particles subsequently allow for the growth of diverse shell materials on the particles. TEM images of (b) Au (c) silica, and (d) MOF hollow structures after removal of the pBDT–TA core. Insets in image (c) and (d): HAADF-STEM images of representative silica and MOF hollow particles and their corresponding EDX mapping results. Reproduced with permission. Copyright 2020, Nature Publishing Group.
Fig. 18
Fig. 18
Cellular uptake study of phenolic nanoparticles. (a) Scheme for the uptake, transportation, and accumulation of PDA nanoparticles in cells. (b) TEM image, (c) enlarged TEM image, and (d) confocal laser scanning microscopy image of cells incubated with PDA nanoparticles for 3 days. (a–d) Reproduced with permission. Copyright 2017, American Chemical Society. (e) Scheme and fluorescence microscopy image of endosomal escape of bare and MPN-coated nanoparticles. Reproduced with permission. Copyright 2019, American Chemical Society.
Fig. 19
Fig. 19
Pharmacokinetics and toxicology investigation of phenolic-based materials. (a) Schematic illustration of administration of dopamine solution for gastrointestinal synthetic epithelial lining to porcine small intestine through a catheter. (b) Schematic illustration of enzyme-catalysed polymerization and PDA deposition on epithelium. (c) Representative images of fresh resected tissue specimens from the human small intestine with PDA coating under ex vivo mechanical stirring and scratching. (d) Quantitative ex vivo evaluation of PDA signal intensities of the coated human tissues under a series of physical conditions. (a–d) Reproduced with permission. Copyright 2020, American Association for the Advancement of Science. (e) Hemolysis evaluation of Fe3O4@PDA nanocomposites at varying concentration. (f) Live/dead calcein-AM staining of 4T1 cells treated with Fe3O4@PDA nanocomposites (green: live; orange: dead). (e and f) Reproduced with permission. Copyright 2020, Wiley-VCH. (g) Overview of the lower gastrointestinal through the endocytosis of Sm(iii)–EC nanoparticles. (h) Cellular interaction between colon polyps and Sm(iii)–EC nanoparticles. (i) Intracellular delivery of functional Sm3+ and EC molecules through the endocytosis of the nanoparticles. (j) Cell viability of normal healthy cells (LO2 and HK-2 cell) treated with Sm(iii)-EC nanoparticles. Reproduced with permission. Copyright 2018, Wiley-VCH.
Fig. 20
Fig. 20
In vitro biosensing of small targets via phenolic-based nanoparticles (a) Schematic illustration of the use of Au@PDA hydrogel for sensing biothiols. (b) UV-vis absorption spectra and photos of Au@PDA hydrogel with 200 μM Ag+ in response to different biothiols (200 μM). (a and b) Reproduced with permission. Copyright 2018, American Chemical Society. (c) Schematic illustration for the synthesis of PDA-mediated SERS nanoprobes for detecting ROS (e.g., H2O2, O2, and OH). The iron–porphyrin site of myoglobin in close proximity to Au core is used as a Raman reporter. Reproduced with permission. Copyright 2017, Wiley-VCH.
Fig. 21
Fig. 21
In vitro biosensing of biomacromolecules by using phenolic-based nanoparticles. (a) Schematic illustration of the synthesis of nanoprobes containing PDA-coated Au nanoparticles (Au@PDA NPs) and hairpin-DNA-based (pDNA), and their use for detecting miRNA targets in living hMSCs. Reproduced with permission. Copyright 2015, American Chemical Society. (b) Schematic illustration and fluorescence images of a DNA microarray of Cy3/Cy5 FRET on a plasmonic substrate. After binding a target DNA, the dye pair in the molecular beacon separated. Reproduced with permission. Copyright 2020, Wiley-VCH. (c) Schematic illustration of the synthesis of hollow MMOSs. (d) Fluorescence intensities of probe DNA depended on different concentrations of colloidal spheres. Insets are the schematic illustration of the interactions between probe and materials. (c and d) Reproduced with permission. Copyright 2018, Wiley-VCH.
Fig. 22
Fig. 22
In vitro biosensing of diverse cell types via phenolic-based nanoparticles. (a) Proposed mechanism for PDA nanoparticle-based cytosensor for detecting CEM cancer cells. (b) Fluorescence intensity of suspension containing the nanoprobes and different cell lines (e.g., MCF-7, A549, HeLa and CCRF-CEM). (a and b) Reproduced with permission. Copyright 2016, Royal Society of Chemistry. (c) Schematic illustration of the immunoassay using SERS-encoded magnetic nanoprobes for bacterial detection. (d) Raman spectra of E. coli O157:H7 at different concentrations after being conjugated with nanoprobes. Inset: Raman intensity at 1341 cm−1 depends on the logarithm of the bacterial concentration. (e) The detecting selectivity of this platform by using control buffers and various types of bacteria (106 CFU per mL). (c–e) Reproduced with permission. Copyright 2016, American Chemical Society.
Fig. 23
Fig. 23
In vivo MRI and PAI performance of phenolic-based nanoparticles. (a) Synthesis and (b) TEM image of Gd3+-doped PDA nanoparticles. (c) Transverse MRI view of a mouse heart before and after injection of the MR CAs. Reproduced with permission. Copyright 2019, American Chemical Society. (d) Schematic illustration of T1/T2 MRI-guided cancer therapy by DOX-loaded TA-Fe(iii) coordination network (DOX@CNMN). (e) r1 and r2 relaxivities of CNMN as a function of the Fe molar concentration in the solution, and (f) the corresponding MR images of CNMN. (d–f) Reproduced with permission. Copyright 2020, American Chemical Society. (g) Schematic illustration of silica nanoparticles with PDA and PPy coating for PAI. (h) Photoacoustic images of suspensions of different particles and (i) photoacoustic amplitude of PPy–PDA-coated silica particles at different concentration. Inset: Photoacoustic images at 700 nm of the tumor before and after injection of the particles. (g–i) Reproduced with permission. Copyright 2018, American Chemical Society.
Fig. 24
Fig. 24
In vivo bioimaging of various imaging techniques on the basis of phenolic-derivate particle systems. (a) Serial coronal PET images at different time points post-intravenous injection of 89Zr-labelled phenolic particles in tumor-bearing mice. (b) 3D fluorescence images reconstructed with the whole body transillumination images. (a and b) Reproduced with permission. Copyright 2017, Wiley-VCH. (c) Schematic illustration of synthesis of PDA-coated La nanoparticles for imaging-guided cancer therapy. (d) X-ray CT images, and (e) HU values of PDA-coated La nanoparticles and iodixanol aqueous solution with different concentrations. (f) X-ray CT images of tumor-bearing mice after intratumoral injection of nanoparticles. (c–f) Reproduced with permission. Copyright 2017, American Chemical Society.
Fig. 25
Fig. 25
Drug delivery performance by phenolic-based drug delivery systems. (a) Biodistribution study of 89Zr-labelled phenolic drug delivery system. (b) Quantitative region of interest (ROI) of analysis of major organs and tumor at various time points. (a and b) Reproduced with permission. Copyright 2018, Wiley-VCH. (c) Schematic illustration of green fluorescent protein (GFP) delivery by Au@mPDA. (d) Intracellular GFP delivery enabled by Au@mPDA under NIR irradiation. (c and d) Reproduced with permission. Copyright 2020, Elsevier. (e) Schematic illustration of intracellular protein delivery from a protein–polyphenol nanoparticle. (f) Cell viability of cancers cells incubated in the presence of free anticancer drug (CYC), CYC–TA nanoparticles, or IgG–TA nanoparticles. (g) X-Gal staining of cancer cells treated with β-Gal–TA nanoparticles. (e–g) Reproduced with permission. Copyright 2020, American Chemical Society.
Fig. 26
Fig. 26
PTT and PDT performance of phenolic-derivate particle systems. (a) Schematic illustration of NIR-triggered stromal depletion for enhanced tumor PTT. (b) Temperature increasing profiles of different PTAs under 1064 nm NIR-II irradiation. (a and b) Reproduced with permission. Copyright 2020, Royal Society of Chemistry. (c) In vitro 1O detection assay of 4T1 cells with different treatment in normoxia and hypoxia conditions. Scale bar: 10 μm. (d) Viability of 4T1 cells after various treatments under hypoxia. (e) In vivo fluorescence images of 4T1 tumor bearing mice with different treatments observed at various time points after intravenous injection. (f) The corresponding mean fluorescence intensity (MFI) values of tumor and major organs with different treatment harvested at 48 h post-injection. (g) Photos of the tumors harvested at day 20 post PDT treatments. (c–g) Reproduced with permission. Copyright 2019, Wiley-VCH.
Fig. 27
Fig. 27
Diseases therapy performance of PEN-derivate particle systems. (a) Schematic illustration of DC binding, phagocytosis, and digestion of tumor cells treated with PDL1-loaded PDA nanoparticles (PDL1Ab-IQ/PN) under NIR irradiation. (b) TEM images of the phagocytosis of tumor cells upon coculture with DCs. Scale bar: 2 μm. (c) Enlarged images of corresponding blue-lined box areas in (b). Scale bar: 200 nm. Reproduced with permission. Copyright 2019, American Chemical Society. (d) Schematic illustration of lipopolysaccharide (LPS)-induced periodontal disease and design of ROS scavenging. (e) Photographic images of Kunming mice 3 days after various treatments. (d and e) Reproduced with permission. Copyright 2018, American Chemical Society. (f) Schematic illustration of the protocol for a test including the grafting coumarin probe, bacterium (MDR KP) fluorescence detection, and photothermal treatment. (g) Time-lapse PA images captured at an interval of 10 min with an 808 nm NIR light. Scale bar: 2 mm. (h) Thermal images of the infection regions irradiated with 808 nm NIR irradiation. (i) Photographs of the MDR KP colonies on the plate count agar plates. (f–i) Reproduced with permission. Copyright 2020, American Chemical Society.

References

    1. Bravo L, Nutr. Rev, 1998, 56, 317–333. - PubMed
    1. Quideau S, Deffieux D, Douat-Casassus C and Pouysegu L, Angew. Chem., Int. Ed, 2011, 50, 586–621. - PubMed
    1. Liu Y, Ai K and Lu L, Chem. Rev, 2014, 114, 5057–5115. - PubMed
    1. He LR, Mu CD, Shi JB, Zhang QA, Shi B and Lin W, Int. J. Biol. Macromol, 2011, 48, 354–359. - PubMed
    1. Waite JH and Tanzer ML, Science, 1981, 212, 1038–1040. - PubMed