

NHP2 downregulation counteracts hTR-mediated activation of the DNA damage response at ALT telomeres
- PMID: 33595114
- PMCID: PMC7957427
- DOI: 10.15252/embj.2020106336
NHP2 downregulation counteracts hTR-mediated activation of the DNA damage response at ALT telomeres
Abstract
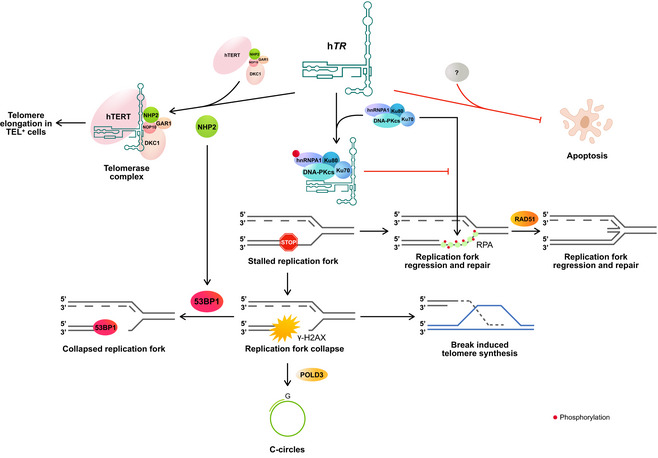
About 10% of cancer cells employ the "alternative lengthening of telomeres" (ALT) pathway instead of re-activating the hTERT subunit of human telomerase. The hTR RNA subunit is also abnormally silenced in some ALT+ cells not expressing hTERT, suggesting a possible negative non-canonical impact of hTR on ALT. Indeed, we show that ectopically expressed hTR reduces phosphorylation of ssDNA-binding protein RPA (p-RPAS33 ) at ALT telomeres by promoting the hnRNPA1- and DNA-PK-dependent depletion of RPA. The resulting defective ATR checkpoint signaling at telomeres impairs recruitment of the homologous recombination protein, RAD51. This induces ALT telomere fragility, increases POLD3-dependent C-circle production, and promotes the recruitment of the DNA damage marker 53BP1. In ALT+ cells that naturally retain hTR expression, NHP2 H/ACA ribonucleoprotein levels are downregulated, likely in order to restrain DNA damage response (DDR) activation at telomeres through reduced 53BP1 recruitment. This unexpected role of NHP2 is independent from hTR's non-canonical function in modulating telomeric p-RPAS33 . Collectively, our study shines new light on the interference between telomerase- and ALT-dependent pathways and unravels a crucial role for hTR and NHP2 in DDR regulation at ALT telomeres.
Keywords: ALT; NHP2; RPA; hTR; telomerase.
© 2021 The Authors.
Conflict of interest statement
The authors declare that they have no conflict of interest.
Figures
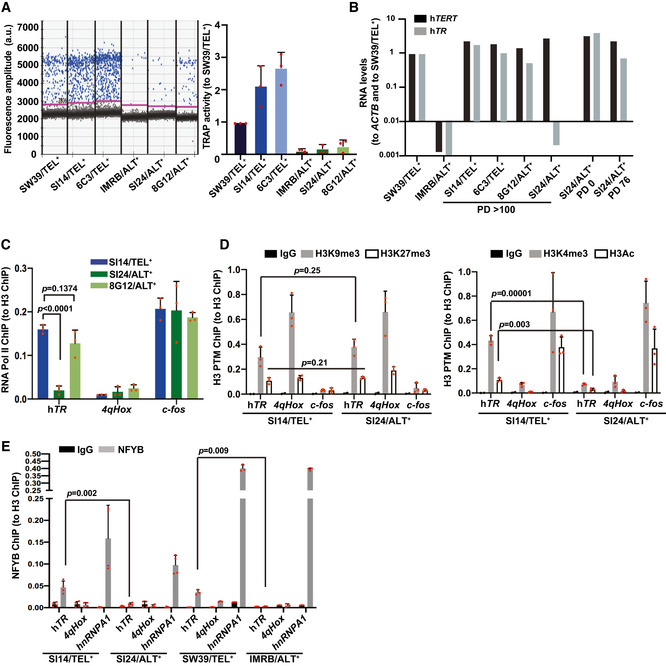
Left: Telomerase activity measured using ddTRAP assay. The horizontal pink lines represent the threshold used in these samples for background correction. Each dot on the ddPCR output represents a unique droplet that is either positive or negative for fluorescent signal. Right: Quantification of TRAP activity after normalization to SW39/TEL+ cells (n = 3).
hTR and hTERT expression, normalized to ACTB mRNA and to SW39/TEL+.
RNA Pol II binding at hTR promoter in SI14/TEL+, SI24/ALT+, and 8G12/ALT+ cell lines, normalized to H3 ChIP. Control loci with, respectively, high or low transcriptional activity: c‐fos promoter and subtelomeric 4qHox locus (n = 3). Statistical analyses were performed using one‐way ANOVA with post hoc Tukey’s test for multiple comparisons.
H3K9me3 and H3K27me3 (left) or H3K4me3 and H3Ac (right) densities at hTR promoter in SI14/TEL+ and SI24/ALT+, normalized to H3 (n = 3). Control loci as in (C).
NFYB binding at hTR promoter in SI14/TEL+, SI24/ALT+, SW39/TEL+, and IMRB/ALT+ cells normalized to H3. Control loci with, respectively, high and low NFYB binding: hnRNPA1 promoter and subtelomeric 4qHox (n = 3).
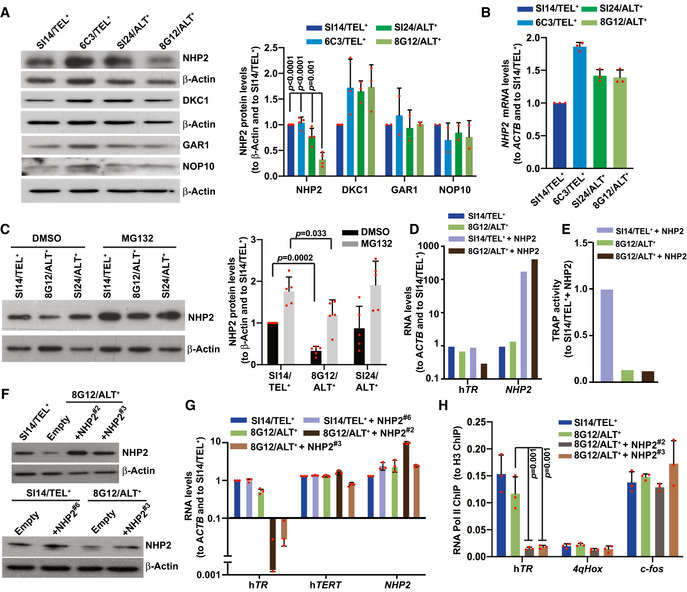
Western blot for hTR chaperone proteins in TEL+ and ALT+ hybrids. β‐Actin is used as loading control. Quantification of Western blots is shown on the right, normalized to β‐Actin and to SI14/TEL+ cells (n = 2–4). Statistical analyses were performed using one‐way ANOVA with post hoc Tukey’s test for multiple comparisons.
NHP2 mRNA expression levels, normalized to ACTB mRNA and to SI14/TEL+ cells (n = 3).
Western blot for NHP2 in SI14/TEL+, SI24/ALT+, and 8G12/ALT+ cell lines treated with DMSO or 10 μM MG132 for 6 h. β‐Actin served as loading control. Quantifications are shown on the right, normalized to β‐Actin and to SI14/TEL+ cells (n = 5). Statistical analyses were performed with Student's two‐tailed unpaired t‐test.
hTR RNA and NHP2 mRNA expression, normalized to ACTB mRNA and to SI14/TEL+.
Telomerase activity measured with ddTRAP assay in NHP2‐overexpressing 8G12/ALT+ cells, normalized to NHP2‐overexpressing SI14/TEL+.
(Top) Western blot for NHP2 overexpression in 8G12/ALT+ clonal cell lines. β‐Actin served as loading control. SI14/TEL+ cells are shown as reference for NHP2 expression in hybrids. (Bottom) Western blot for NHP2 overexpression in SI14/TEL+ and 8G12/ALT+ cells compared to empty vector control. β‐Actin served as loading control.
hTR RNA, hTERT, and NHP2 mRNA expression, normalized to ACTB mRNA and to SI14/TEL+ (n = 3).
RNA Pol II binding at hTR promoter, normalized to H3 ChIP (n = 3). See Fig 1C legend for control loci. Statistical analyses were performed using one‐way ANOVA with post hoc Tukey’s test for multiple comparisons.

hTR RNA, hTERT, and NHP2 mRNA expression, normalized to ACTB mRNA and to 143B/TEL+ cells, in a series of TEL+ and ALT+ human cell lines as indicated (n = 3).
Western blot for NHP2 expression. β‐Actin served as loading control. Quantification is shown on the right after normalization to β‐Actin and to 143B/TEL+ cells (n = 3).

hTR RNA expression, normalized to ACTB mRNA and to U2OS cells (n = 3).
Western blot for NHP2 expression in the early passages of hTR‐expressing IMRB or U2OS cells, with β‐Actin as loading control.
Quantification of doubling time for U2OS, U2OS‐hTR, IMRB, and IMRB‐hTR cell lines (n = 3). Statistical analyses were performed with Student's two‐tailed unpaired t‐test with Welch's correction for normality of distribution.
Western blot in U2OS and U2OS‐hTR cells treated with or without hydroxyurea (HU) (2 mM for 24 h), for the indicated proteins. β‐Actin and Vinculin served as loading controls.
Representative images for co‐localization between p‐RPA32S33 (green) and telomeres (red FISH probe). White arrows indicate co‐localization events. Scale bars: 5 μm. Quantification is shown on the right. At least 50 nuclei were scored in each of the three independent experiments performed. Each dot represents the number of p‐RPA32S33‐telomere co‐localizations in one nucleus with the red line marking the mean value. Statistical analyses were performed with Student's two‐tailed unpaired t‐test with Welch’s correction for normality of distribution.
Quantification of live cell numbers with trypan blue staining and manual counting, 72 h post‐transfection with siLuc, sihTR#1, or sihTR#2, measured as the percentage of siLuc‐treated cells (n = 3). On the right, representative images of U2OS cells treated with sihTR#1 for 72 h. Statistical analyses were performed using one‐way ANOVA with post hoc Tukey's test for multiple comparisons.
Western blot analyses in the indicated cell lines cells transfected for 48 h with siLuc or sihTR, with the indicated antibodies. U2OS cells treated with hydroxyurea (2 mM for 24 h) were used as positive controls.

- A
Representative images for fragile telomeres using the CO‐FISH assay. Lagging strands (C‐probe) and leading strands (G‐probe) were marked with green PNA probes and red LNA probes, respectively. White circles and arrows indicate “smeary” or “doublet” telomeric signals, respectively. Quantification of fragile telomeres is shown on the right as the percentage of total telomeres counted (n = 932–1,073). Comparison of fragile to non‐fragile telomere percentage was performed using chi‐squared test.
- B
Representative images for co‐localization between RAD51 (green) and telomeres (red FISH probe). White arrows indicate representative RAD51‐telomere co‐localization events. Quantifications are shown on the right. A total of 120 nuclei were scored from two independent experiments.
- C
Representative images for TIF quantification: co‐localization between 53BP1 (green) and telomeres (red FISH probe) in U2OS or IMRB cells with or without ectopic hTR overexpression. White arrows indicate TIF. Quantification of TIF is on the right. A total of 110–170 nuclei were scored from three independent experiments. Each dot represents the number of TIF per nucleus.
- D
Representative images for TIF quantification, as in (C), in U2OS or U2OS‐hTR cells, treated as indicated with DMSO or 5 μM ATRi or 5 μM ATMi for 20 h. White arrows indicate TIF.
- E
Quantification of TIF from (D). At least 65 nuclei were scored in each of the two independent experiments performed. Each dot represents the number of TIF per nucleus. Statistical analyses were performed using one‐way ANOVA with post hoc Games–Howell’s test for multiple comparisons.
- F
Representative images for co‐localization between POLD3 (red) and RAP1 (green). White arrows indicate co‐localization events. Quantification of co‐localization events between POLD3 and RAP1 is shown on the right. A total of 190–230 nuclei were scored from three independent experiments.
- G
C‐circle analysis using slot blot assay hybridized with radioactive C‐rich telomeric probe. Quantification is shown below (n = 7). Statistical analyses were performed using the non‐parametrical Mann Whitney test.
- H, I
C‐circle analyses in the indicated cell lines 72 h after treatment with siPOLD3 or siLuc used as control for transfection. Quantifications are shown below (n = 3). siSMARCAL1 was used as positive control for increased C‐circle production in cells with defective fork reversal activity (Zhang et al, 2019b).
- A
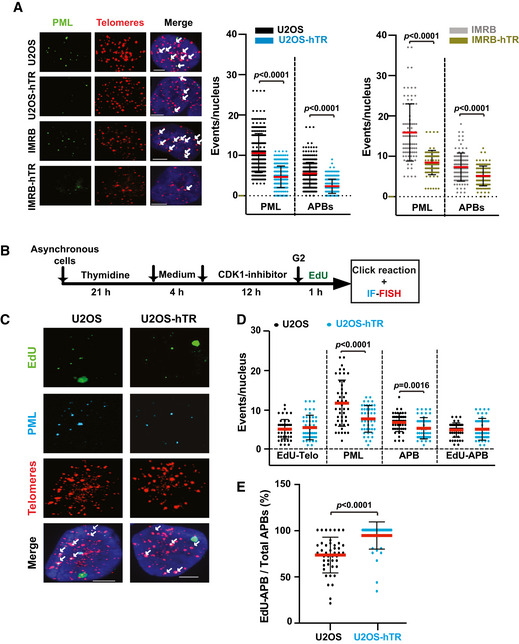
Representative images for co‐localization between PML (green) and telomeres (red FISH probe). White arrows indicate co‐localization events, marking APBs. Quantification of images is shown on the right. A total of 85–300 nuclei were scored from four independent experiments. Each dot represents the number of events per nucleus: PML foci or APBs.
- B
Experimental scheme for ATSA (ALT telomere DNA synthesis in APBs), used to measure G2/M telomeric DNA synthesis, within PML bodies.
- C
Representative images for co‐localization between EdU (green) and telomeres (red FISH probe) within PML bodies (cyan) in U2OS and U2OS‐hTR cells. White arrows indicate co‐localization events.
- D, E
Quantification of images shown in (C). Co‐localization events between EdU foci and APBs were analyzed (D) and the percentage of APBs that are actively engaged in G2/M telomeric synthesis was calculated (E). A total of at least 50 nuclei were scored from three independent experiments.
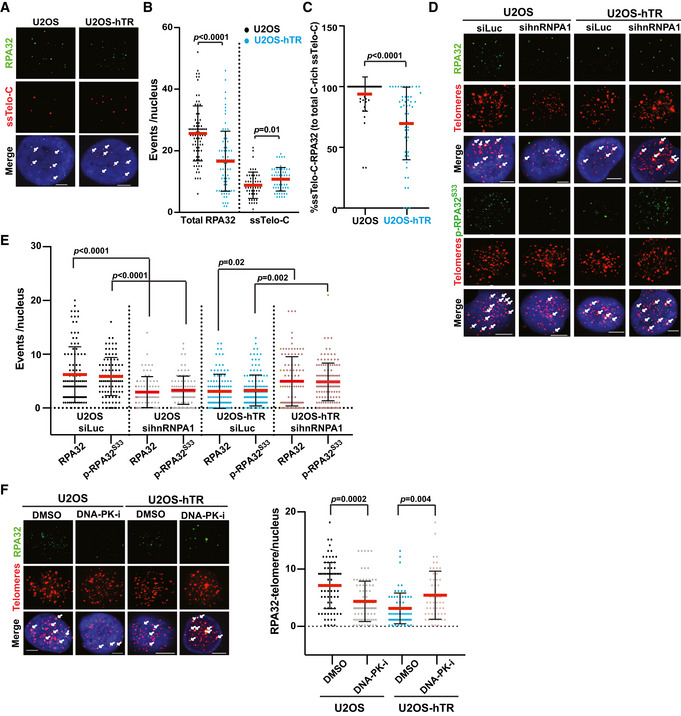
Representative images for co‐localization between RPA32 (green) and single‐stranded C‐rich telomeric sequences (ss‐Telo‐C, red FISH probe), in G2/M‐synchronized cells. White arrows indicate co‐localization events.
Quantification of images in (A). A total of at least 55 nuclei were scored from three independent experiments. Each dot represents the number of events per nucleus.
Quantification of images in (A) as the percentage of single‐stranded C‐rich telomeric sequences associated with RPA32 to total single‐stranded C‐rich telomeric sequences. A total of at least 55 nuclei were scored from three independent experiments.
Representative images for co‐localization between RPA32 or p‐RPA32S33 (green) and telomeres (red FISH probe), in the indicated cell lines treated with siLuc or sihnRNPA1 for 48 h. White arrows indicate co‐localization events.
Quantification of images in (D). A total of 85–135 nuclei were scored from three independent experiments. Each dot represents the number of events per nucleus. Statistical analyses were performed using one‐way ANOVA with post hoc Games–Howell’s test for multiple comparisons.
Representative images for co‐localization between RPA32 (green) and telomeres (red FISH probe) in the indicated cell lines treated with either DMSO or 10 μM NU7026 DNA‐PK‐inhibitor (DNA‐PK‐i) for 48 h. White arrows indicate co‐localization events. Quantifications are shown on the right. A total of 53–84 nuclei were scored from three independent experiments. Statistical analyses were performed using one‐way ANOVA with post hoc Games–Howell’s test for multiple comparisons.
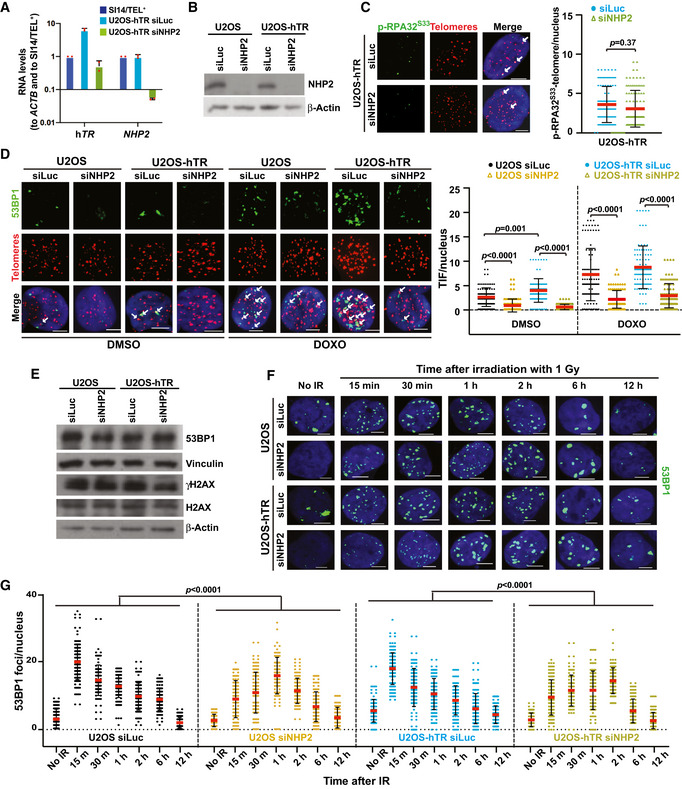
hTR and NHP2 mRNA expression in U2OS‐hTR cells 72 h post‐transfection with siLuc or siNHP2, normalized to ACTB mRNA and to SI14/TEL+ cells (n = 2).
Western blot showing NHP2 protein levels in the indicated cells treated with siLuc or siNHP2, 72 h post‐transfection. β‐Actin served as loading control.
Representative images for co‐localization between p‐RPA32S33 (green) and telomeres (red FISH probe) in U2OS‐hTR cells treated with control siLuc or siNHP2, 72 h post‐transfection. White arrows indicate co‐localization events. Quantification of images is shown on the right. Each dot indicates the number of co‐localization events per nucleus (n = 2). Statistical analyses were performed with Student’s two‐tailed unpaired t‐tests with Welch's correction for normality of distribution.
Representative images for TIF quantification: co‐localization between 53BP1 (green) and telomeres (red FISH probe), measured 72 h post‐transfection with siLuc or siNHP2 in cells further treated with either DMSO or Doxorubicin (DOXO, 1.5 μM) for 2 h. White arrows indicate TIF. Quantification of TIF is shown on the right. A total of at least 100 nuclei were scored from two independent experiments. Each dot represents the number of TIF per nucleus. Statistical analyses were performed using one‐way ANOVA with post hoc Games–Howell’s test for multiple comparisons.
Western blot analyses in U2OS and U2OS‐hTR cells treated with the indicated siRNAs, 72 h post‐transfection to detect total protein levels using the indicated antibodies. β‐Actin and Vinculin served as loading controls.
Representative images for 53BP1 foci formation in U2OS and U2OS‐hTR cells, 72 h post‐transfection with siLuc or siNHP2, exposed to 1 Gy irradiation, and fixed at various time points post‐irradiation as indicated.
Quantification of images shown in (F). Each dot represents the number of 53BP1 foci per nucleus. A total of 114–140 nuclei were scored from two independent experiments. Statistical analyses were performed using two‐way ANOVA Mixed effect model.
References
-
- Arnoult N, Van Beneden A, Decottignies A (2012) Telomere length regulates TERRA levels through increased trimethylation of telomeric H3K9 and HP1α. Nat Struct Mol Biol 19: 948–956 - PubMed
-
- Atkinson SP, Hoare SF, Glasspool RM, Keith WN (2005) Lack of telomerase gene expression in alternative lengthening of telomere cells is associated with chromatin remodeling of the hTR and hTERT gene promoters. Cancer Res 65: 7585–7590 - PubMed
-
- Benyelles M, O’Donohue M‐F, Kermasson L, Lainey E, Borie R, Lagresle‐Peyrou C, Nunes H, Cazelles C, Fourrage C, Ollivier E et al (2020) NHP2 deficiency impairs rRNA biogenesis and causes pulmonary fibrosis and Høyeraal‐Hreidarsson syndrome. Hum Mol Genet 29: 907–922 - PubMed
-
- Blackburn EH (1991) Structure and function of telomeres. Nature 350: 569–573 - PubMed
Publication types
MeSH terms
Substances
LinkOut - more resources
Full Text Sources
Other Literature Sources
Molecular Biology Databases
Research Materials
Miscellaneous
