. 2021 May;87(5):689-700.
doi: 10.1007/s00280-021-04239-9. Epub 2021 Feb 17.

Trilaciclib dose selection: an integrated pharmacokinetic and pharmacodynamic analysis of preclinical data and Phase Ib/IIa studies in patients with extensive-stage small cell lung cancer

Affiliations

Trilaciclib dose selection: an integrated pharmacokinetic and pharmacodynamic analysis of preclinical data and Phase Ib/IIa studies in patients with extensive-stage small cell lung cancer

Chao Li et al. Cancer Chemother Pharmacol. 2021 May.

Abstract

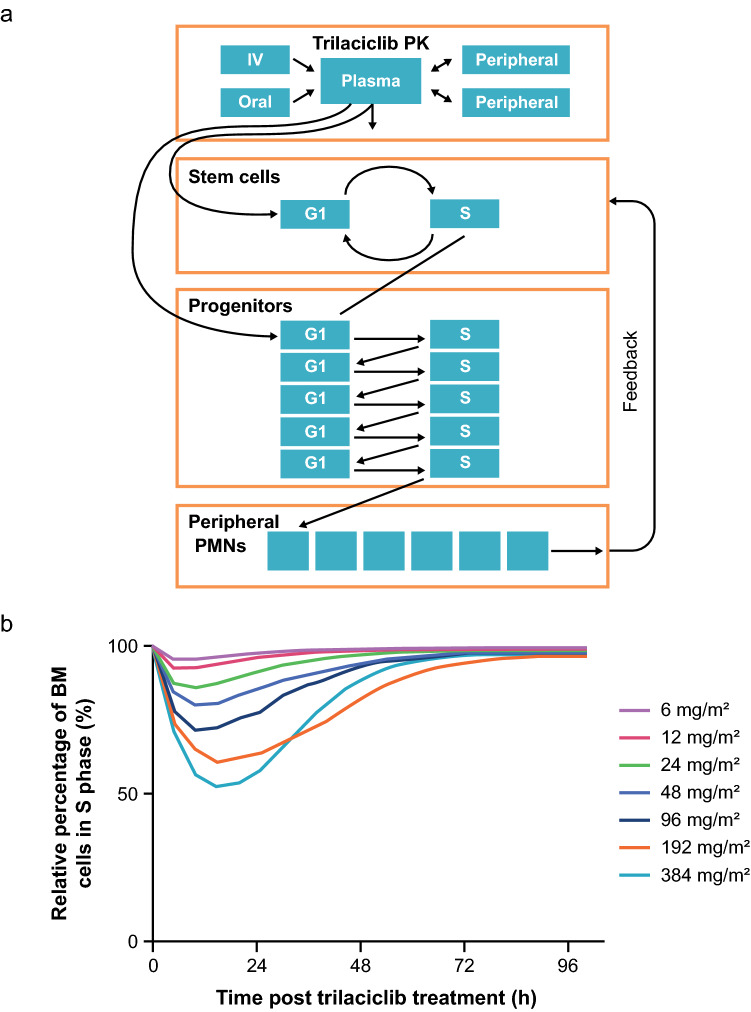
Purpose: Trilaciclib is a first-in-class CDK4/6 inhibitor that transiently arrests hematopoietic stem and progenitor cells (HSPCs) in the G1 phase of the cell cycle to preserve them from chemotherapy-induced damage (myelopreservation). We report integrated analyses of preclinical and clinical data that informed selection of the recommended Phase II dose (RP2D) used in trilaciclib trials in extensive-stage small cell lung cancer (ES-SCLC).

Methods: A semi-mechanistic pharmacokinetic/pharmacodynamic (PK/PD) model developed from preclinical data guided selection of an optimal dose for G1 bone marrow arrest in a first-in-human Phase I study (G1T28-1-01). PK, PD, safety, and efficacy data from G1T28-1-01 and two Phase Ib/IIa studies (G1T28-02/-03) in ES-SCLC were analyzed to support RP2D selection.

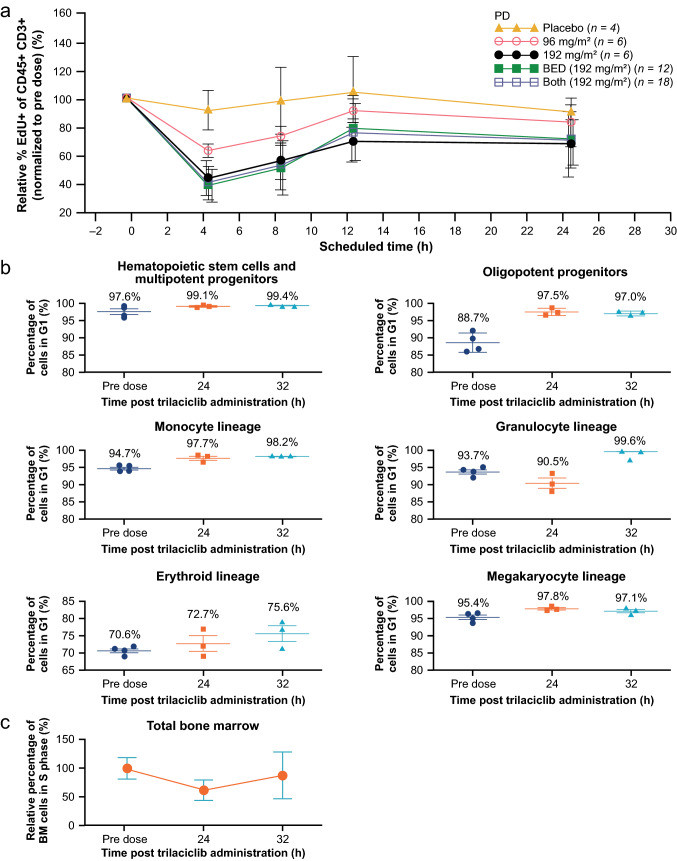
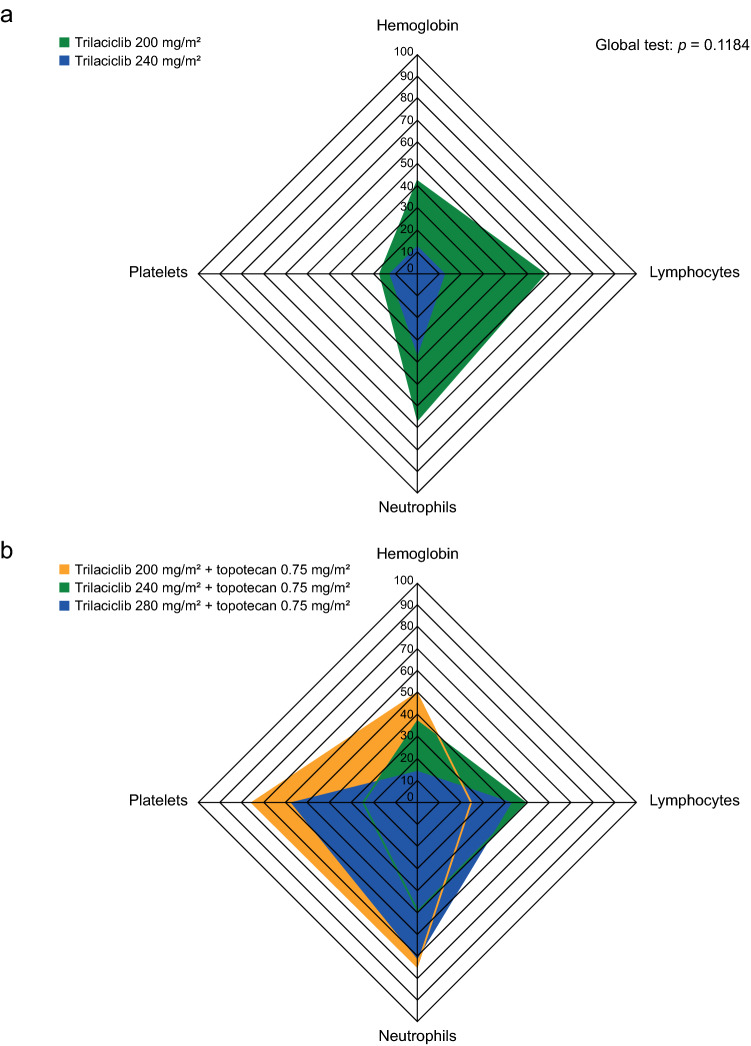
Results: Model simulation of bone marrow arrest based on preclinical data predicted that a ≥ 192 mg/m2 dose would induce a 40-50% decrease in total bone marrow proliferation in humans and almost 100% cell cycle arrest of cycling HSPCs. Consistent with this model, analysis of bone marrow aspirates in healthy volunteers after trilaciclib 192 mg/m2 administration demonstrated almost 100% G1 arrest in HSPCs and 40% decrease in total bone marrow proliferation, with minimal toxicity. G1T28-02/-03 reported similar PK parameters with trilaciclib 200 mg/m2 but slightly lower exposures than expected compared with healthy volunteers; consequently, 240 and 280 mg/m2 doses were also tested to match healthy volunteer exposures. Based on PK and relevant safety data, 240 mg/m2 was selected as the RP2D, which was also favored by myelopreservation endpoints in G1T28-02/-03.

Conclusion: Integrated PK/PD, safety, and efficacy data support 240 mg/m2 as the RP2D for trilaciclib. CLINICALTRIALS.

Gov identifiers: NCT02243150; NCT02499770; NCT02514447.

Keywords: CDK4/6 inhibitor; Chemotherapy-induced myelosuppression; Myelopreservation; Pharmacodynamics; Pharmacokinetics; Trilaciclib.


Conflict of interest statement

Chao Li: employee of G1 Therapeutics, Inc. at time of study. Lowell Hart: consultancy fees and research funding to institution from G1 Therapeutics, Inc. Taofeek K. Owonikoko: none to declare regarding this work. Raid Aljumaily: none to declare regarding this work. Caio Max Rocha Lima: none to declare regarding this work. Paul R. Conkling: research funding from Ignyta, Roche, BMS, Arcus Bioscience, Janssen, Aptose, and US Oncology Research. Roy Timothy Webb: none to declare regarding this work. Robert M. Jotte: none to declare regarding this work. Steven Schuster: none to declare regarding this work. William J. Edenfield: consultancy fees from Chimerix. Deborah A. Smith: consultancy fees from G1 Therapeutics, Inc. Mark Sale: consultancy fees from G1 Therapeutics, Inc. Patrick J. Roberts: employee of G1 Therapeutics, Inc. at time of study. Rajesh K. Malik: employee of G1 Therapeutics, Inc. Jessica A. Sorrentino: employee of G1 Therapeutics, Inc.

Figures

Fig. 1
Fig. 1
Final PK/PD model and simulation of bone marrow arrest. The final model (a) was a linear three-compartment model with first-order absorption. The model consisted of a population of stem cells cycling between G1 and S/G2/M phases, with a single compartment for G1 phase and a single compartment for S/G2/M phase (cycling cells). On each cycle between G1 phase and cycling, a population of bone marrow progenitor cells was created. The bone marrow model consisted of six populations of G1 phase and cycling cells arranged sequentially, such that the initial cells (from cycling stem cells into bone marrow progenitor G1 phase) progressed through five cycles of G1–S/G2/M-phase transitions. At the final bone marrow cycling phase, the population of cells transitioned to peripheral neutrophils. The peripheral neutrophil population was represented by six sequential cell populations. In addition, a feedback mechanism was modeled wherein a “target” for peripheral neutrophils was set to the initial neutrophil count and deviations from this target resulted in increased or decreased turnover of stem cells, thereby maintaining a relatively constant peripheral neutrophil count. Preclinical and clinical observations suggest there is a “persistence effect,” possibly related to change in Cyclin D, where G1 arrest is maintained for some period of time beyond trilaciclib exposure. This effect was parameterized by a slowing of the transition of S-phase stem cells back to G1 phase by the effects of trilaciclib. To represent this effect, a parameter for a “persistence effector” was incorporated, with a baseline amount set equal to the population size of S/G2/M-phase stem cells. This parameter was given an input proportional to the S/G2/M-phase stem cell population and then declined with a linear kinetics. Simulations of total bone marrow arrest (b) represent mean values from 500 individuals. BM bone marrow, IV intravenous, PD pharmacodynamics, PK pharmacokinetics, PMN polymorphonuclear cells
Fig. 2
Fig. 2
Effect of trilaciclib on lymphocyte and human bone marrow proliferation. a Relative percentage of EdU+ cells of the CD45+/CD3+ lymphocyte population assessed in an ex vivo (PHA)-stimulated lymphocyte proliferation assay. Blood samples were drawn from subjects in the SAD (96 and 192 mg/m2) and BED cohorts pre-dose and at 4, 8, 12, and 24 h after the end of infusion, and then treated with PHA for 48 h to stimulate lymphocyte proliferation. b Percentage of bone marrow progenitor subsets in the G1 phase at 24 and 32 h post trilaciclib dose. Bone marrow aspirates were drawn from subjects in the BED cohort at various time points [pre-dose (n = 5), and 24 (n = 3) or 32 (n = 4) h post trilaciclib dose]. Two bone marrow samples (one pre-dose and one at 32 h post-dose) were excluded from analysis owing to contamination with peripheral blood. c Relative percentage of total bone marrow cells in the S phase at 24 and 32 h post-trilaciclib dose (n = 10). Data shown are mean ± standard deviation. BED biologically effective dose, BM bone marrow, EdU 5′-ethynyl-2′-deoxyuridine, PD pharmacodynamics, PHA phytohemagglutinin, SAD single ascending dose
Fig. 3
Fig. 3
Radar plots of Grade 3/4 laboratory abnormalities in a Part 1 of Study G1T28-02 [Safety Analysis Set, all enrolled patients who received at least one dose of any study drug (n = 20)] and b Part 1 of Study G1T28-03 [Intent-to-Treat Analysis Set, all enrolled patients who received at least one dose of any study drug (n = 32)]. The radar charts provide a graphic visualization of the efficacy of each trilaciclib dose for the two studies. The charts display Grade 3/4 laboratory abnormalities for hemoglobin, lymphocytes, neutrophils, and platelets to create a unique shape for each treatment group. Each axis of the chart represents the proportion of Grade 3/4 abnormalities for a hematology laboratory parameter, with proportion increasing towards the vertex of the axis. The shaded area of the whole shape, reflecting the multi-lineage Grade 3/4 abnormalities, was compared between treatment groups using a multivariate test to generate the p value

References

    1. Lyman GH. Chemotherapy dose intensity and quality cancer care. Oncol (Williston Park) 2006;20(14 Suppl 9):16–25. - PubMed
    1. Barreto JN, McCullough KB, Ice LL, Smith JA. Antineoplastic agents and the associated myelosuppressive effects: a review. J Pharm Pract. 2014;27(5):440–446. doi: 10.1177/0897190014546108. - DOI - PubMed
    1. Taylor SJ, Duyvestyn JM, Dagger SA, Dishington EJ, Rinaldi CA, Dovey OM, Vassiliou GS, Grove CS, Langdon WY. Preventing chemotherapy-induced myelosuppression by repurposing the FLT3 inhibitor quizartinib. Sci Transl Med. 2017 doi: 10.1126/scitranslmed.aam8060. - DOI - PubMed
    1. Smith RE. Trends in recommendations for myelosuppressive chemotherapy for the treatment of solid tumors. J Natl Compr Cancer Netw. 2006;4(7):649–658. doi: 10.6004/jnccn.2006.0056. - DOI - PubMed
    1. Weiss JM, Csoszi T, Maglakelidze M, Hoyer RJ, Beck JT, Domine Gomez M, Lowczak A, Aljumaily R, Rocha Lima CM, Boccia RV, Hanna W, Nikolinakos P, Chiu VK, Owonikoko TK, Schuster SR, Hussein MA, Richards DA, Sawrycki P, Bulat I, Hamm JT, Hart LL, Adler S, Antal JM, Lai AY, Sorrentino JA, Yang Z, Malik RK, Morris SR, Roberts PJ, Dragnev KH. Myelopreservation with the CDK4/6 inhibitor trilaciclib in patients with small-cell lung cancer receiving first-line chemotherapy: a phase Ib/randomized phase II trial. Ann Oncol. 2019;30(10):1613–1621. doi: 10.1093/annonc/mdz278. - DOI - PMC - PubMed

Publication types

Associated data